MAE203 - Global Economy Assignment: Data Analysis Report
VerifiedAdded on 2023/04/23
|17
|3921
|467
Report
AI Summary
This assignment delves into a comprehensive analysis of the global economy, examining key economic indicators across various countries. The report begins with data collection, presentation, and analysis of real GDP and Total Factor Productivity (TFP) for Australia, China, France, Germany, Japan, Spain, the United Kingdom, and the United States. The analysis highlights the trends and comparisons of these indicators. The assignment then proceeds to analyze per capita GDP, import values, government debt, and final government expenditure for France, Germany, Australia, and Japan, providing insights into their economic performance. Finally, the report examines the relationship between unfilled job vacancies and the unemployment rate in Australia, offering a perspective on the labor market dynamics. The assignment also includes short answer questions and a career education component, reflecting on the expectations of economics graduates. The student has developed graphs and tables to support the data analysis.
1
.
GLOBAL ECONOMY
.
GLOBAL ECONOMY
Paraphrase This Document
Need a fresh take? Get an instant paraphrase of this document with our AI Paraphraser

2
Contents
Part A- Data collection, Presentation and analysis....................................................................3
Part B- Short answer question..................................................................................................12
Part C........................................................................................................................................12
Reference..................................................................................................................................15
3
Part A- Data collection, Presentation and analysis
Question 1
Australia
1960
1965
1970
1975
1980
1985
1990
1995
2000
2005
2010
2015
0.00
200000.00
400000.00
600000.00
800000.00
1000000.00
1200000.00
0.00
0.20
0.40
0.60
0.80
1.00
1.20
TFP and real GDP for australia
Real GDP
Total factor productivity
Real GDP
Total Factor Productivity
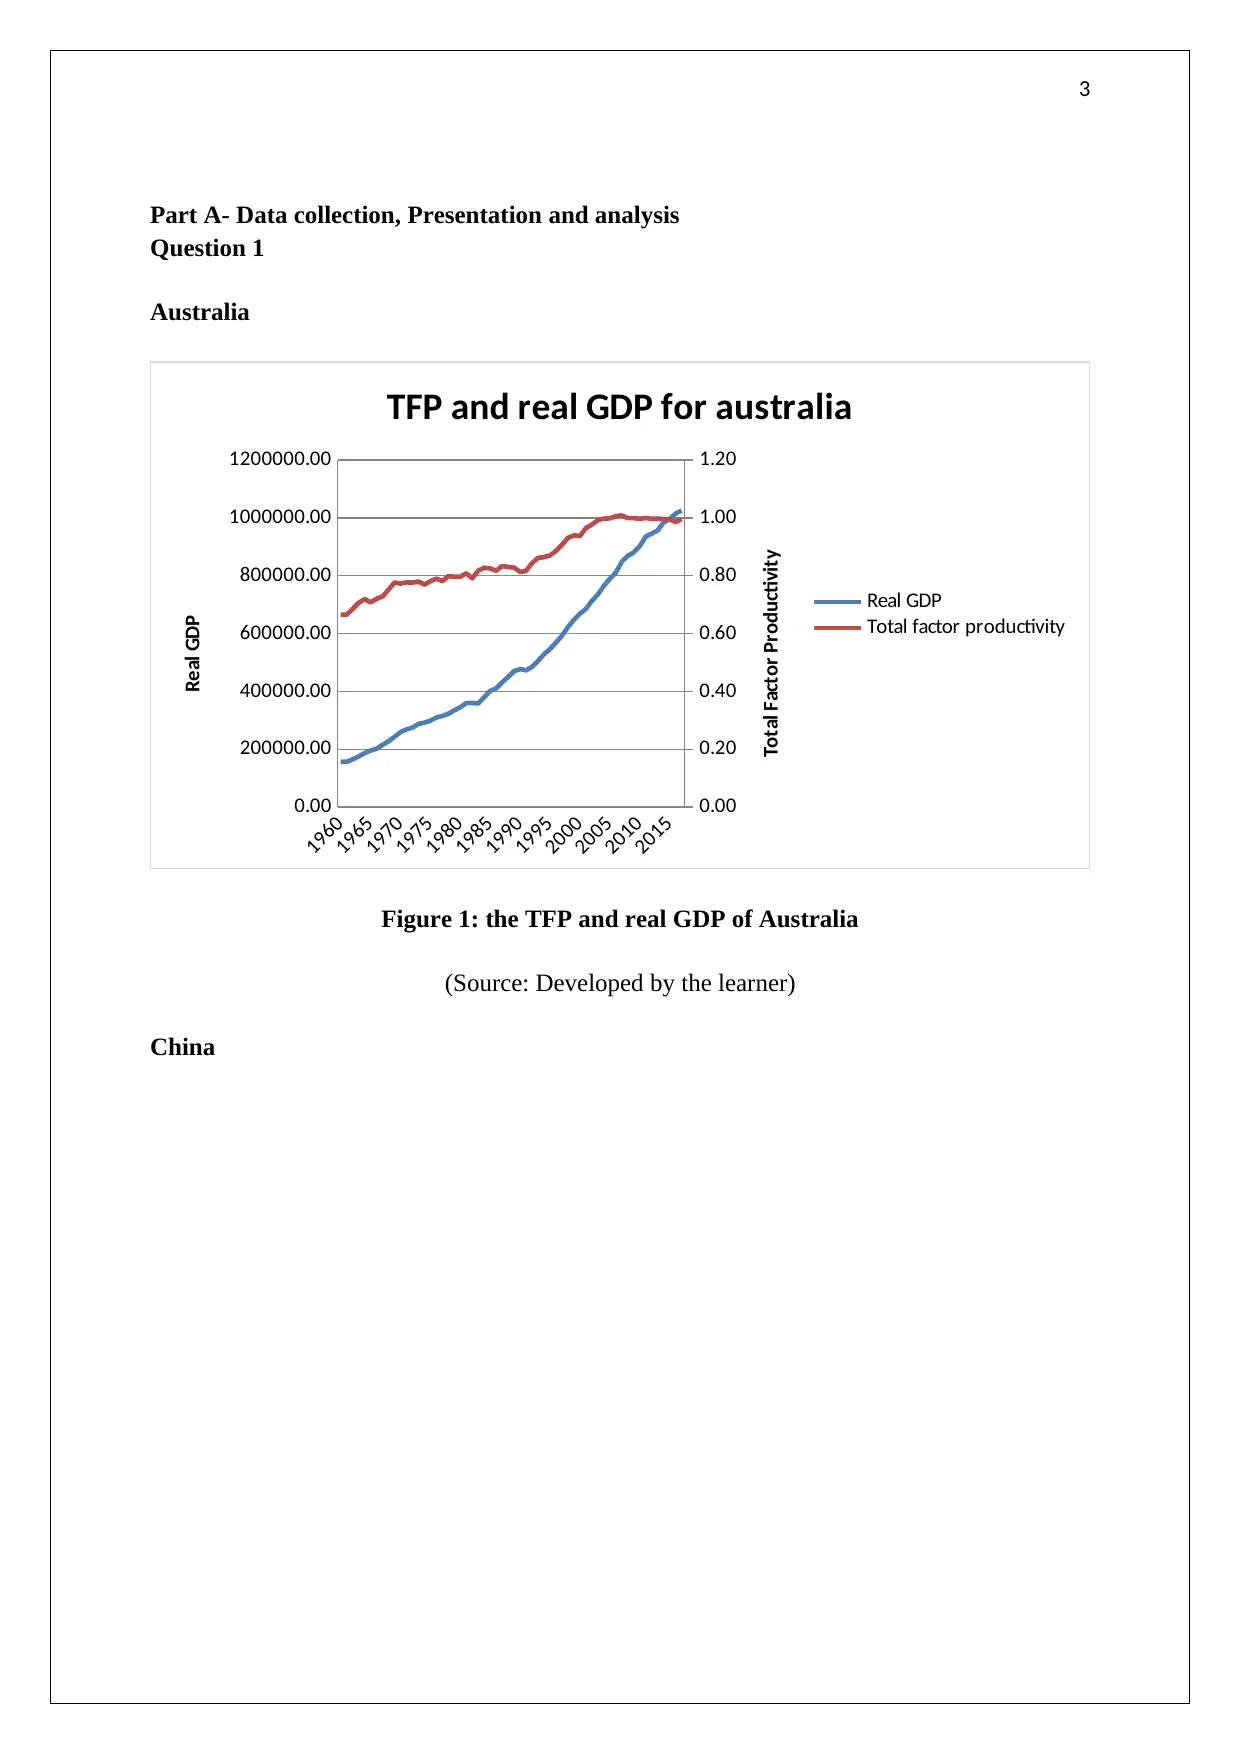
Figure 1: the TFP and real GDP of Australia
(Source: Developed by the learner)
China
Part A- Data collection, Presentation and analysis
Question 1
Australia
1960
1965
1970
1975
1980
1985
1990
1995
2000
2005
2010
2015
0.00
200000.00
400000.00
600000.00
800000.00
1000000.00
1200000.00
0.00
0.20
0.40
0.60
0.80
1.00
1.20
TFP and real GDP for australia
Real GDP
Total factor productivity
Real GDP
Total Factor Productivity
Figure 1: the TFP and real GDP of Australia
(Source: Developed by the learner)
China
⊘ This is a preview!⊘
Do you want full access?
Subscribe today to unlock all pages.
Trusted by 1+ million students worldwide
4
1952
1956
1960
1964
1968
1972
1976
1980
1984
1988
1992
1996
2000
2004
2008
2012
2016
0.00
0.20
0.40
0.60
0.80
1.00
1.20
0.00
2000000.00
4000000.00
6000000.00
8000000.00
10000000.00
12000000.00
14000000.00
16000000.00
18000000.00
20000000.00
TFP and real GDP of China
Total factor productivity Real GDP
Year
Real GDP
Total Factor Productivity
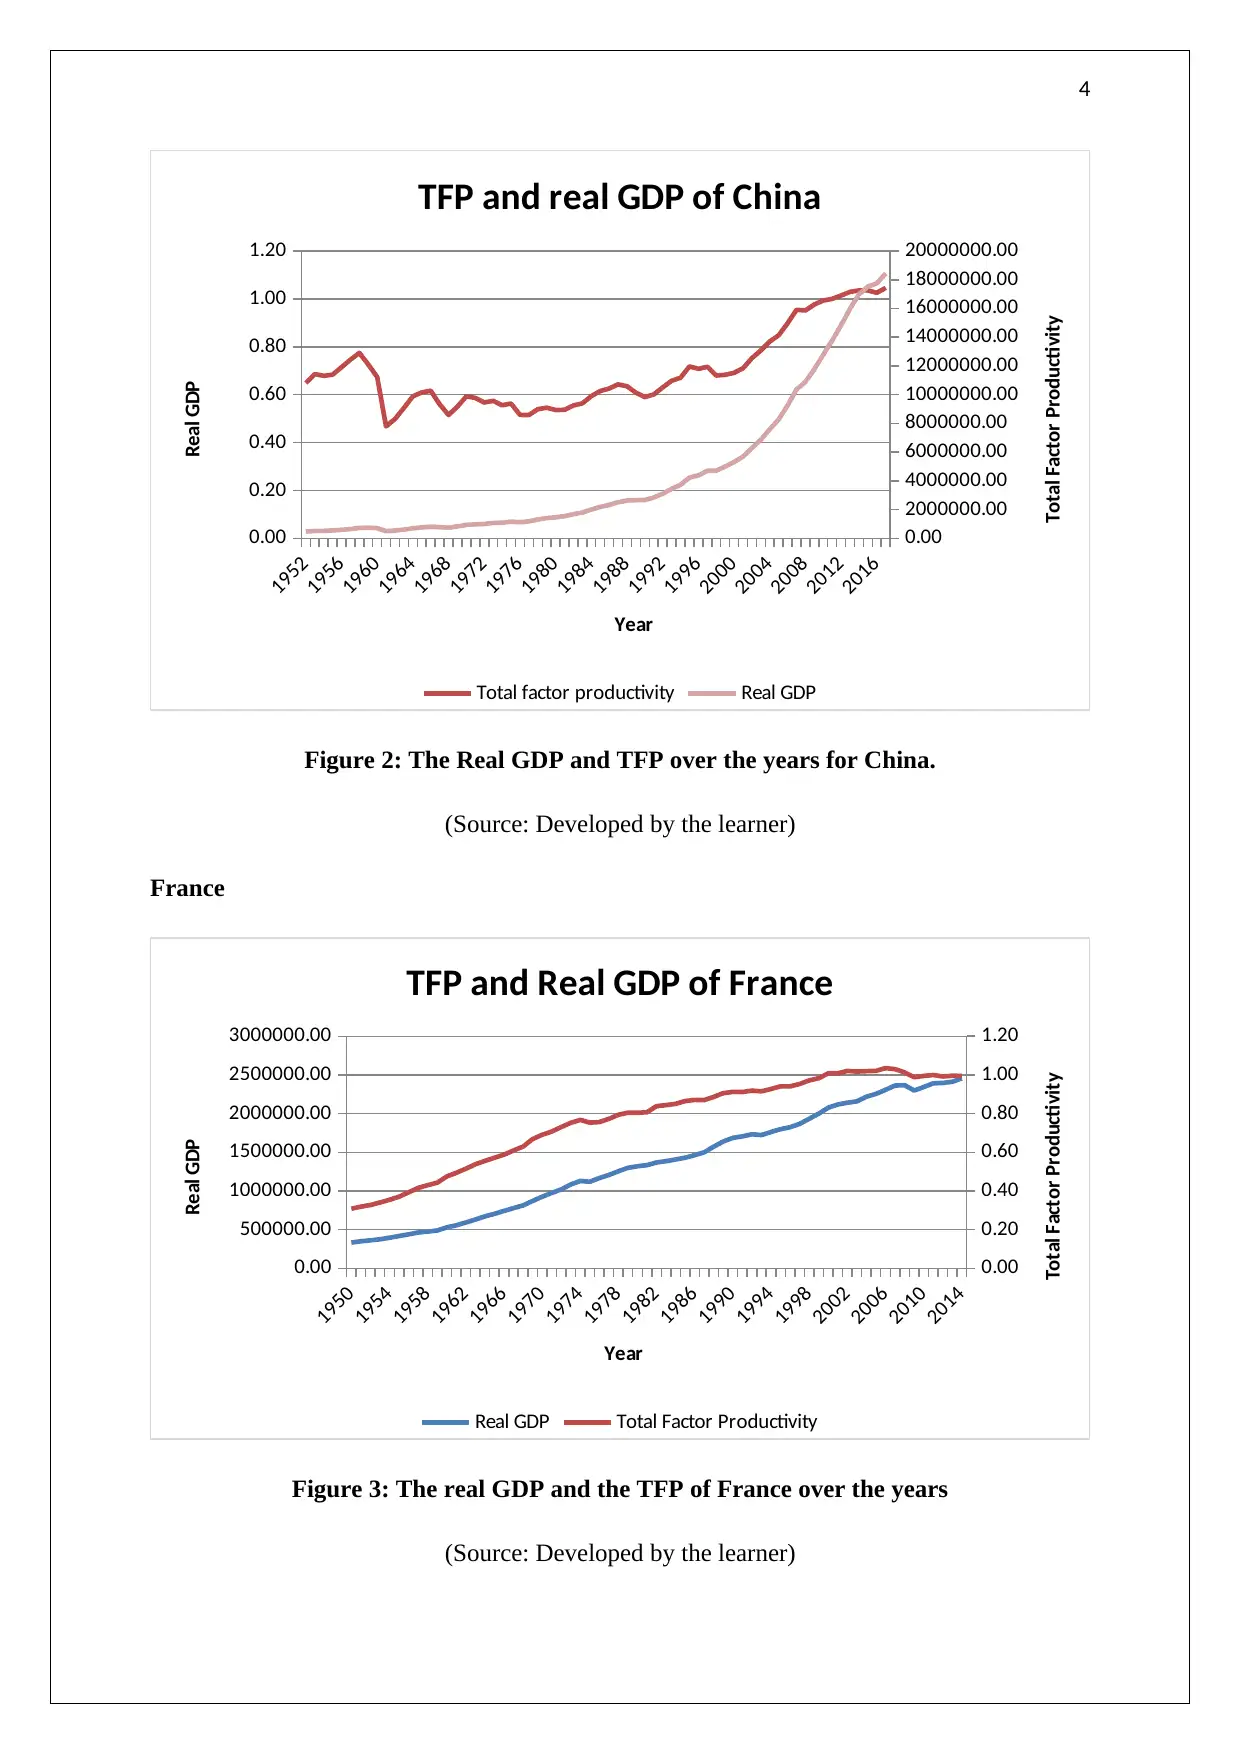
Figure 2: The Real GDP and TFP over the years for China.
(Source: Developed by the learner)
France
1950
1954
1958
1962
1966
1970
1974
1978
1982
1986
1990
1994
1998
2002
2006
2010
2014
0.00
500000.00
1000000.00
1500000.00
2000000.00
2500000.00
3000000.00
0.00
0.20
0.40
0.60
0.80
1.00
1.20
TFP and Real GDP of France
Real GDP Total Factor Productivity
Year
Real GDP
Total Factor Productivity
Figure 3: The real GDP and the TFP of France over the years
(Source: Developed by the learner)
1952
1956
1960
1964
1968
1972
1976
1980
1984
1988
1992
1996
2000
2004
2008
2012
2016
0.00
0.20
0.40
0.60
0.80
1.00
1.20
0.00
2000000.00
4000000.00
6000000.00
8000000.00
10000000.00
12000000.00
14000000.00
16000000.00
18000000.00
20000000.00
TFP and real GDP of China
Total factor productivity Real GDP
Year
Real GDP
Total Factor Productivity
Figure 2: The Real GDP and TFP over the years for China.
(Source: Developed by the learner)
France
1950
1954
1958
1962
1966
1970
1974
1978
1982
1986
1990
1994
1998
2002
2006
2010
2014
0.00
500000.00
1000000.00
1500000.00
2000000.00
2500000.00
3000000.00
0.00
0.20
0.40
0.60
0.80
1.00
1.20
TFP and Real GDP of France
Real GDP Total Factor Productivity
Year
Real GDP
Total Factor Productivity
Figure 3: The real GDP and the TFP of France over the years
(Source: Developed by the learner)
Paraphrase This Document
Need a fresh take? Get an instant paraphrase of this document with our AI Paraphraser
5
Germany
1950
1954
1958
1962
1966
1970
1974
1978
1982
1986
1990
1994
1998
2002
2006
2010
2014
0.00
500000.00
1000000.00
1500000.00
2000000.00
2500000.00
3000000.00
3500000.00
4000000.00
0.00
0.20
0.40
0.60
0.80
1.00
1.20
TFP and Real GDP of Germany
Real GDP Total Factor Productivity
Year
Real GDP
Total Factor Productivity
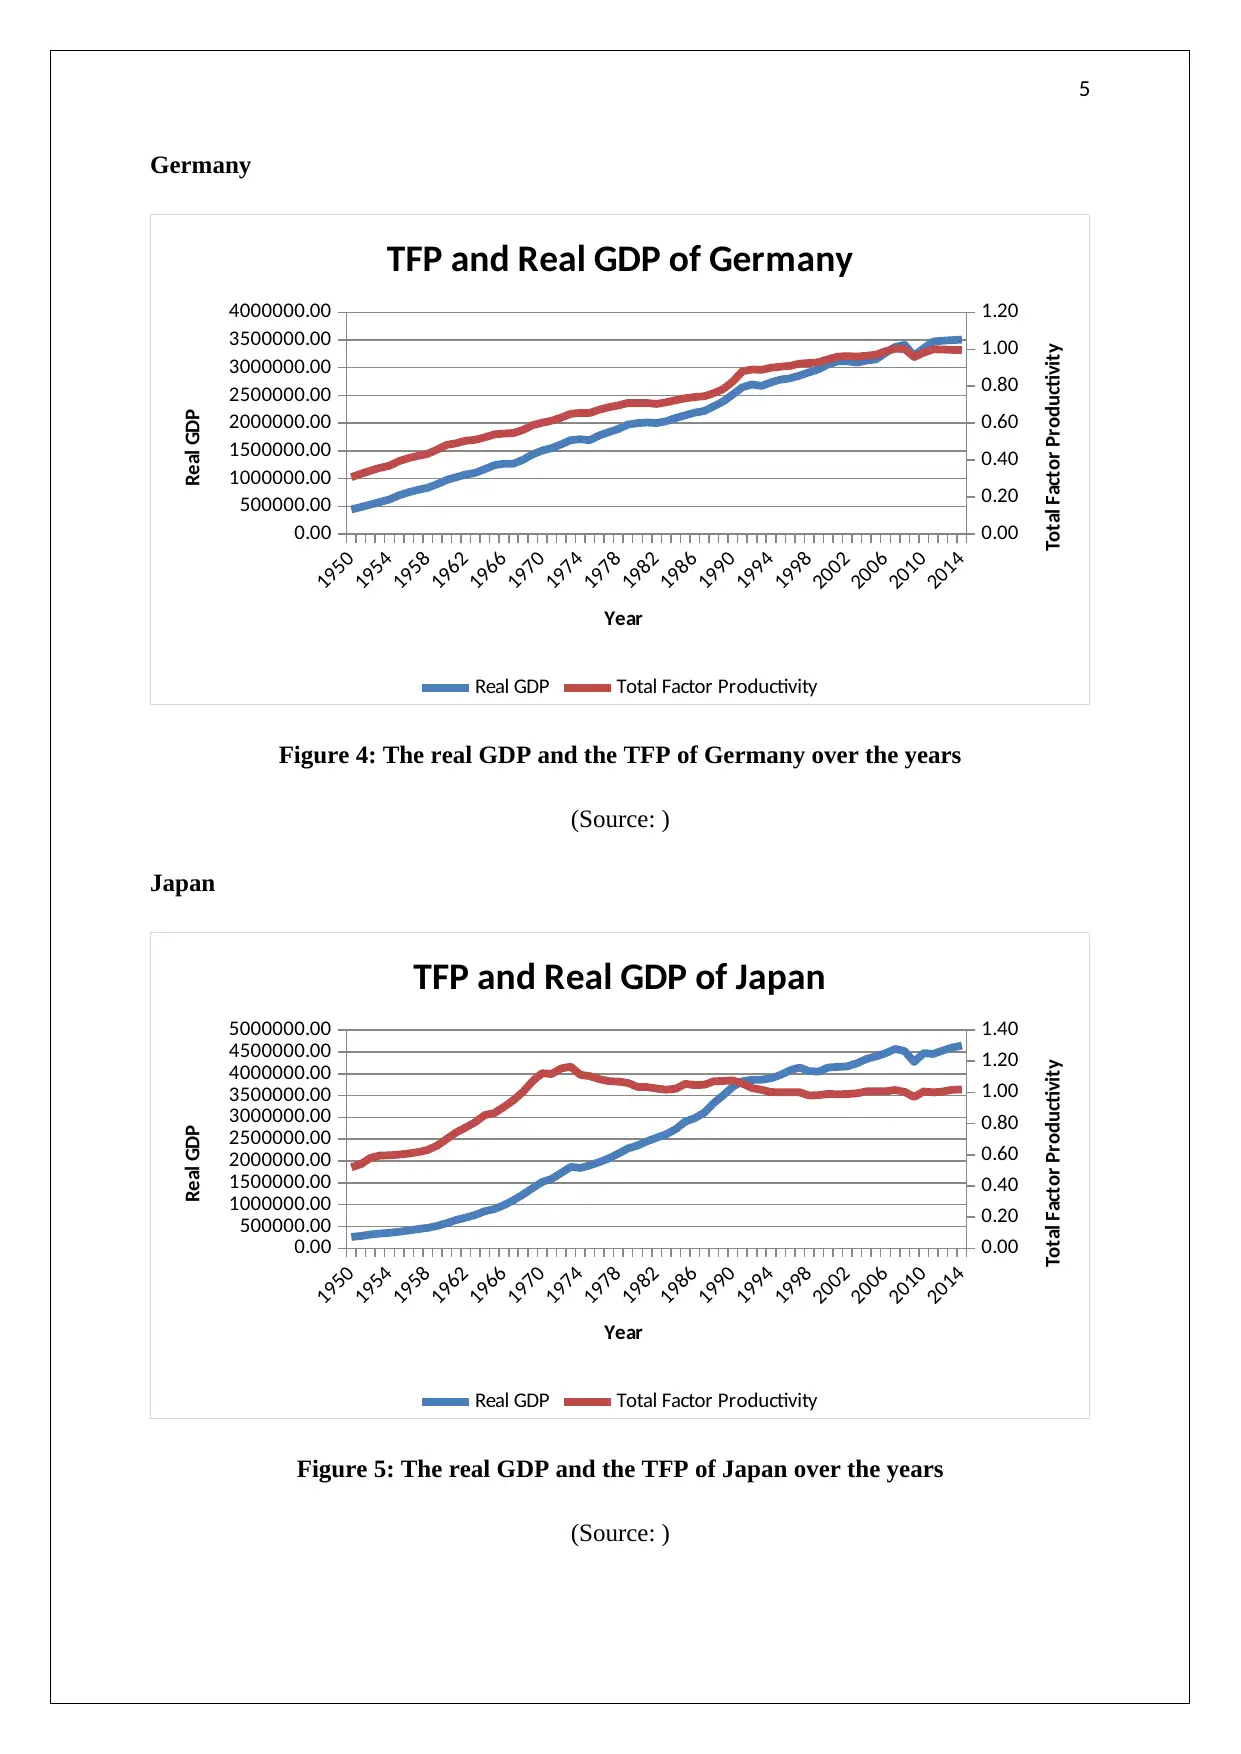
Figure 4: The real GDP and the TFP of Germany over the years
(Source: )
Japan
1950
1954
1958
1962
1966
1970
1974
1978
1982
1986
1990
1994
1998
2002
2006
2010
2014
0.00
500000.00
1000000.00
1500000.00
2000000.00
2500000.00
3000000.00
3500000.00
4000000.00
4500000.00
5000000.00
0.00
0.20
0.40
0.60
0.80
1.00
1.20
1.40
TFP and Real GDP of Japan
Real GDP Total Factor Productivity
Year
Real GDP
Total Factor Productivity
Figure 5: The real GDP and the TFP of Japan over the years
(Source: )
Germany
1950
1954
1958
1962
1966
1970
1974
1978
1982
1986
1990
1994
1998
2002
2006
2010
2014
0.00
500000.00
1000000.00
1500000.00
2000000.00
2500000.00
3000000.00
3500000.00
4000000.00
0.00
0.20
0.40
0.60
0.80
1.00
1.20
TFP and Real GDP of Germany
Real GDP Total Factor Productivity
Year
Real GDP
Total Factor Productivity
Figure 4: The real GDP and the TFP of Germany over the years
(Source: )
Japan
1950
1954
1958
1962
1966
1970
1974
1978
1982
1986
1990
1994
1998
2002
2006
2010
2014
0.00
500000.00
1000000.00
1500000.00
2000000.00
2500000.00
3000000.00
3500000.00
4000000.00
4500000.00
5000000.00
0.00
0.20
0.40
0.60
0.80
1.00
1.20
1.40
TFP and Real GDP of Japan
Real GDP Total Factor Productivity
Year
Real GDP
Total Factor Productivity
Figure 5: The real GDP and the TFP of Japan over the years
(Source: )
6
Spain
1950
1954
1958
1962
1966
1970
1974
1978
1982
1986
1990
1994
1998
2002
2006
2010
2014
0.00
200,000.00
400,000.00
600,000.00
800,000.00
1,000,000.00
1,200,000.00
1,400,000.00
1,600,000.00
1,800,000.00
0.00
0.20
0.40
0.60
0.80
1.00
1.20
TFP and real GDP of Spain
Real GDP Total Factor Productivity
Year
Real GDP
Total Factor Productivity
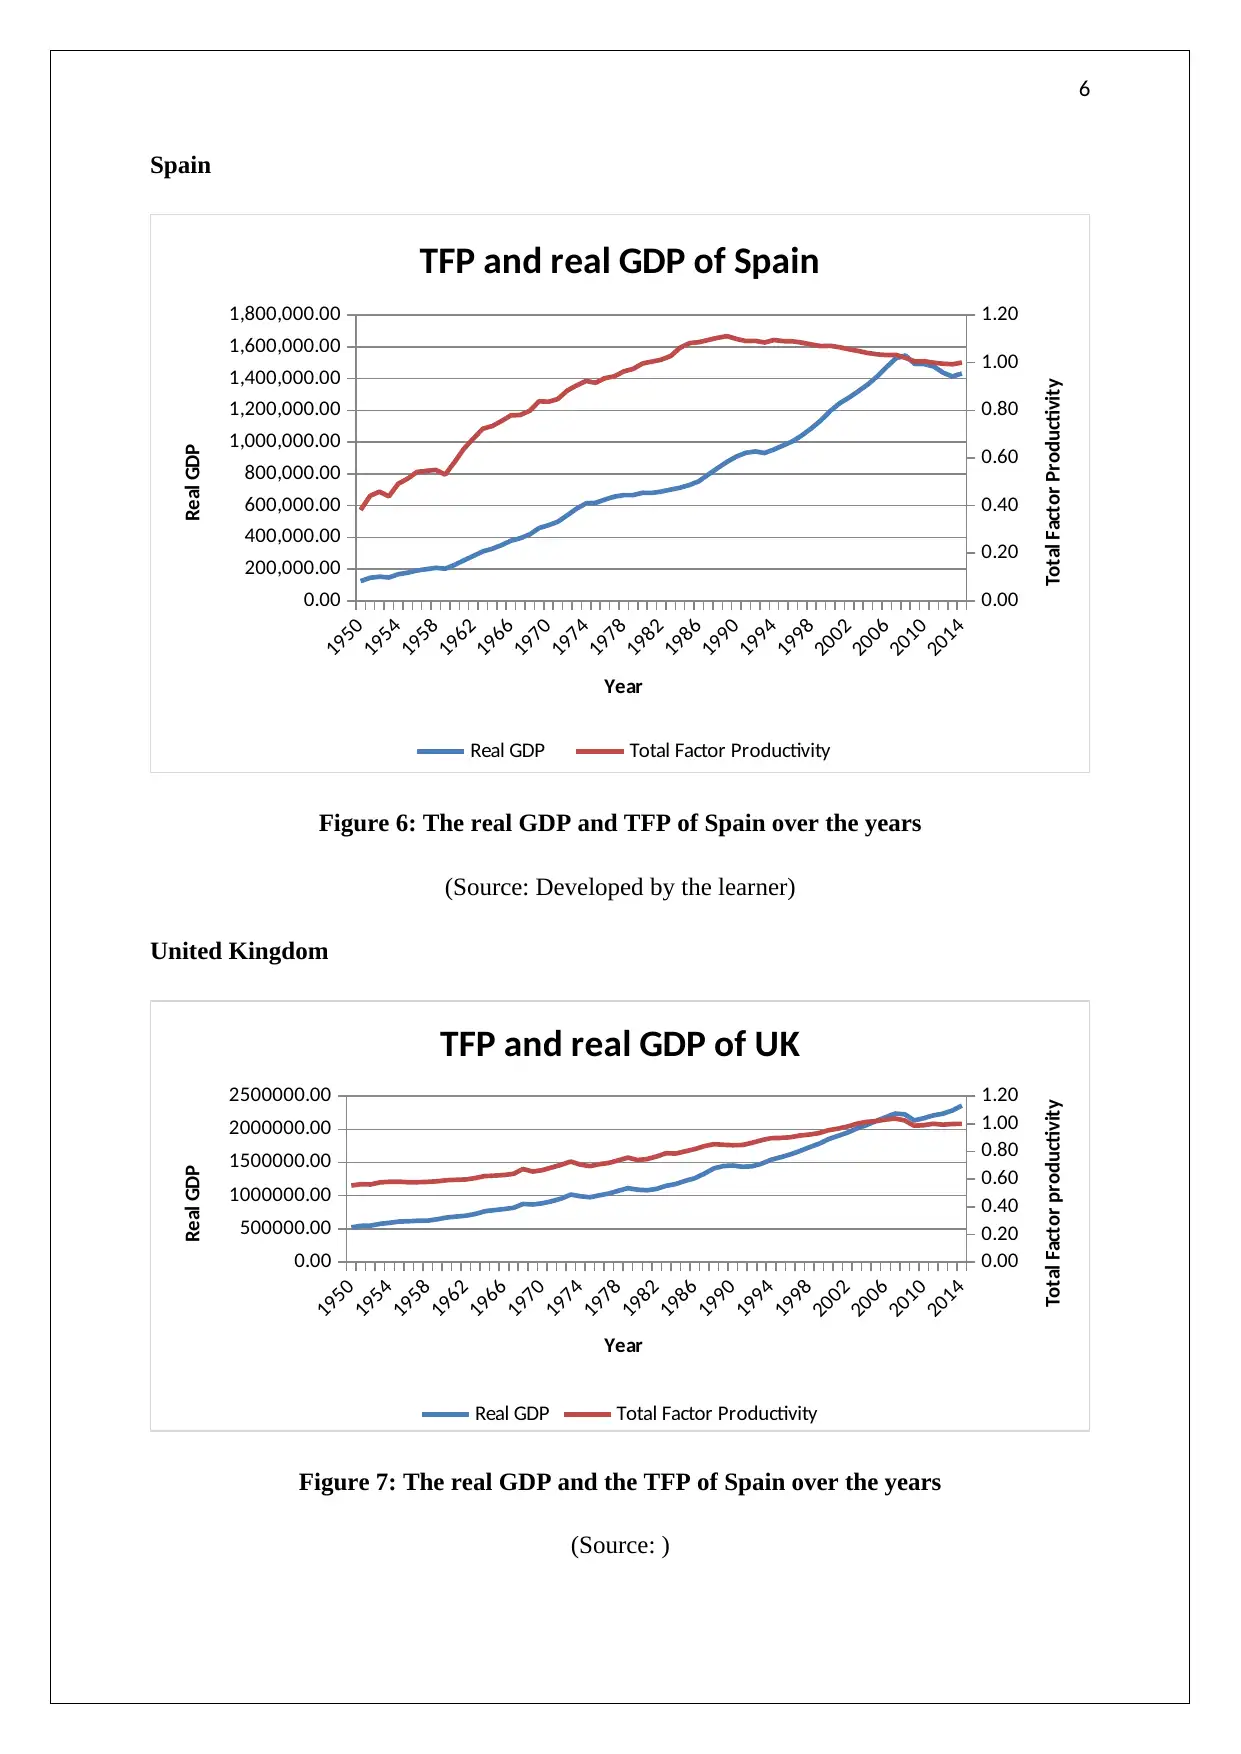
Figure 6: The real GDP and TFP of Spain over the years
(Source: Developed by the learner)
United Kingdom
1950
1954
1958
1962
1966
1970
1974
1978
1982
1986
1990
1994
1998
2002
2006
2010
2014
0.00
500000.00
1000000.00
1500000.00
2000000.00
2500000.00
0.00
0.20
0.40
0.60
0.80
1.00
1.20
TFP and real GDP of UK
Real GDP Total Factor Productivity
Year
Real GDP
Total Factor productivity
Figure 7: The real GDP and the TFP of Spain over the years
(Source: )
Spain
1950
1954
1958
1962
1966
1970
1974
1978
1982
1986
1990
1994
1998
2002
2006
2010
2014
0.00
200,000.00
400,000.00
600,000.00
800,000.00
1,000,000.00
1,200,000.00
1,400,000.00
1,600,000.00
1,800,000.00
0.00
0.20
0.40
0.60
0.80
1.00
1.20
TFP and real GDP of Spain
Real GDP Total Factor Productivity
Year
Real GDP
Total Factor Productivity
Figure 6: The real GDP and TFP of Spain over the years
(Source: Developed by the learner)
United Kingdom
1950
1954
1958
1962
1966
1970
1974
1978
1982
1986
1990
1994
1998
2002
2006
2010
2014
0.00
500000.00
1000000.00
1500000.00
2000000.00
2500000.00
0.00
0.20
0.40
0.60
0.80
1.00
1.20
TFP and real GDP of UK
Real GDP Total Factor Productivity
Year
Real GDP
Total Factor productivity
Figure 7: The real GDP and the TFP of Spain over the years
(Source: )
⊘ This is a preview!⊘
Do you want full access?
Subscribe today to unlock all pages.
Trusted by 1+ million students worldwide
7
United States
1950
1954
1958
1962
1966
1970
1974
1978
1982
1986
1990
1994
1998
2002
2006
2010
2014
0.00
2000000.00
4000000.00
6000000.00
8000000.00
10000000.00
12000000.00
14000000.00
16000000.00
18000000.00
0.00
0.20
0.40
0.60
0.80
1.00
1.20
TFP and real GDP of the USA
Real GDP Total Factor Productivity
year
Real GDP
Total Factor Productivity
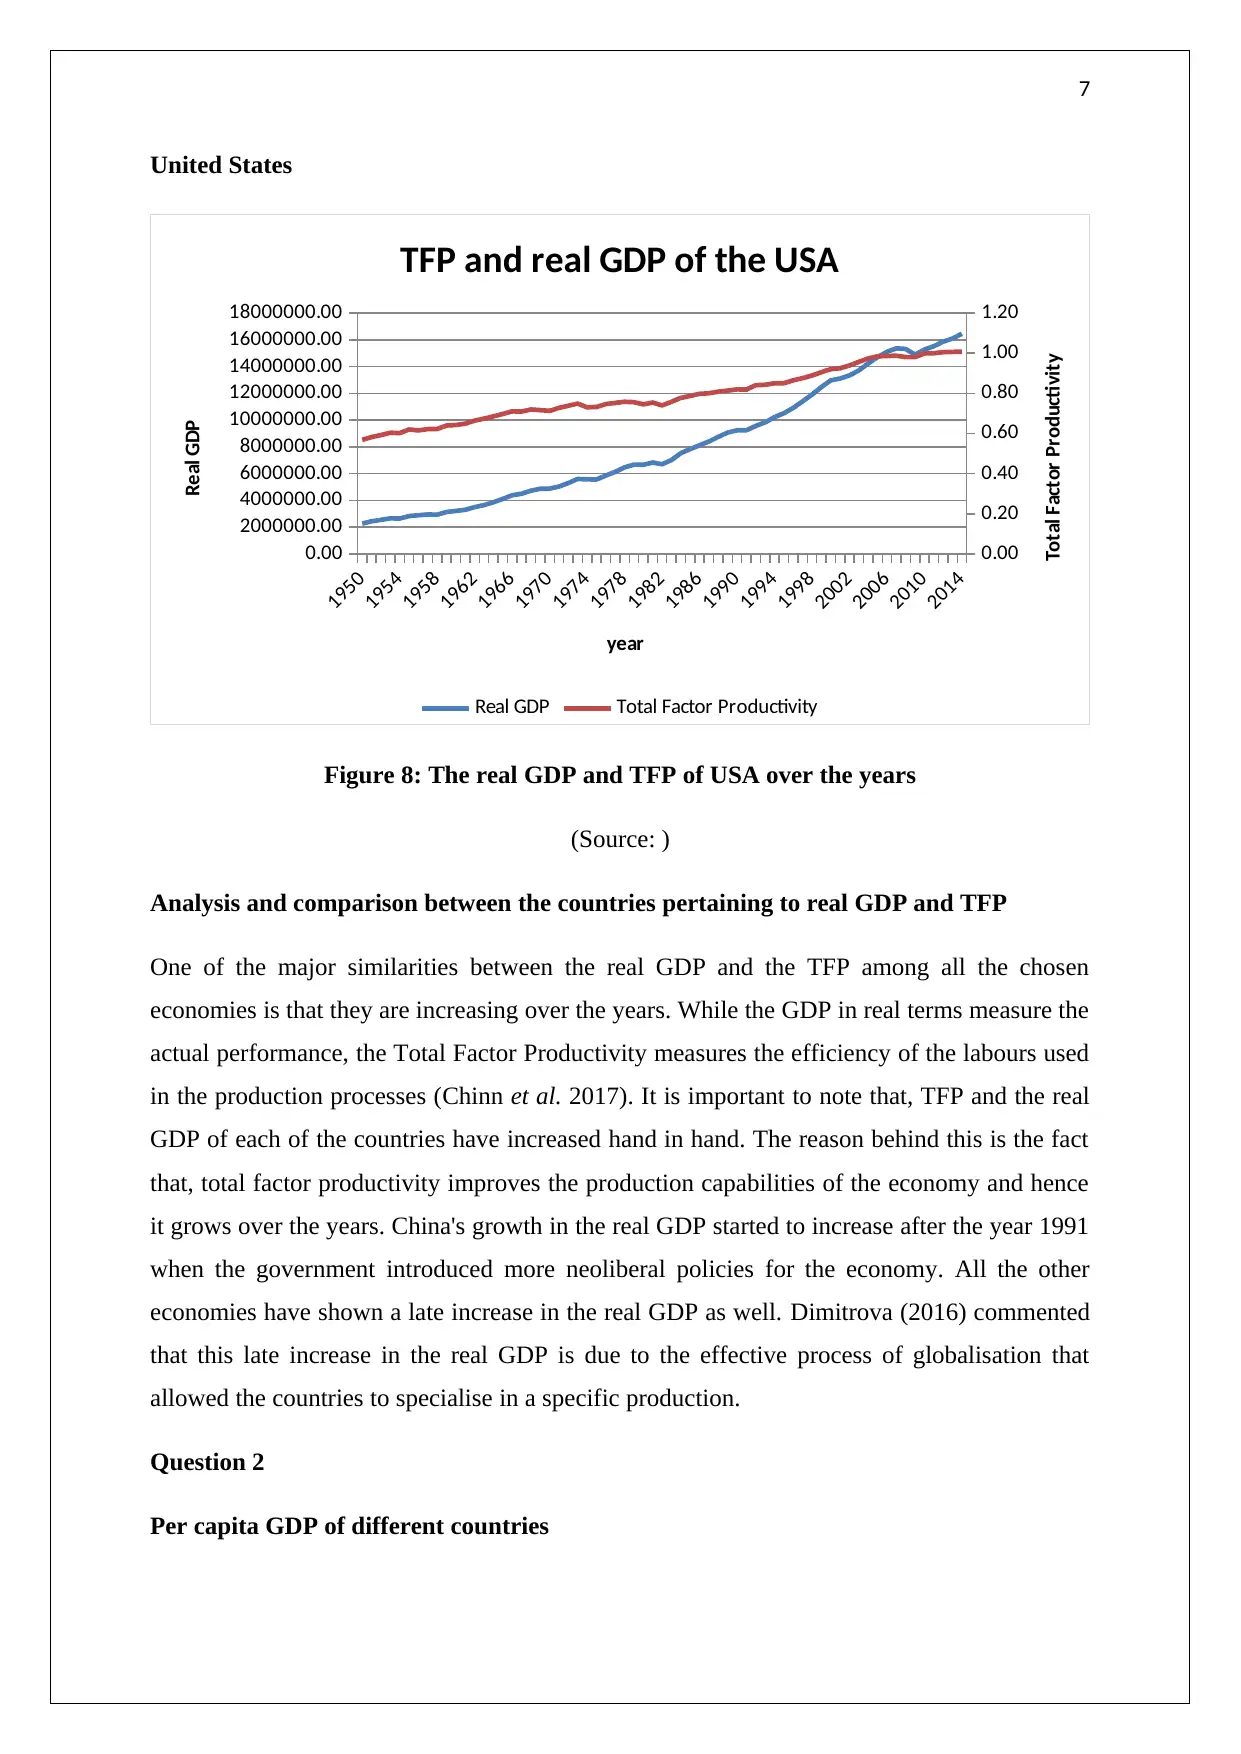
Figure 8: The real GDP and TFP of USA over the years
(Source: )
Analysis and comparison between the countries pertaining to real GDP and TFP
One of the major similarities between the real GDP and the TFP among all the chosen
economies is that they are increasing over the years. While the GDP in real terms measure the
actual performance, the Total Factor Productivity measures the efficiency of the labours used
in the production processes (Chinn et al. 2017). It is important to note that, TFP and the real
GDP of each of the countries have increased hand in hand. The reason behind this is the fact
that, total factor productivity improves the production capabilities of the economy and hence
it grows over the years. China's growth in the real GDP started to increase after the year 1991
when the government introduced more neoliberal policies for the economy. All the other
economies have shown a late increase in the real GDP as well. Dimitrova (2016) commented
that this late increase in the real GDP is due to the effective process of globalisation that
allowed the countries to specialise in a specific production.
Question 2
Per capita GDP of different countries
United States
1950
1954
1958
1962
1966
1970
1974
1978
1982
1986
1990
1994
1998
2002
2006
2010
2014
0.00
2000000.00
4000000.00
6000000.00
8000000.00
10000000.00
12000000.00
14000000.00
16000000.00
18000000.00
0.00
0.20
0.40
0.60
0.80
1.00
1.20
TFP and real GDP of the USA
Real GDP Total Factor Productivity
year
Real GDP
Total Factor Productivity
Figure 8: The real GDP and TFP of USA over the years
(Source: )
Analysis and comparison between the countries pertaining to real GDP and TFP
One of the major similarities between the real GDP and the TFP among all the chosen
economies is that they are increasing over the years. While the GDP in real terms measure the
actual performance, the Total Factor Productivity measures the efficiency of the labours used
in the production processes (Chinn et al. 2017). It is important to note that, TFP and the real
GDP of each of the countries have increased hand in hand. The reason behind this is the fact
that, total factor productivity improves the production capabilities of the economy and hence
it grows over the years. China's growth in the real GDP started to increase after the year 1991
when the government introduced more neoliberal policies for the economy. All the other
economies have shown a late increase in the real GDP as well. Dimitrova (2016) commented
that this late increase in the real GDP is due to the effective process of globalisation that
allowed the countries to specialise in a specific production.
Question 2
Per capita GDP of different countries
Paraphrase This Document
Need a fresh take? Get an instant paraphrase of this document with our AI Paraphraser
8
Year France Germany Australia Japan
2000 38460.7 42169.7 44313.3 42169.7
2001 38928 42239.2 44565 42239.2
2002 39078.2 42190.8 45786.6 42190.8
2003 39120.2 42744 46575.4 42744
2004 39915.3 43671.7 47880.6 43671.7
2005 40252.4 44393.6 48760.4 44393.6
2006 40922.1 44995.5 49408.1 44995.5
2007 41630.1 45687.3 50955.1 45687.3
2008 41478.9 45165.8 51770.9 45165.8
2009 40052.3 42724.8 51689.9 42724.8
2010 40638.3 44507.7 51936.9 44507.7
2011 41283.2 44538.7 52475.7 44538.7
2012 41158.9 45276.9 53553.2 45276.9
2013 41183.5 46249.2 54008.7 46249.2
2014 41374.8 46484.2 54546.2 46484.2
2015 41642.3 47163.5 55017.3 47163.5
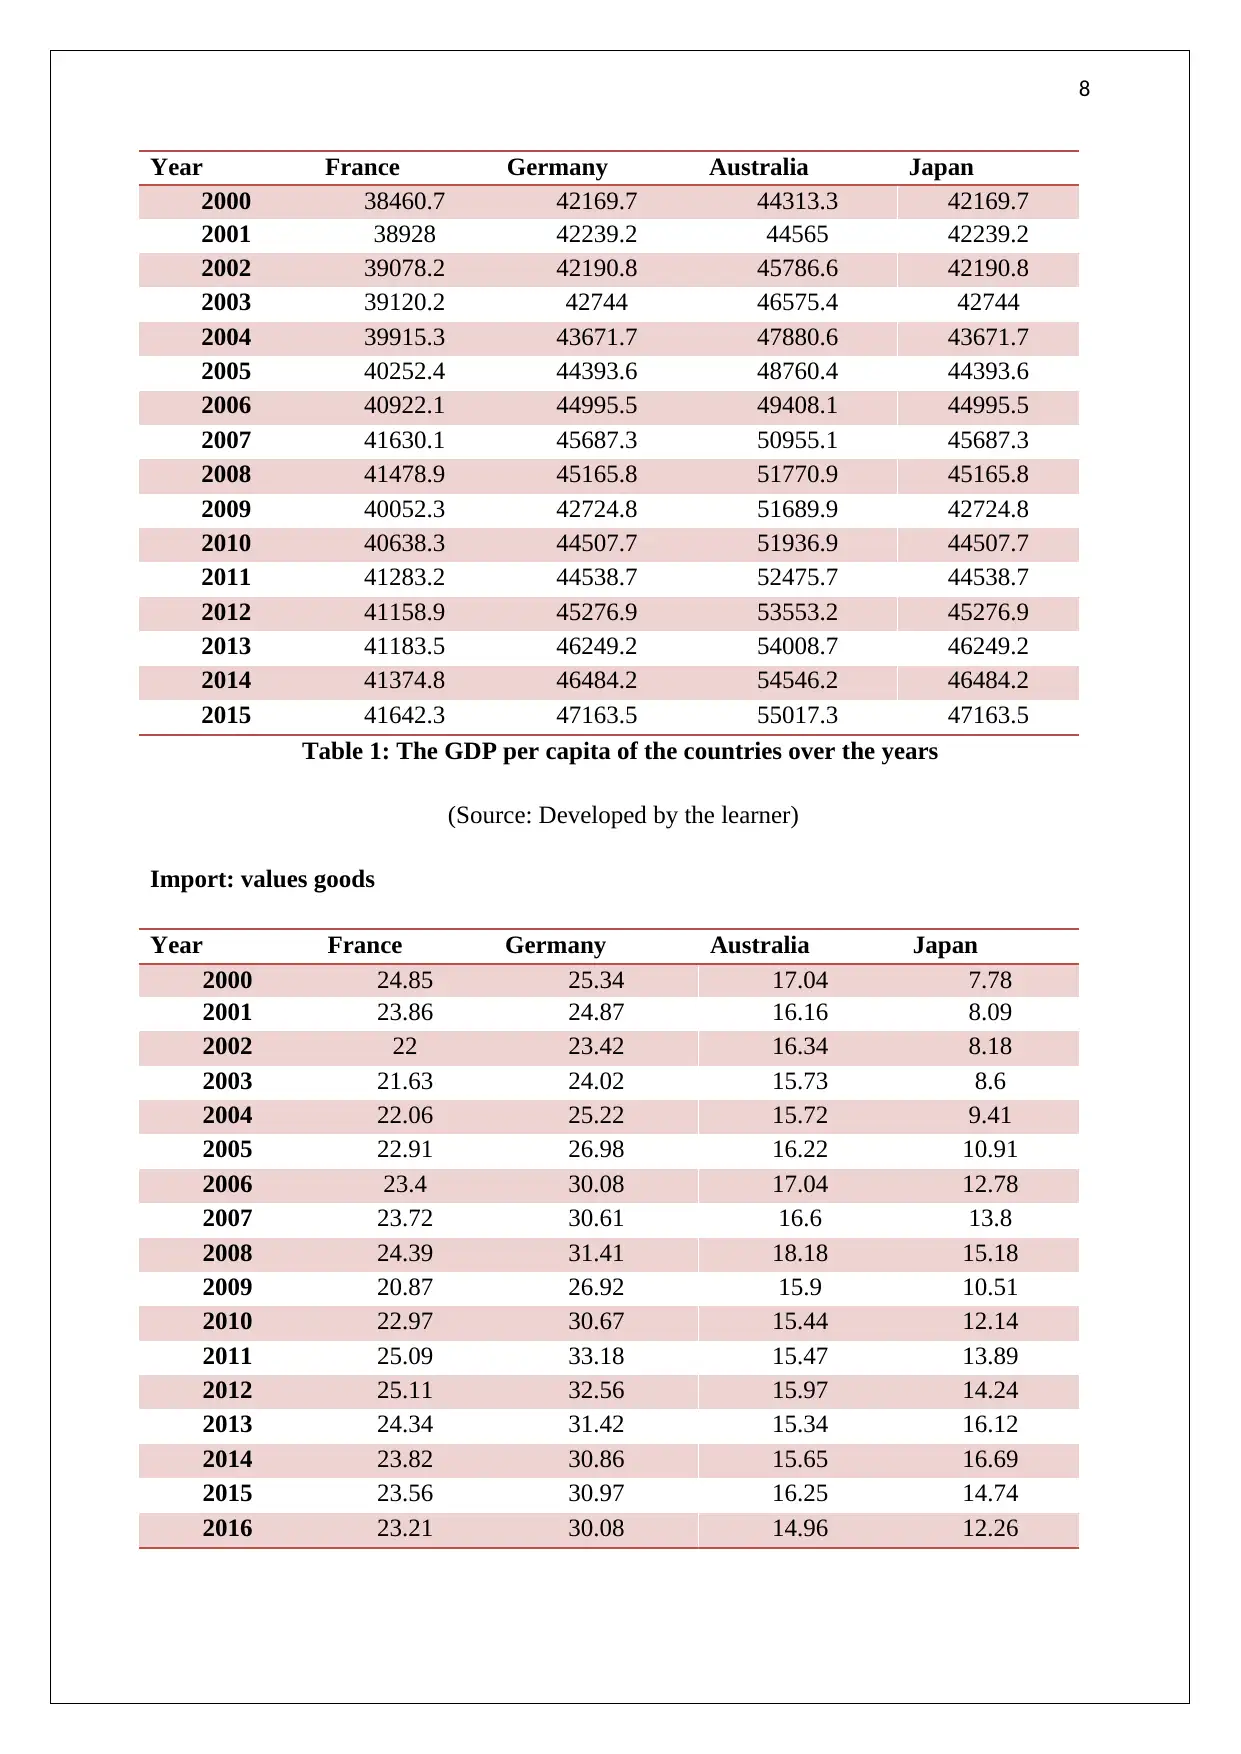
Table 1: The GDP per capita of the countries over the years
(Source: Developed by the learner)
Import: values goods
Year France Germany Australia Japan
2000 24.85 25.34 17.04 7.78
2001 23.86 24.87 16.16 8.09
2002 22 23.42 16.34 8.18
2003 21.63 24.02 15.73 8.6
2004 22.06 25.22 15.72 9.41
2005 22.91 26.98 16.22 10.91
2006 23.4 30.08 17.04 12.78
2007 23.72 30.61 16.6 13.8
2008 24.39 31.41 18.18 15.18
2009 20.87 26.92 15.9 10.51
2010 22.97 30.67 15.44 12.14
2011 25.09 33.18 15.47 13.89
2012 25.11 32.56 15.97 14.24
2013 24.34 31.42 15.34 16.12
2014 23.82 30.86 15.65 16.69
2015 23.56 30.97 16.25 14.74
2016 23.21 30.08 14.96 12.26
Year France Germany Australia Japan
2000 38460.7 42169.7 44313.3 42169.7
2001 38928 42239.2 44565 42239.2
2002 39078.2 42190.8 45786.6 42190.8
2003 39120.2 42744 46575.4 42744
2004 39915.3 43671.7 47880.6 43671.7
2005 40252.4 44393.6 48760.4 44393.6
2006 40922.1 44995.5 49408.1 44995.5
2007 41630.1 45687.3 50955.1 45687.3
2008 41478.9 45165.8 51770.9 45165.8
2009 40052.3 42724.8 51689.9 42724.8
2010 40638.3 44507.7 51936.9 44507.7
2011 41283.2 44538.7 52475.7 44538.7
2012 41158.9 45276.9 53553.2 45276.9
2013 41183.5 46249.2 54008.7 46249.2
2014 41374.8 46484.2 54546.2 46484.2
2015 41642.3 47163.5 55017.3 47163.5
Table 1: The GDP per capita of the countries over the years
(Source: Developed by the learner)
Import: values goods
Year France Germany Australia Japan
2000 24.85 25.34 17.04 7.78
2001 23.86 24.87 16.16 8.09
2002 22 23.42 16.34 8.18
2003 21.63 24.02 15.73 8.6
2004 22.06 25.22 15.72 9.41
2005 22.91 26.98 16.22 10.91
2006 23.4 30.08 17.04 12.78
2007 23.72 30.61 16.6 13.8
2008 24.39 31.41 18.18 15.18
2009 20.87 26.92 15.9 10.51
2010 22.97 30.67 15.44 12.14
2011 25.09 33.18 15.47 13.89
2012 25.11 32.56 15.97 14.24
2013 24.34 31.42 15.34 16.12
2014 23.82 30.86 15.65 16.69
2015 23.56 30.97 16.25 14.74
2016 23.21 30.08 14.96 12.26
9
Table 2: The import values by countries
(Source: Developed by the learner)
Government debt
Year France Germany Australia Japan
2000 58.88 58.86 29.6 100.46
2001 58.34 57.75 27.82 104.44
2002 60.26 59.41 26 113.6
2003 64.42 63.07 25.19 124.03
2004 65.94 64.77 22.99 129.87
2005 67.38 66.99 22.53 130.46
2006 64.61 66.49 21.66 130.83
2007 64.54 63.66 20.35 134.22
2008 68.78 65.15 18.42 140.41
2009 83.04 72.58 24.1 158.87
2010 85.26 80.95 29.31 162.3
2011 87.83 78.62 30.64 177.96
2012 90.6 79.84 39.98 186.03
2013 93.41 77.51 38.1 188.88
2014 94.89 74.59 42.28 194.43
2015 95.58 70.9 47.04 197.04
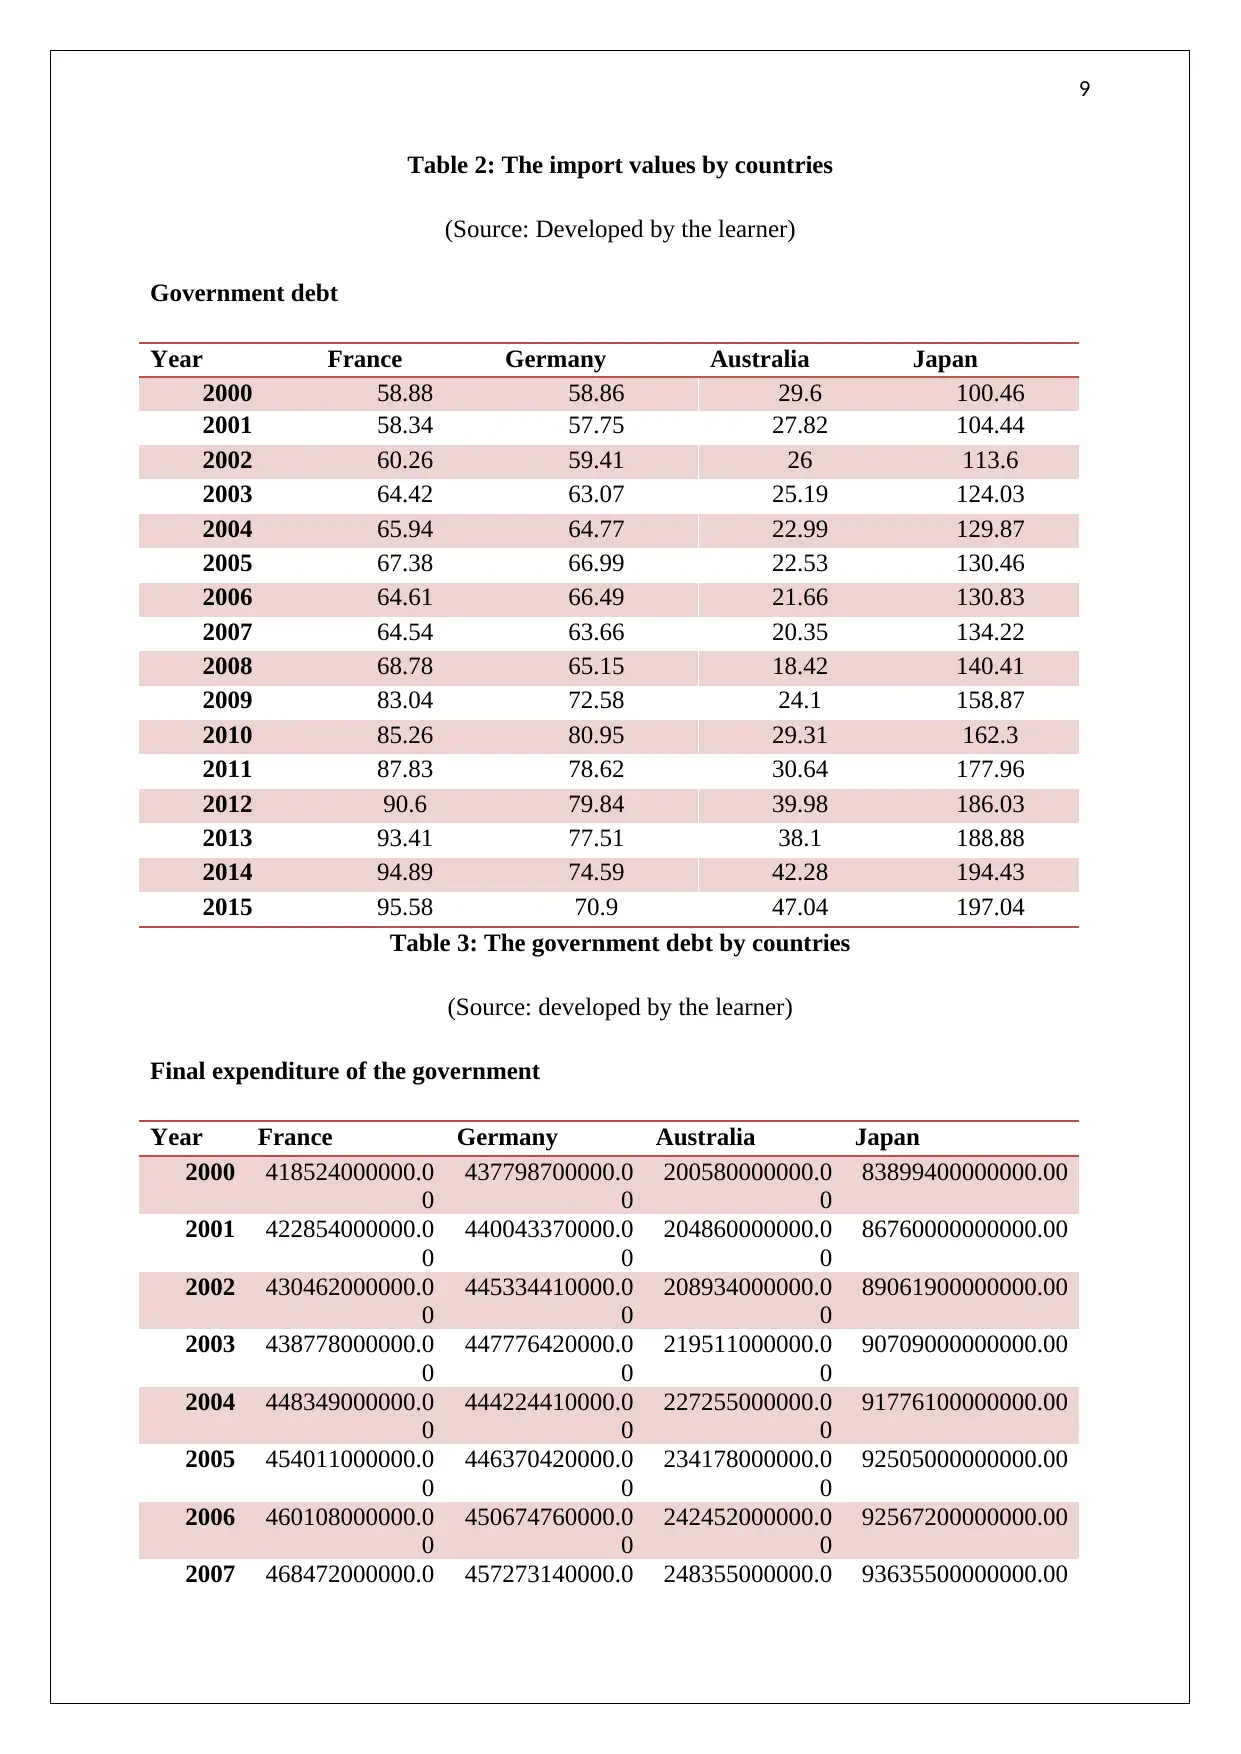
Table 3: The government debt by countries
(Source: developed by the learner)
Final expenditure of the government
Year France Germany Australia Japan
2000 418524000000.0
0
437798700000.0
0
200580000000.0
0
83899400000000.00
2001 422854000000.0
0
440043370000.0
0
204860000000.0
0
86760000000000.00
2002 430462000000.0
0
445334410000.0
0
208934000000.0
0
89061900000000.00
2003 438778000000.0
0
447776420000.0
0
219511000000.0
0
90709000000000.00
2004 448349000000.0
0
444224410000.0
0
227255000000.0
0
91776100000000.00
2005 454011000000.0
0
446370420000.0
0
234178000000.0
0
92505000000000.00
2006 460108000000.0
0
450674760000.0
0
242452000000.0
0
92567200000000.00
2007 468472000000.0 457273140000.0 248355000000.0 93635500000000.00
Table 2: The import values by countries
(Source: Developed by the learner)
Government debt
Year France Germany Australia Japan
2000 58.88 58.86 29.6 100.46
2001 58.34 57.75 27.82 104.44
2002 60.26 59.41 26 113.6
2003 64.42 63.07 25.19 124.03
2004 65.94 64.77 22.99 129.87
2005 67.38 66.99 22.53 130.46
2006 64.61 66.49 21.66 130.83
2007 64.54 63.66 20.35 134.22
2008 68.78 65.15 18.42 140.41
2009 83.04 72.58 24.1 158.87
2010 85.26 80.95 29.31 162.3
2011 87.83 78.62 30.64 177.96
2012 90.6 79.84 39.98 186.03
2013 93.41 77.51 38.1 188.88
2014 94.89 74.59 42.28 194.43
2015 95.58 70.9 47.04 197.04
Table 3: The government debt by countries
(Source: developed by the learner)
Final expenditure of the government
Year France Germany Australia Japan
2000 418524000000.0
0
437798700000.0
0
200580000000.0
0
83899400000000.00
2001 422854000000.0
0
440043370000.0
0
204860000000.0
0
86760000000000.00
2002 430462000000.0
0
445334410000.0
0
208934000000.0
0
89061900000000.00
2003 438778000000.0
0
447776420000.0
0
219511000000.0
0
90709000000000.00
2004 448349000000.0
0
444224410000.0
0
227255000000.0
0
91776100000000.00
2005 454011000000.0
0
446370420000.0
0
234178000000.0
0
92505000000000.00
2006 460108000000.0
0
450674760000.0
0
242452000000.0
0
92567200000000.00
2007 468472000000.0 457273140000.0 248355000000.0 93635500000000.00
⊘ This is a preview!⊘
Do you want full access?
Subscribe today to unlock all pages.
Trusted by 1+ million students worldwide
10
0 0 0
2008 473796000000.0
0
472788560000.0
0
258692000000.0
0
93561600000000.00
2009 485207000000.0
0
487021300000.0
0
264920000000.0
0
95472300000000.00
2010 491420000000.0
0
493336000000.0
0
271855000000.0
0
97323800000000.00
2011 496592000000.0
0
497961020000.0
0
283507000000.0
0
99204600000000.00
2012 504532000000.0
0
503202730000.0
0
287703000000.0
0
100869000000000.0
0
2013 511967000000.0
0
510010760000.0
0
291900000000.0
0
102382200000000.0
0
2014 518650000000.0
0
517965810000.0
0
293823000000.0
0
102937600000000.0
0
2015 523869000000.0
0
533160550000.0
0
305274000000.0
0
104524000000000.0
0
2016 531063000000.0
0
554225990000.0
0
321026000000.0
0
105914000000000.0
0
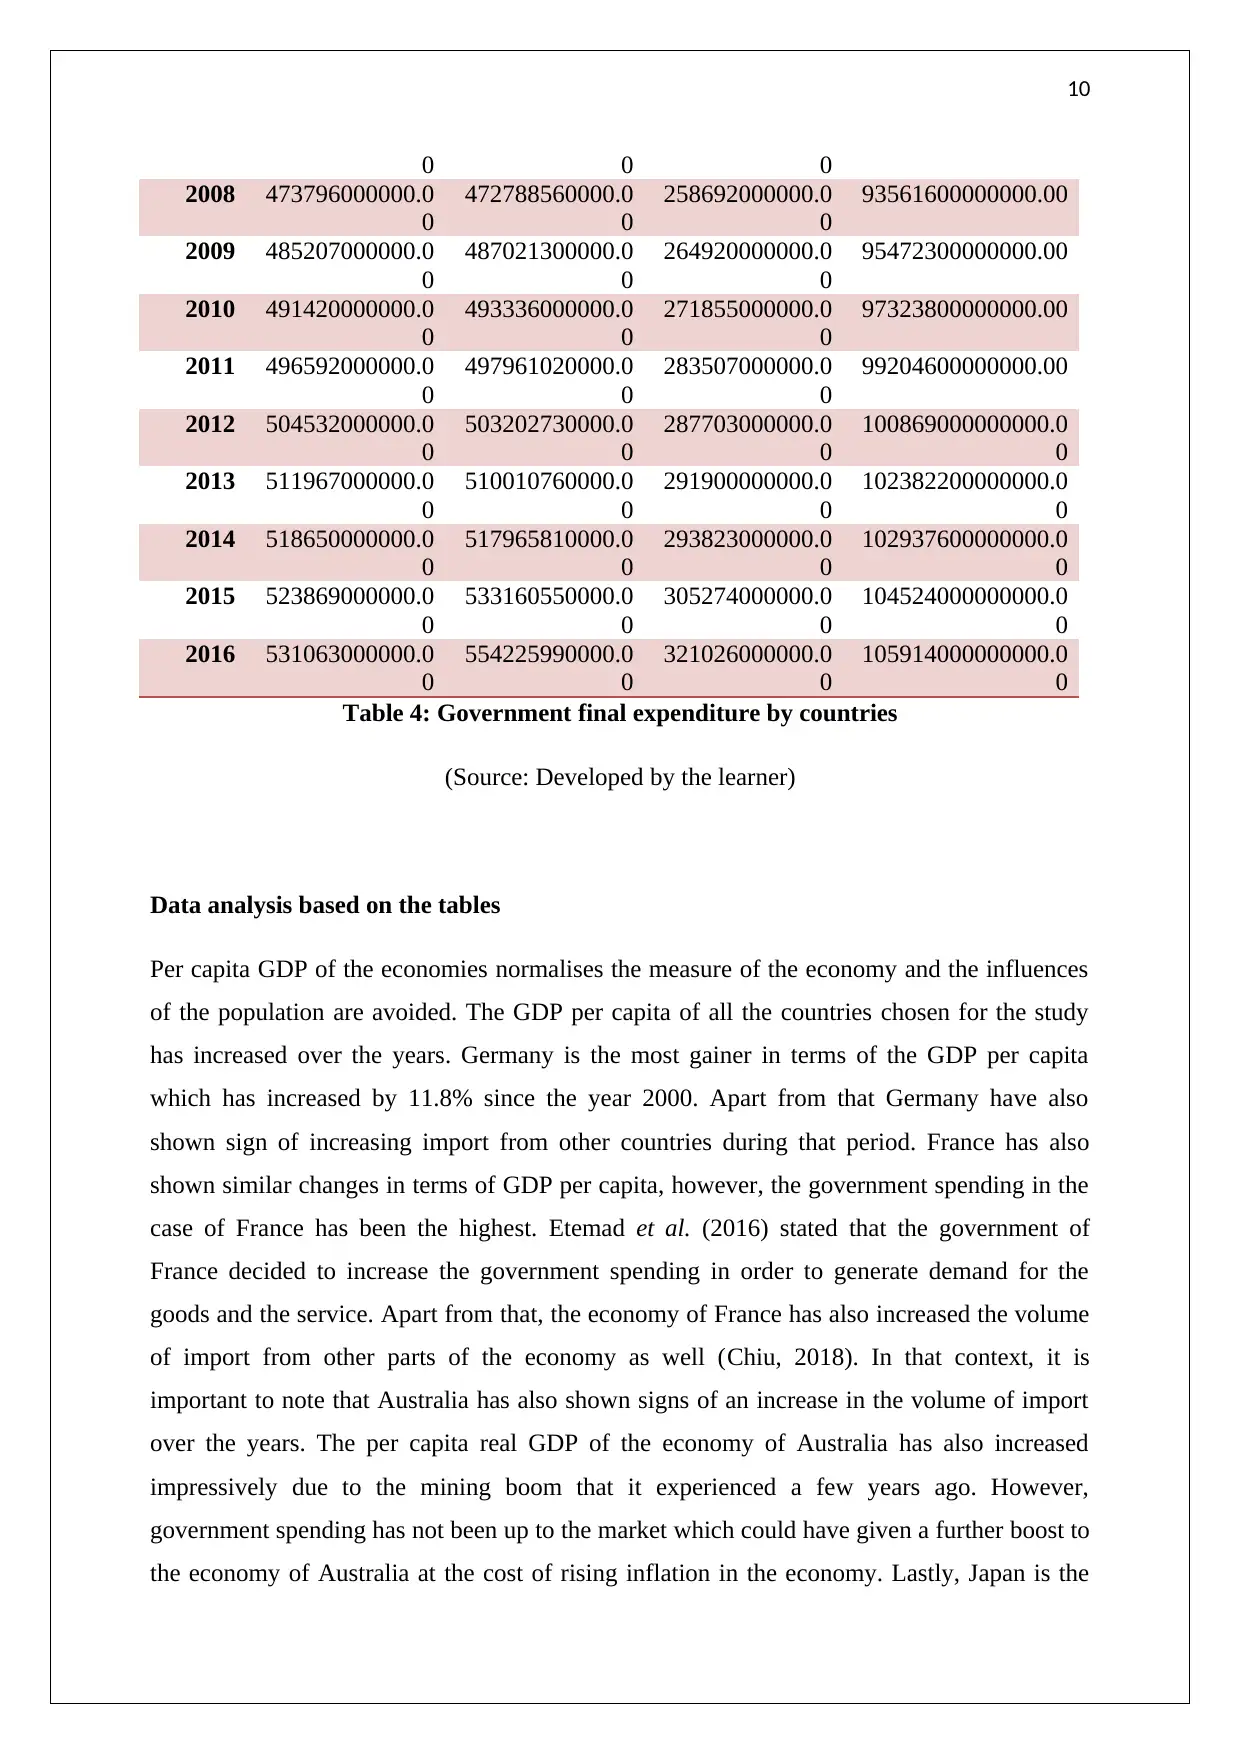
Table 4: Government final expenditure by countries
(Source: Developed by the learner)
Data analysis based on the tables
Per capita GDP of the economies normalises the measure of the economy and the influences
of the population are avoided. The GDP per capita of all the countries chosen for the study
has increased over the years. Germany is the most gainer in terms of the GDP per capita
which has increased by 11.8% since the year 2000. Apart from that Germany have also
shown sign of increasing import from other countries during that period. France has also
shown similar changes in terms of GDP per capita, however, the government spending in the
case of France has been the highest. Etemad et al. (2016) stated that the government of
France decided to increase the government spending in order to generate demand for the
goods and the service. Apart from that, the economy of France has also increased the volume
of import from other parts of the economy as well (Chiu, 2018). In that context, it is
important to note that Australia has also shown signs of an increase in the volume of import
over the years. The per capita real GDP of the economy of Australia has also increased
impressively due to the mining boom that it experienced a few years ago. However,
government spending has not been up to the market which could have given a further boost to
the economy of Australia at the cost of rising inflation in the economy. Lastly, Japan is the
0 0 0
2008 473796000000.0
0
472788560000.0
0
258692000000.0
0
93561600000000.00
2009 485207000000.0
0
487021300000.0
0
264920000000.0
0
95472300000000.00
2010 491420000000.0
0
493336000000.0
0
271855000000.0
0
97323800000000.00
2011 496592000000.0
0
497961020000.0
0
283507000000.0
0
99204600000000.00
2012 504532000000.0
0
503202730000.0
0
287703000000.0
0
100869000000000.0
0
2013 511967000000.0
0
510010760000.0
0
291900000000.0
0
102382200000000.0
0
2014 518650000000.0
0
517965810000.0
0
293823000000.0
0
102937600000000.0
0
2015 523869000000.0
0
533160550000.0
0
305274000000.0
0
104524000000000.0
0
2016 531063000000.0
0
554225990000.0
0
321026000000.0
0
105914000000000.0
0
Table 4: Government final expenditure by countries
(Source: Developed by the learner)
Data analysis based on the tables
Per capita GDP of the economies normalises the measure of the economy and the influences
of the population are avoided. The GDP per capita of all the countries chosen for the study
has increased over the years. Germany is the most gainer in terms of the GDP per capita
which has increased by 11.8% since the year 2000. Apart from that Germany have also
shown sign of increasing import from other countries during that period. France has also
shown similar changes in terms of GDP per capita, however, the government spending in the
case of France has been the highest. Etemad et al. (2016) stated that the government of
France decided to increase the government spending in order to generate demand for the
goods and the service. Apart from that, the economy of France has also increased the volume
of import from other parts of the economy as well (Chiu, 2018). In that context, it is
important to note that Australia has also shown signs of an increase in the volume of import
over the years. The per capita real GDP of the economy of Australia has also increased
impressively due to the mining boom that it experienced a few years ago. However,
government spending has not been up to the market which could have given a further boost to
the economy of Australia at the cost of rising inflation in the economy. Lastly, Japan is the
Paraphrase This Document
Need a fresh take? Get an instant paraphrase of this document with our AI Paraphraser
11
only country chosen for the study which runs heavily on government debt. Over the years the
debt of the government has further increased (Reader, 2017). It is also reflected in the
inflation rate of the country as well. The absolute value of the government expenditure has
been high compared to the countries. Given the high government spending, it has not
increased impressively since the year 2000.
Question 3
Unfilled job vacancy and unemployment rate in Australia
1980-01-01
1981-10-01
1983-07-01
1985-04-01
1987-01-01
1988-10-01
1990-07-01
1992-04-01
1994-01-01
1995-10-01
1997-07-01
1999-04-01
2001-01-01
2002-10-01
2004-07-01
2006-04-01
2008-01-01
2009-10-01
2011-07-01
2013-04-01
2015-01-01
2016-10-01
0.0
50000.0
100000.0
150000.0
200000.0
250000.0
0.0
2.0
4.0
6.0
8.0
10.0
12.0
14.0
Unfilled job and unemployment australia
Job vacancies Unemployment
years and quarters
Unfilled Job vacancies
Unemployment rate
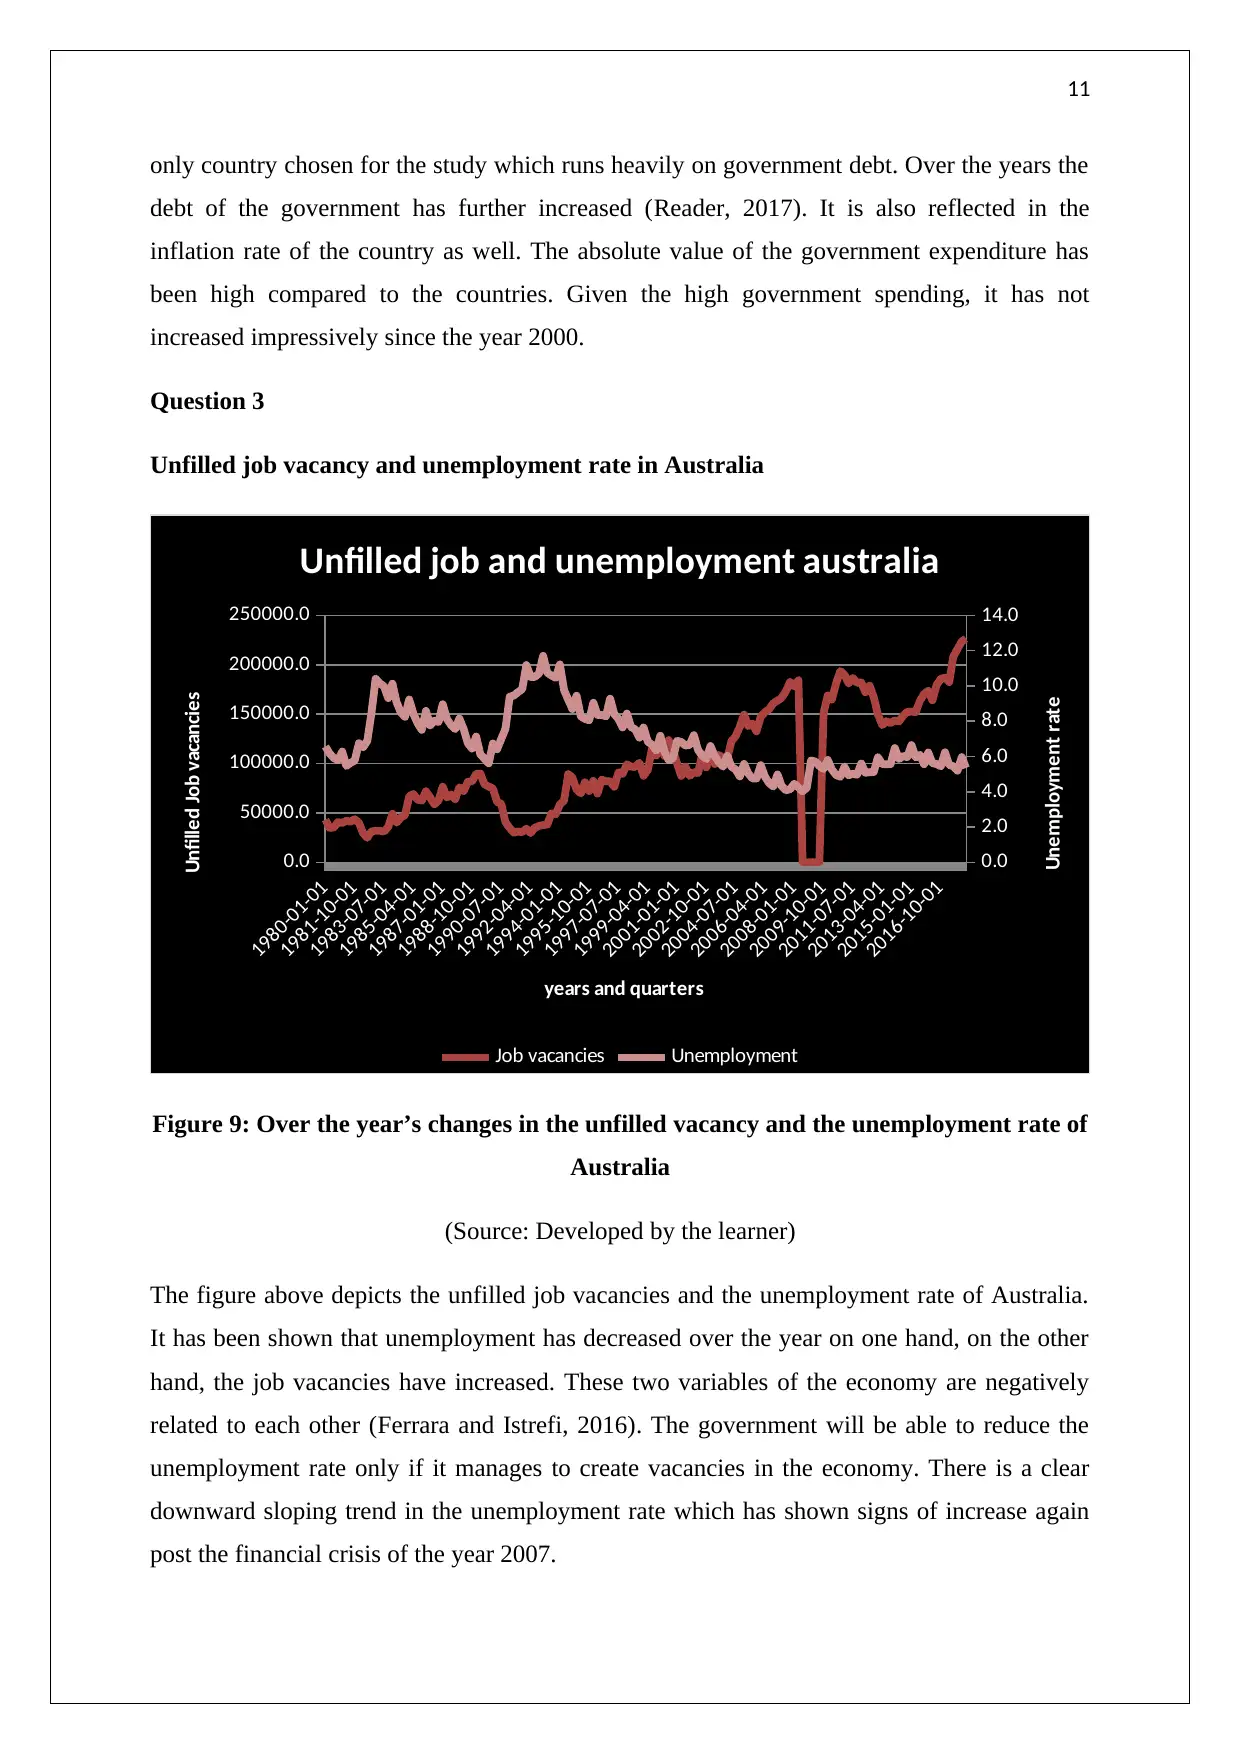
Figure 9: Over the year’s changes in the unfilled vacancy and the unemployment rate of
Australia
(Source: Developed by the learner)
The figure above depicts the unfilled job vacancies and the unemployment rate of Australia.
It has been shown that unemployment has decreased over the year on one hand, on the other
hand, the job vacancies have increased. These two variables of the economy are negatively
related to each other (Ferrara and Istrefi, 2016). The government will be able to reduce the
unemployment rate only if it manages to create vacancies in the economy. There is a clear
downward sloping trend in the unemployment rate which has shown signs of increase again
post the financial crisis of the year 2007.
only country chosen for the study which runs heavily on government debt. Over the years the
debt of the government has further increased (Reader, 2017). It is also reflected in the
inflation rate of the country as well. The absolute value of the government expenditure has
been high compared to the countries. Given the high government spending, it has not
increased impressively since the year 2000.
Question 3
Unfilled job vacancy and unemployment rate in Australia
1980-01-01
1981-10-01
1983-07-01
1985-04-01
1987-01-01
1988-10-01
1990-07-01
1992-04-01
1994-01-01
1995-10-01
1997-07-01
1999-04-01
2001-01-01
2002-10-01
2004-07-01
2006-04-01
2008-01-01
2009-10-01
2011-07-01
2013-04-01
2015-01-01
2016-10-01
0.0
50000.0
100000.0
150000.0
200000.0
250000.0
0.0
2.0
4.0
6.0
8.0
10.0
12.0
14.0
Unfilled job and unemployment australia
Job vacancies Unemployment
years and quarters
Unfilled Job vacancies
Unemployment rate
Figure 9: Over the year’s changes in the unfilled vacancy and the unemployment rate of
Australia
(Source: Developed by the learner)
The figure above depicts the unfilled job vacancies and the unemployment rate of Australia.
It has been shown that unemployment has decreased over the year on one hand, on the other
hand, the job vacancies have increased. These two variables of the economy are negatively
related to each other (Ferrara and Istrefi, 2016). The government will be able to reduce the
unemployment rate only if it manages to create vacancies in the economy. There is a clear
downward sloping trend in the unemployment rate which has shown signs of increase again
post the financial crisis of the year 2007.
12
The Australian government did not make the most from the minim boom that is experienced
around the same time. Although, it saved the government from feeling the pressure of the
global economic crisis it did not make huge employability for the economy. The graph above
also depicts the slight increase in employment after the financial crisis of the year 2007 was
over (Georgiadis and Gräb, 2016). However, at the same time, the vacancies in the economy
of Australia kept on increasing as the government decided to open up a various sector of the
economy for foreign investment.
Part B- Short answer question
Question 4
Government expenditure is one of the biggest influencing factors of the aggregate demand
and the supply of the economy. Aggregate demand and the supply both include the individual
demand and the supply of all the markets of the economy. First, in the long run, the aggregate
supply curve is upward sloping but not horizontal (Cheung and Sit, 2017). That means, in the
long run, the economy has the flexibility to increase is supply capabilities. When the
government spending increases in the long run, it directly increases the aggregate demand.
The government expenditure is an important component of the aggregate demand and hence
the increase shifts the aggregate demand curve to the right (Hood, Young, and Hamill, 2017).
Given the flexible, supply, the prices of goods and the services would reduce and the
economy would produce a lot more output.
⊘ This is a preview!⊘
Do you want full access?
Subscribe today to unlock all pages.
Trusted by 1+ million students worldwide
1 out of 17
Your All-in-One AI-Powered Toolkit for Academic Success.
+13062052269
info@desklib.com
Available 24*7 on WhatsApp / Email
![[object Object]](/_next/static/media/star-bottom.7253800d.svg)
Unlock your academic potential
Copyright © 2020–2026 A2Z Services. All Rights Reserved. Developed and managed by ZUCOL.