University Economics Report: The Global Economy and Trade Dynamics
VerifiedAdded on 2021/05/31
|25
|3692
|103
Report
AI Summary
This economics report provides a comprehensive analysis of the global economy, examining key economic indicators such as GDP, inflation, unemployment, and government expenditure across several countries, including Australia, South Korea, the United Kingdom, China, and Japan. The report delves into the impact of fiscal policy, specifically tax cuts, on aggregate expenditure and equilibrium GDP using the aggregate expenditure model. It also explores the relationship between exchange rates and trade balances, analyzing the fluctuations of the Australian dollar against various currencies. The analysis includes data from 1990 to 2016, utilizing tables and figures to illustrate trends and relationships, offering insights into the economic performance and interconnectedness of these nations. The report also uses economic models to explain the concepts.
Running Head: THE GLOBAL ECONOMY
The Global Economy
Name of the Student
Name of the University
Course ID
The Global Economy
Name of the Student
Name of the University
Course ID
Paraphrase This Document
Need a fresh take? Get an instant paraphrase of this document with our AI Paraphraser
1THE GLOBAL ECONOMY
Table of Contents
Part A...............................................................................................................................................2
Answer 1......................................................................................................................................2
Answer 2......................................................................................................................................3
Answer 3....................................................................................................................................12
Part B.............................................................................................................................................13
Answer 4....................................................................................................................................14
Answer 5....................................................................................................................................16
Part C.............................................................................................................................................19
Introduction................................................................................................................................19
Public Policy Planner: Responsibilities and Skills....................................................................19
My strengths as an aspirant........................................................................................................20
Video Interpretation...................................................................................................................20
Action Plan................................................................................................................................21
Reference list.................................................................................................................................23
2THE GLOBAL ECONOMY
Part A
Answer 1
Dec-1990
Dec-1991
Dec-1992
Dec-1993
Dec-1994
Dec-1995
Dec-1996
Dec-1997
Dec-1998
Dec-1999
Dec-2000
Dec-2001
Dec-2002
Dec-2003
Dec-2004
Dec-2005
Dec-2006
Dec-2007
Dec-2008
Dec-2009
Dec-2010
Dec-2011
Dec-2012
Dec-2013
Dec-2014
Dec-2015
Dec-2016
0
100000
200000
300000
400000
500000
Nominal and Real GDP
Nominal GDP Real GDP
Year
GDP
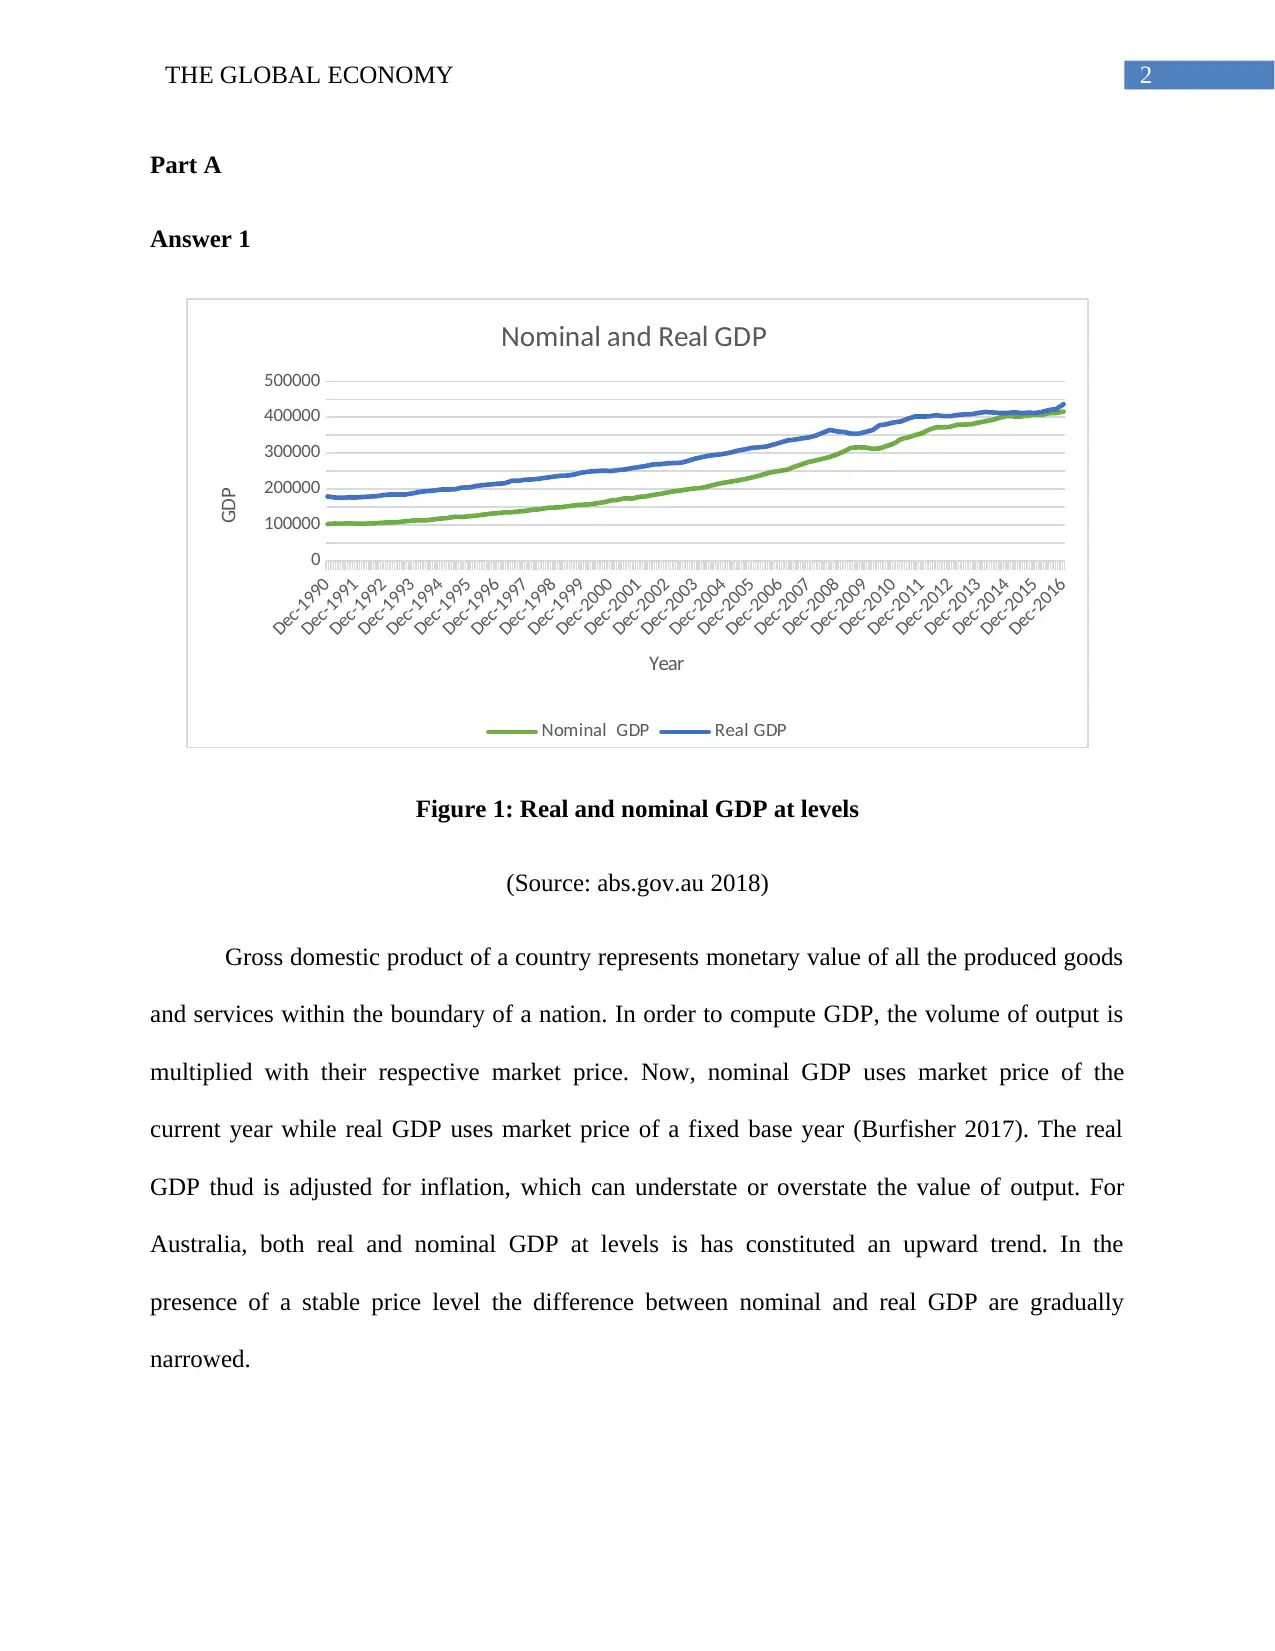
Figure 1: Real and nominal GDP at levels
(Source: abs.gov.au 2018)
Gross domestic product of a country represents monetary value of all the produced goods
and services within the boundary of a nation. In order to compute GDP, the volume of output is
multiplied with their respective market price. Now, nominal GDP uses market price of the
current year while real GDP uses market price of a fixed base year (Burfisher 2017). The real
GDP thud is adjusted for inflation, which can understate or overstate the value of output. For
Australia, both real and nominal GDP at levels is has constituted an upward trend. In the
presence of a stable price level the difference between nominal and real GDP are gradually
narrowed.
Part A
Answer 1
Dec-1990
Dec-1991
Dec-1992
Dec-1993
Dec-1994
Dec-1995
Dec-1996
Dec-1997
Dec-1998
Dec-1999
Dec-2000
Dec-2001
Dec-2002
Dec-2003
Dec-2004
Dec-2005
Dec-2006
Dec-2007
Dec-2008
Dec-2009
Dec-2010
Dec-2011
Dec-2012
Dec-2013
Dec-2014
Dec-2015
Dec-2016
0
100000
200000
300000
400000
500000
Nominal and Real GDP
Nominal GDP Real GDP
Year
GDP
Figure 1: Real and nominal GDP at levels
(Source: abs.gov.au 2018)
Gross domestic product of a country represents monetary value of all the produced goods
and services within the boundary of a nation. In order to compute GDP, the volume of output is
multiplied with their respective market price. Now, nominal GDP uses market price of the
current year while real GDP uses market price of a fixed base year (Burfisher 2017). The real
GDP thud is adjusted for inflation, which can understate or overstate the value of output. For
Australia, both real and nominal GDP at levels is has constituted an upward trend. In the
presence of a stable price level the difference between nominal and real GDP are gradually
narrowed.
⊘ This is a preview!⊘
Do you want full access?
Subscribe today to unlock all pages.
Trusted by 1+ million students worldwide
3THE GLOBAL ECONOMY
Dec-1990
Dec-1991
Dec-1992
Dec-1993
Dec-1994
Dec-1995
Dec-1996
Dec-1997
Dec-1998
Dec-1999
Dec-2000
Dec-2001
Dec-2002
Dec-2003
Dec-2004
Dec-2005
Dec-2006
Dec-2007
Dec-2008
Dec-2009
Dec-2010
Dec-2011
Dec-2012
Dec-2013
Dec-2014
Dec-2015
Dec-2016
-1.5
-0.5
0.5
1.5
2.5
3.5
GDP Growth
Real GDP Nominal GDP
Quarters
Growth (%)
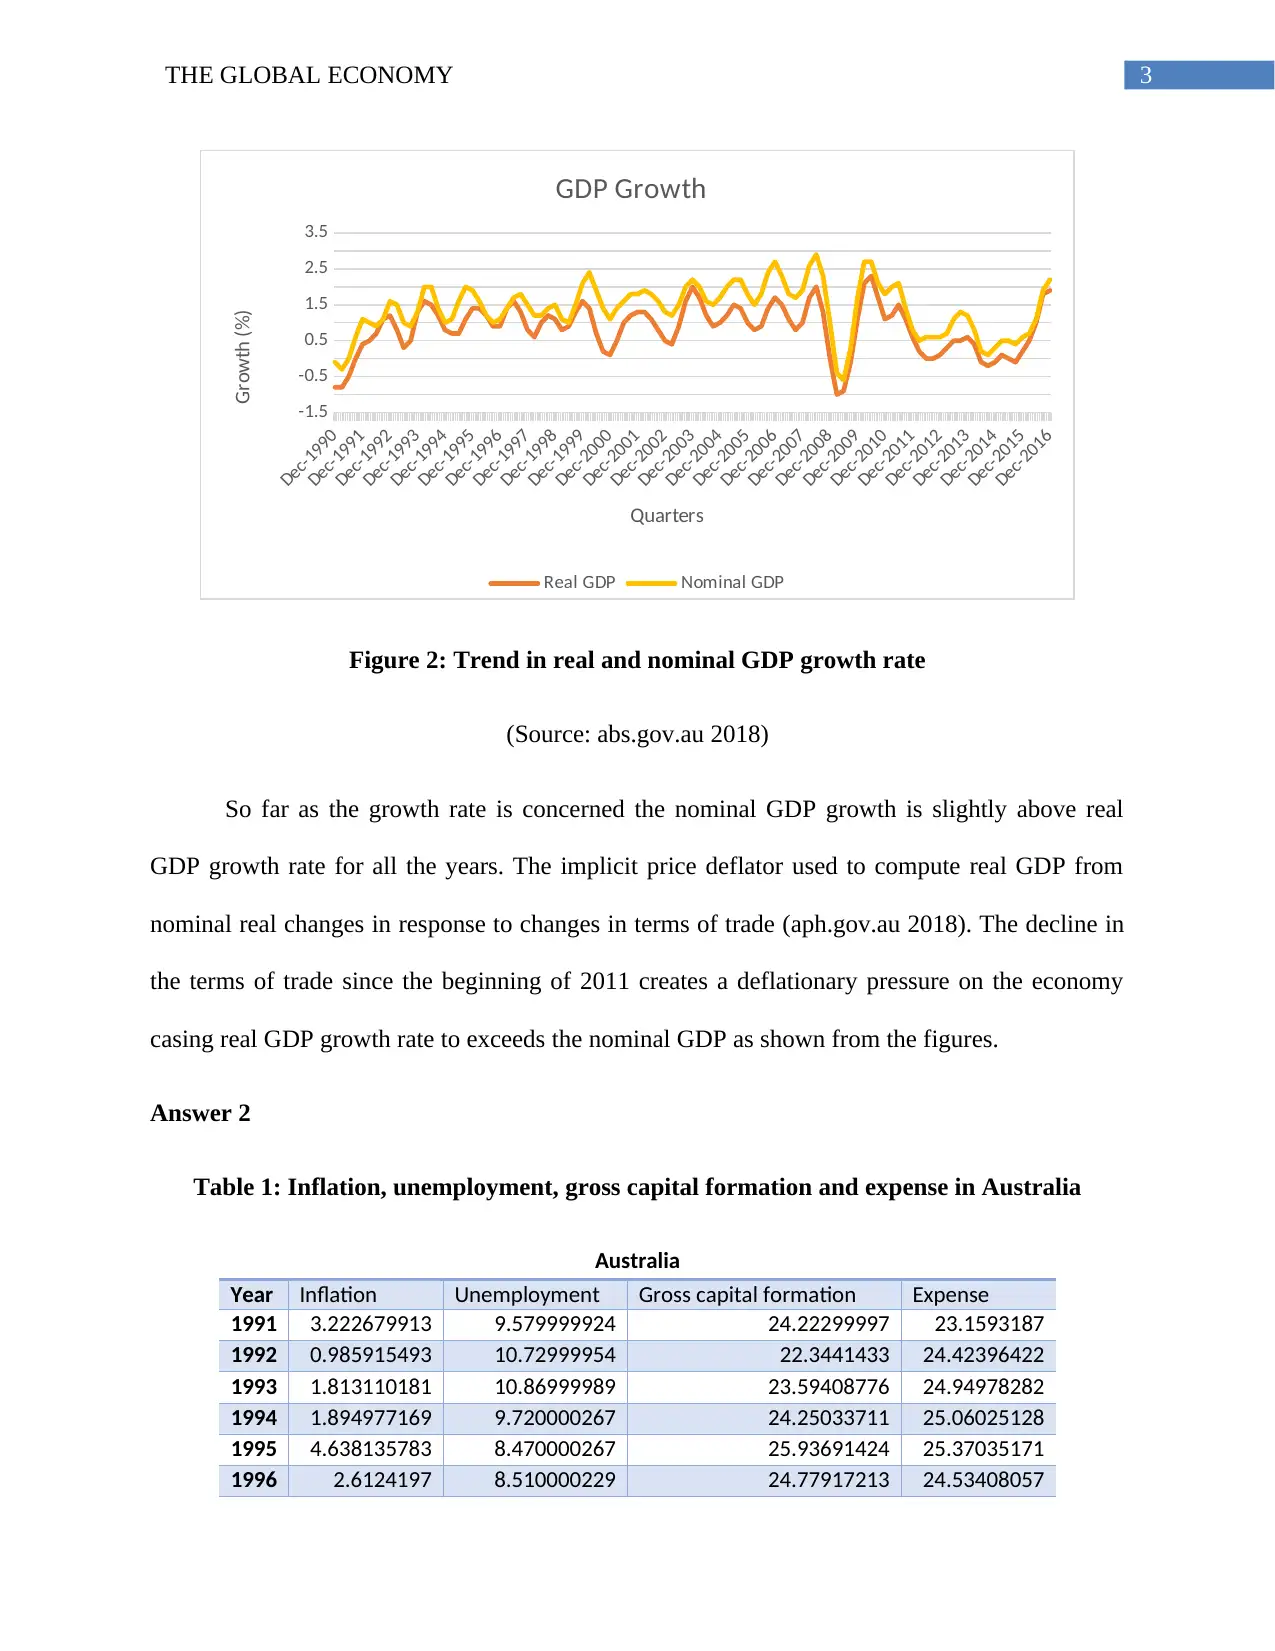
Figure 2: Trend in real and nominal GDP growth rate
(Source: abs.gov.au 2018)
So far as the growth rate is concerned the nominal GDP growth is slightly above real
GDP growth rate for all the years. The implicit price deflator used to compute real GDP from
nominal real changes in response to changes in terms of trade (aph.gov.au 2018). The decline in
the terms of trade since the beginning of 2011 creates a deflationary pressure on the economy
casing real GDP growth rate to exceeds the nominal GDP as shown from the figures.
Answer 2
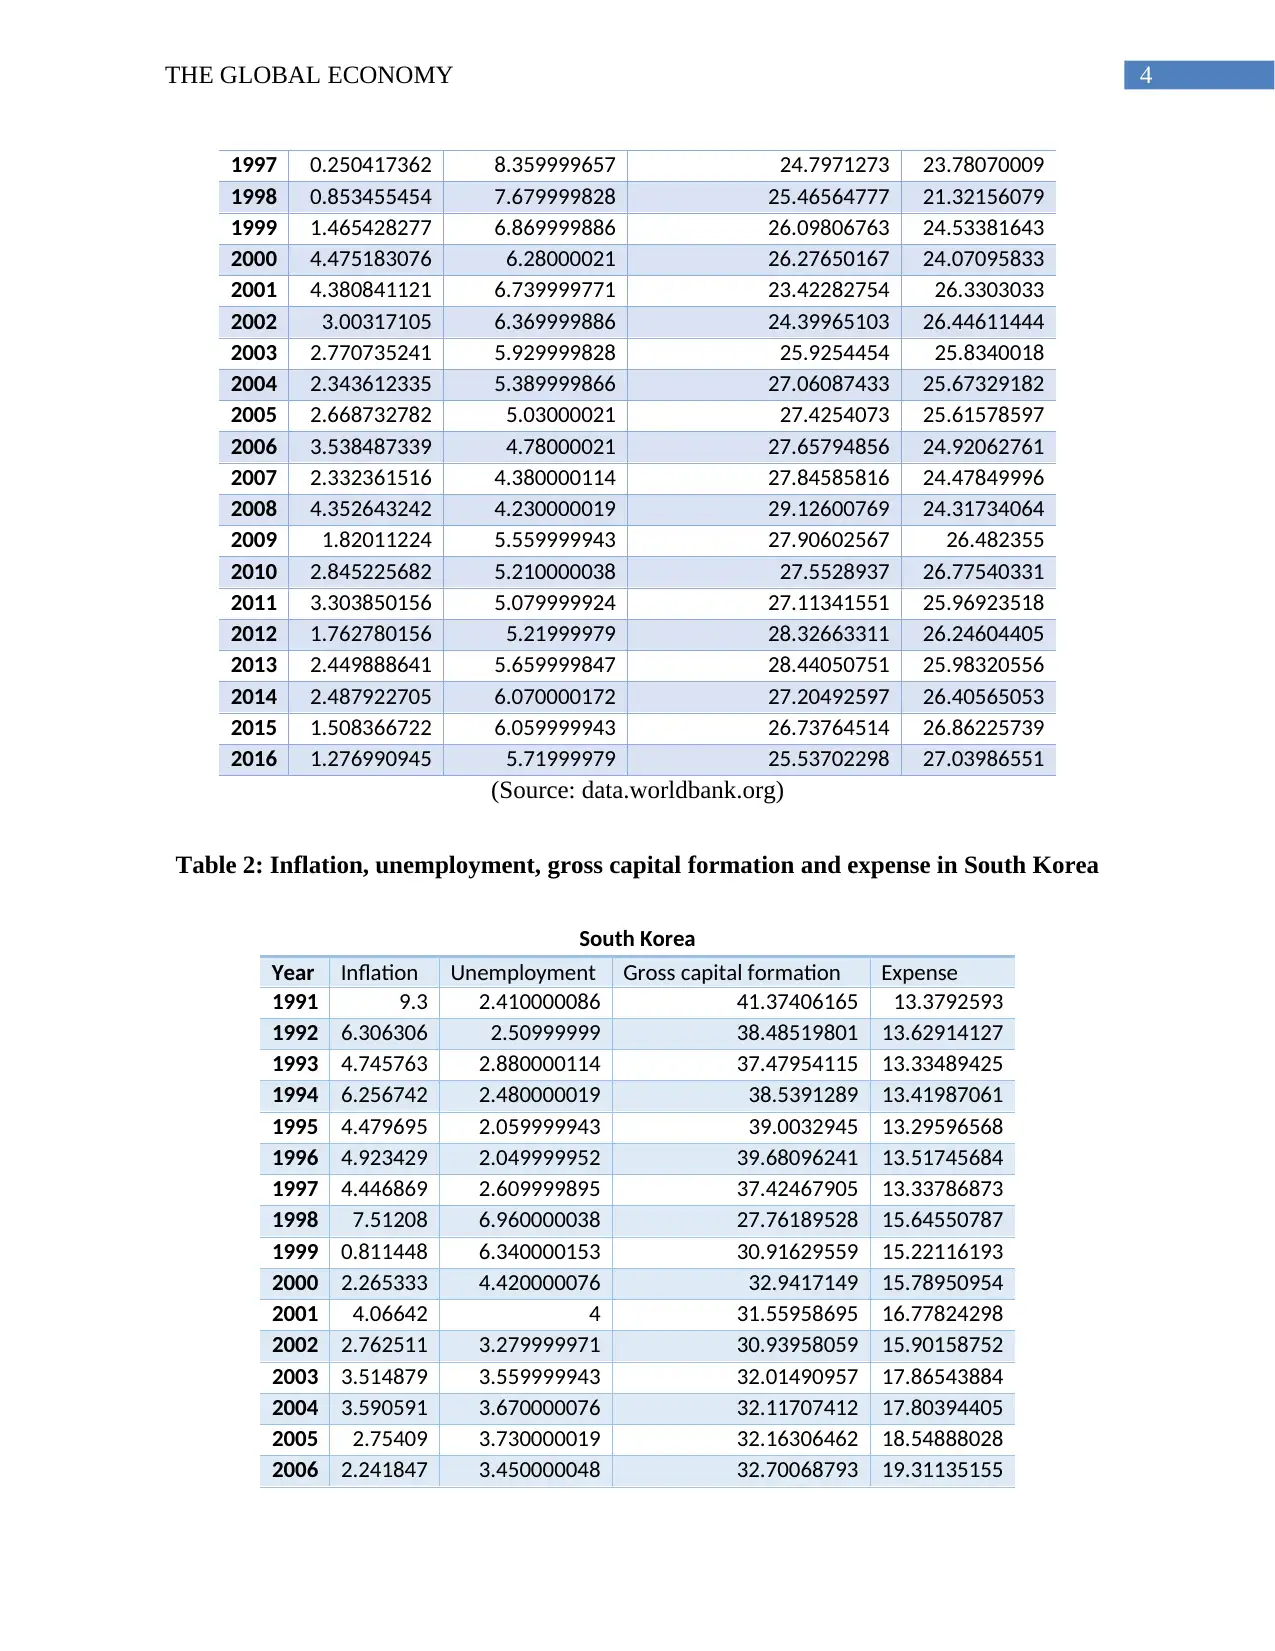
Table 1: Inflation, unemployment, gross capital formation and expense in Australia
Australia
Year Inflation Unemployment Gross capital formation Expense
1991 3.222679913 9.579999924 24.22299997 23.1593187
1992 0.985915493 10.72999954 22.3441433 24.42396422
1993 1.813110181 10.86999989 23.59408776 24.94978282
1994 1.894977169 9.720000267 24.25033711 25.06025128
1995 4.638135783 8.470000267 25.93691424 25.37035171
1996 2.6124197 8.510000229 24.77917213 24.53408057
Dec-1990
Dec-1991
Dec-1992
Dec-1993
Dec-1994
Dec-1995
Dec-1996
Dec-1997
Dec-1998
Dec-1999
Dec-2000
Dec-2001
Dec-2002
Dec-2003
Dec-2004
Dec-2005
Dec-2006
Dec-2007
Dec-2008
Dec-2009
Dec-2010
Dec-2011
Dec-2012
Dec-2013
Dec-2014
Dec-2015
Dec-2016
-1.5
-0.5
0.5
1.5
2.5
3.5
GDP Growth
Real GDP Nominal GDP
Quarters
Growth (%)
Figure 2: Trend in real and nominal GDP growth rate
(Source: abs.gov.au 2018)
So far as the growth rate is concerned the nominal GDP growth is slightly above real
GDP growth rate for all the years. The implicit price deflator used to compute real GDP from
nominal real changes in response to changes in terms of trade (aph.gov.au 2018). The decline in
the terms of trade since the beginning of 2011 creates a deflationary pressure on the economy
casing real GDP growth rate to exceeds the nominal GDP as shown from the figures.
Answer 2
Table 1: Inflation, unemployment, gross capital formation and expense in Australia
Australia
Year Inflation Unemployment Gross capital formation Expense
1991 3.222679913 9.579999924 24.22299997 23.1593187
1992 0.985915493 10.72999954 22.3441433 24.42396422
1993 1.813110181 10.86999989 23.59408776 24.94978282
1994 1.894977169 9.720000267 24.25033711 25.06025128
1995 4.638135783 8.470000267 25.93691424 25.37035171
1996 2.6124197 8.510000229 24.77917213 24.53408057
Paraphrase This Document
Need a fresh take? Get an instant paraphrase of this document with our AI Paraphraser
4THE GLOBAL ECONOMY
1997 0.250417362 8.359999657 24.7971273 23.78070009
1998 0.853455454 7.679999828 25.46564777 21.32156079
1999 1.465428277 6.869999886 26.09806763 24.53381643
2000 4.475183076 6.28000021 26.27650167 24.07095833
2001 4.380841121 6.739999771 23.42282754 26.3303033
2002 3.00317105 6.369999886 24.39965103 26.44611444
2003 2.770735241 5.929999828 25.9254454 25.8340018
2004 2.343612335 5.389999866 27.06087433 25.67329182
2005 2.668732782 5.03000021 27.4254073 25.61578597
2006 3.538487339 4.78000021 27.65794856 24.92062761
2007 2.332361516 4.380000114 27.84585816 24.47849996
2008 4.352643242 4.230000019 29.12600769 24.31734064
2009 1.82011224 5.559999943 27.90602567 26.482355
2010 2.845225682 5.210000038 27.5528937 26.77540331
2011 3.303850156 5.079999924 27.11341551 25.96923518
2012 1.762780156 5.21999979 28.32663311 26.24604405
2013 2.449888641 5.659999847 28.44050751 25.98320556
2014 2.487922705 6.070000172 27.20492597 26.40565053
2015 1.508366722 6.059999943 26.73764514 26.86225739
2016 1.276990945 5.71999979 25.53702298 27.03986551
(Source: data.worldbank.org)
Table 2: Inflation, unemployment, gross capital formation and expense in South Korea
South Korea
Year Inflation Unemployment Gross capital formation Expense
1991 9.3 2.410000086 41.37406165 13.3792593
1992 6.306306 2.50999999 38.48519801 13.62914127
1993 4.745763 2.880000114 37.47954115 13.33489425
1994 6.256742 2.480000019 38.5391289 13.41987061
1995 4.479695 2.059999943 39.0032945 13.29596568
1996 4.923429 2.049999952 39.68096241 13.51745684
1997 4.446869 2.609999895 37.42467905 13.33786873
1998 7.51208 6.960000038 27.76189528 15.64550787
1999 0.811448 6.340000153 30.91629559 15.22116193
2000 2.265333 4.420000076 32.9417149 15.78950954
2001 4.06642 4 31.55958695 16.77824298
2002 2.762511 3.279999971 30.93958059 15.90158752
2003 3.514879 3.559999943 32.01490957 17.86543884
2004 3.590591 3.670000076 32.11707412 17.80394405
2005 2.75409 3.730000019 32.16306462 18.54888028
2006 2.241847 3.450000048 32.70068793 19.31135155
5THE GLOBAL ECONOMY
2007 2.534847 3.230000019 32.57953116 18.82266703
2008 4.673796 3.160000086 33.01850389 19.14187425
2009 2.756686 3.640000105 28.4656577 20.20127708
2010 2.939181 3.720000029 32.02287506 18.42542179
2011 4.025846 3.410000086 32.95883261 18.90133685
2012 2.187221 3.220000029 31.00122857 25.75391299
2013 1.301377 3.119999886 29.10221685 25.23258321
2014 1.2748 3.529999971 29.27691005 24.84029804
2015 0.706963 3.630000114 28.91811192 24.89953205
2016 0.97 3.710000038 29.20956543 24.98822488
(Source: data.worldbank.org)
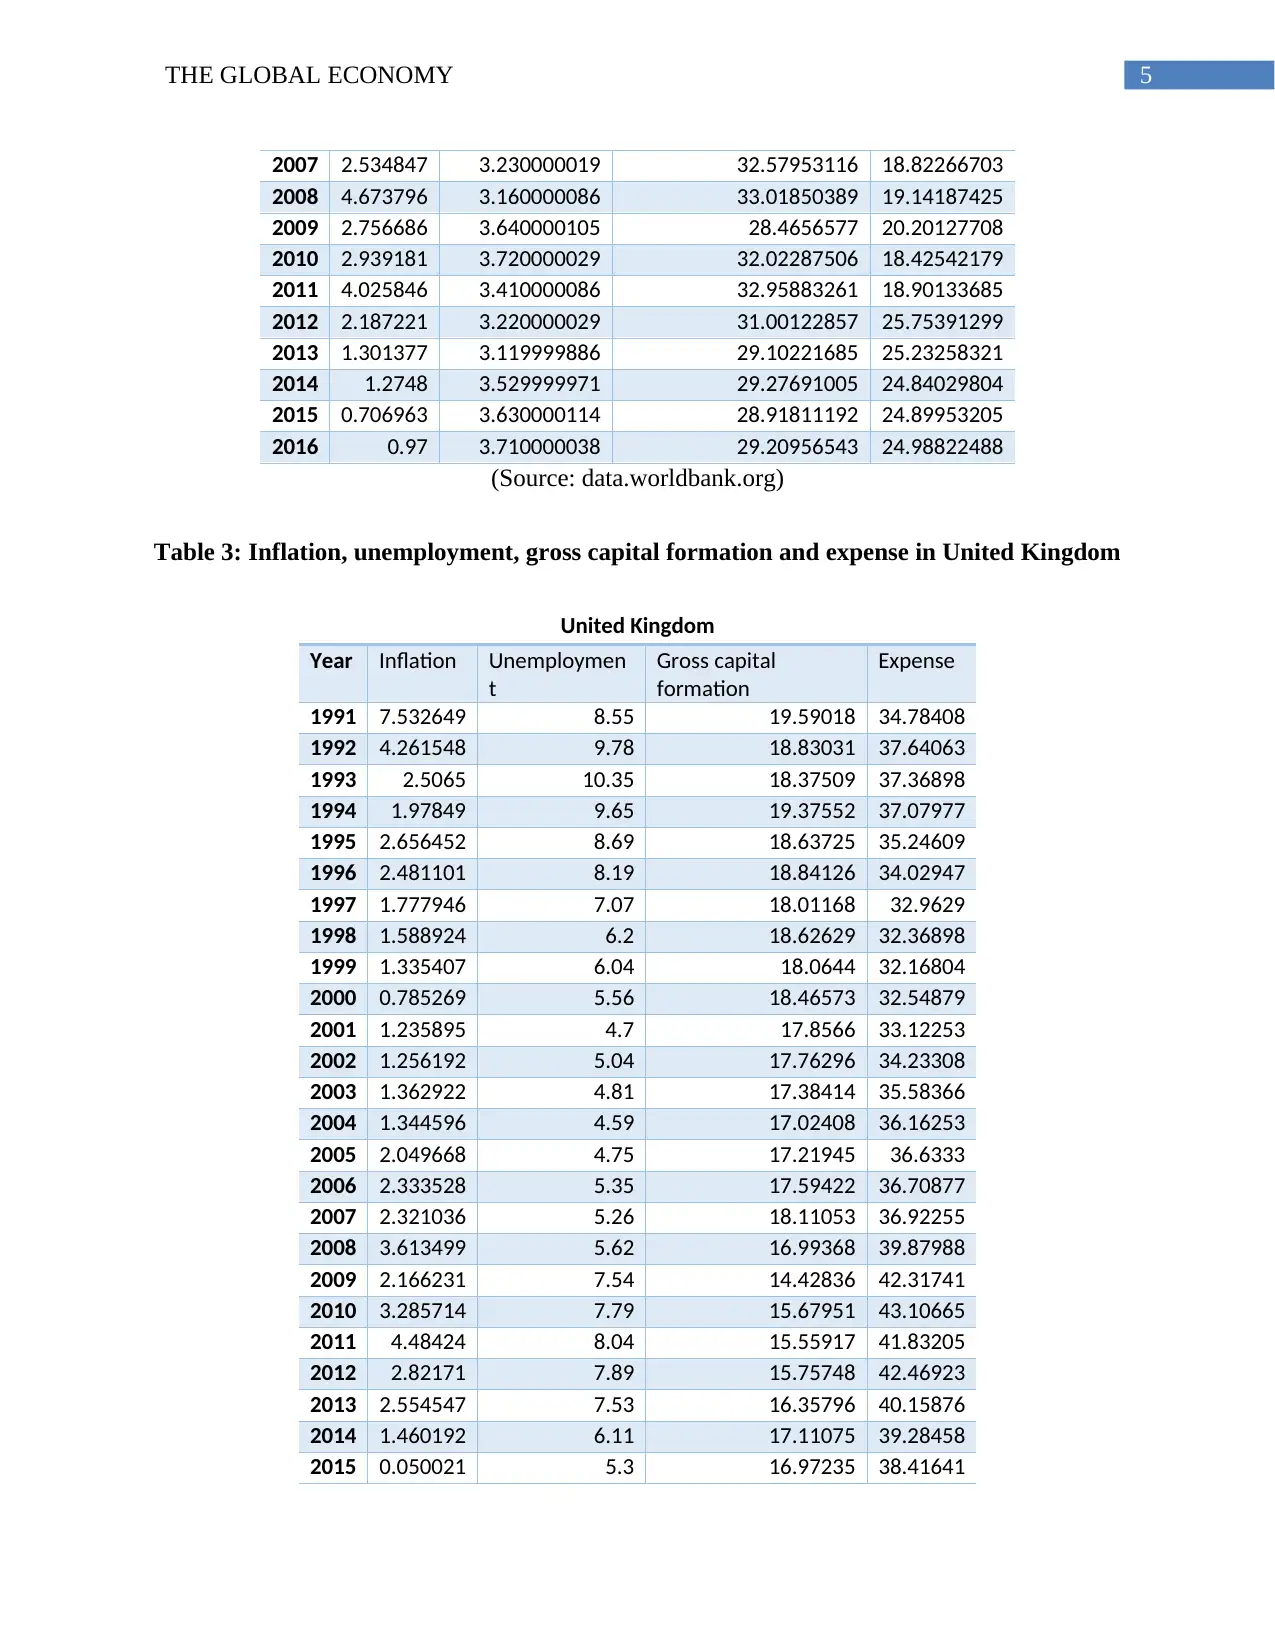
Table 3: Inflation, unemployment, gross capital formation and expense in United Kingdom
United Kingdom
Year Inflation Unemploymen
t
Gross capital
formation
Expense
1991 7.532649 8.55 19.59018 34.78408
1992 4.261548 9.78 18.83031 37.64063
1993 2.5065 10.35 18.37509 37.36898
1994 1.97849 9.65 19.37552 37.07977
1995 2.656452 8.69 18.63725 35.24609
1996 2.481101 8.19 18.84126 34.02947
1997 1.777946 7.07 18.01168 32.9629
1998 1.588924 6.2 18.62629 32.36898
1999 1.335407 6.04 18.0644 32.16804
2000 0.785269 5.56 18.46573 32.54879
2001 1.235895 4.7 17.8566 33.12253
2002 1.256192 5.04 17.76296 34.23308
2003 1.362922 4.81 17.38414 35.58366
2004 1.344596 4.59 17.02408 36.16253
2005 2.049668 4.75 17.21945 36.6333
2006 2.333528 5.35 17.59422 36.70877
2007 2.321036 5.26 18.11053 36.92255
2008 3.613499 5.62 16.99368 39.87988
2009 2.166231 7.54 14.42836 42.31741
2010 3.285714 7.79 15.67951 43.10665
2011 4.48424 8.04 15.55917 41.83205
2012 2.82171 7.89 15.75748 42.46923
2013 2.554547 7.53 16.35796 40.15876
2014 1.460192 6.11 17.11075 39.28458
2015 0.050021 5.3 16.97235 38.41641
2007 2.534847 3.230000019 32.57953116 18.82266703
2008 4.673796 3.160000086 33.01850389 19.14187425
2009 2.756686 3.640000105 28.4656577 20.20127708
2010 2.939181 3.720000029 32.02287506 18.42542179
2011 4.025846 3.410000086 32.95883261 18.90133685
2012 2.187221 3.220000029 31.00122857 25.75391299
2013 1.301377 3.119999886 29.10221685 25.23258321
2014 1.2748 3.529999971 29.27691005 24.84029804
2015 0.706963 3.630000114 28.91811192 24.89953205
2016 0.97 3.710000038 29.20956543 24.98822488
(Source: data.worldbank.org)
Table 3: Inflation, unemployment, gross capital formation and expense in United Kingdom
United Kingdom
Year Inflation Unemploymen
t
Gross capital
formation
Expense
1991 7.532649 8.55 19.59018 34.78408
1992 4.261548 9.78 18.83031 37.64063
1993 2.5065 10.35 18.37509 37.36898
1994 1.97849 9.65 19.37552 37.07977
1995 2.656452 8.69 18.63725 35.24609
1996 2.481101 8.19 18.84126 34.02947
1997 1.777946 7.07 18.01168 32.9629
1998 1.588924 6.2 18.62629 32.36898
1999 1.335407 6.04 18.0644 32.16804
2000 0.785269 5.56 18.46573 32.54879
2001 1.235895 4.7 17.8566 33.12253
2002 1.256192 5.04 17.76296 34.23308
2003 1.362922 4.81 17.38414 35.58366
2004 1.344596 4.59 17.02408 36.16253
2005 2.049668 4.75 17.21945 36.6333
2006 2.333528 5.35 17.59422 36.70877
2007 2.321036 5.26 18.11053 36.92255
2008 3.613499 5.62 16.99368 39.87988
2009 2.166231 7.54 14.42836 42.31741
2010 3.285714 7.79 15.67951 43.10665
2011 4.48424 8.04 15.55917 41.83205
2012 2.82171 7.89 15.75748 42.46923
2013 2.554547 7.53 16.35796 40.15876
2014 1.460192 6.11 17.11075 39.28458
2015 0.050021 5.3 16.97235 38.41641
⊘ This is a preview!⊘
Do you want full access?
Subscribe today to unlock all pages.
Trusted by 1+ million students worldwide

6THE GLOBAL ECONOMY
2016 0.641613 4.81 16.96858 37.29929
(Source: data.worldbank.org)
Table 4: Inflation, unemployment, gross capital formation and expense in China
China
Year Inflation Unemployment Gross capital formation Expens
e
1991 3.556686 4.889999866 35.8658256 16.55
1992 6.353981 4.389999866 39.83722181 14.65
1993 14.61008 4.329999924 44.24292895 13.41
1994 24.25734 4.340000153 40.94850525 12.36
1995 16.78945 4.550000191 39.68463866 11.09
1996 8.312847 4.590000153 38.37235534 11.01
1997 2.787113 4.599999905 36.33715573 11.54
1998 -0.84954 4.730000019 35.67868627 12.63
1999 -1.35851 4.699999809 34.96477981 14.9
2000 0.256518 4.53000021 34.42965254 16.14
2001 0.719808 4.53000021 36.42225471 17.31
2002 -0.76672 4.409999847 37.07754181 18.32
2003 1.164518 4.300000191 40.63154952 18.07
2004 3.888816 4.300000191 42.89449013 17.72
2005 1.813995 4.139999866 41.3912114 18.12
2006 1.466078 4 40.93327269 18.2
2007 4.767211 3.75999999 41.46315155 18.07
2008 5.843024 4.360000134 43.26637446 22.39
2009 -0.70063 4.288000107 46.44130408 25.52
2010 3.325775 4.199999809 47.61226023 24.96
2011 5.410918 4.340000153 47.68586754 27.01
2012 2.643052 4.46999979 47.23453111 28.06
2013 2.628086 4.539999962 47.38775199 28.54
2014 2.000345 4.592999935 47.00771662 28.97
2015 1.437025 4.605000019 45.40088041 31.32
2016 2 4.649000168 44.31060661 31.95
(Source: data.worldbank.org)
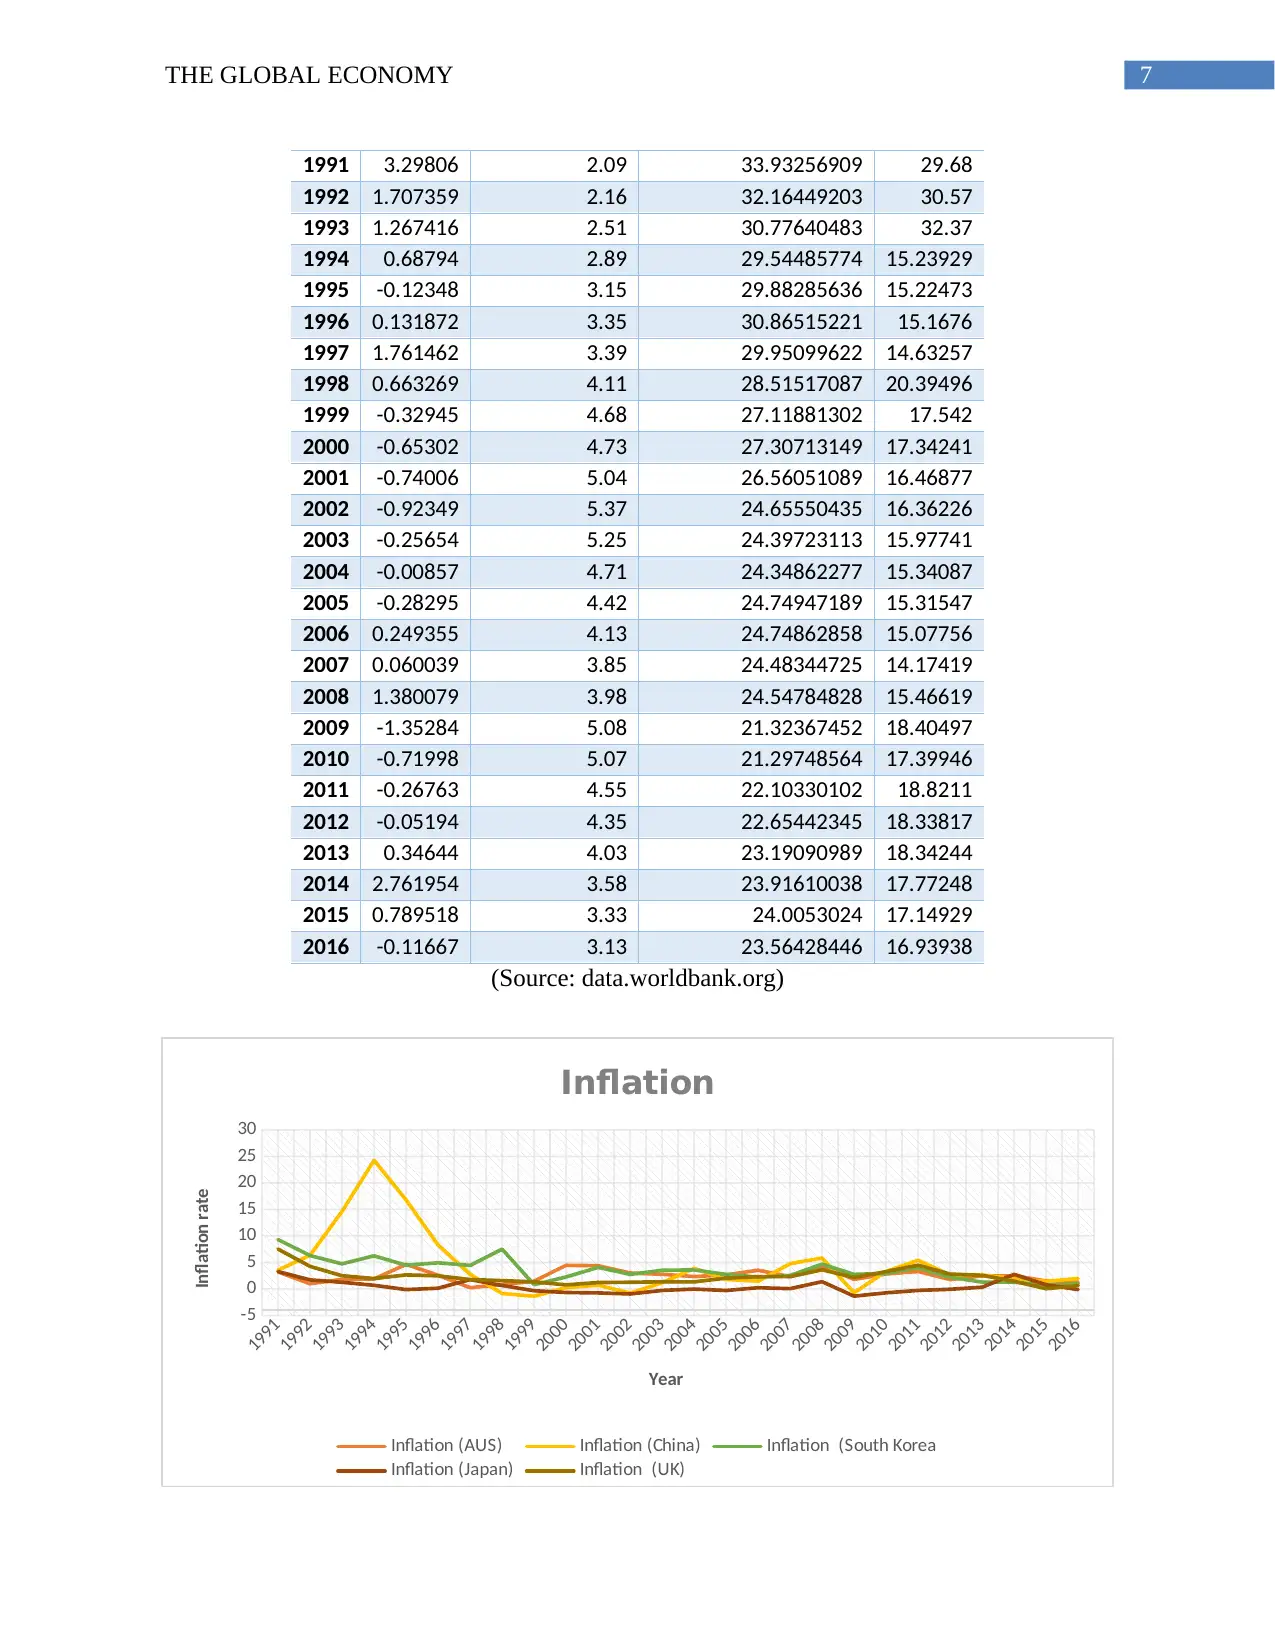
Table 5: Inflation, unemployment, gross capital formation and expense in Japan
Japan
Year Inflation Unemploymen
t
Gross capital
formation
Expense
2016 0.641613 4.81 16.96858 37.29929
(Source: data.worldbank.org)
Table 4: Inflation, unemployment, gross capital formation and expense in China
China
Year Inflation Unemployment Gross capital formation Expens
e
1991 3.556686 4.889999866 35.8658256 16.55
1992 6.353981 4.389999866 39.83722181 14.65
1993 14.61008 4.329999924 44.24292895 13.41
1994 24.25734 4.340000153 40.94850525 12.36
1995 16.78945 4.550000191 39.68463866 11.09
1996 8.312847 4.590000153 38.37235534 11.01
1997 2.787113 4.599999905 36.33715573 11.54
1998 -0.84954 4.730000019 35.67868627 12.63
1999 -1.35851 4.699999809 34.96477981 14.9
2000 0.256518 4.53000021 34.42965254 16.14
2001 0.719808 4.53000021 36.42225471 17.31
2002 -0.76672 4.409999847 37.07754181 18.32
2003 1.164518 4.300000191 40.63154952 18.07
2004 3.888816 4.300000191 42.89449013 17.72
2005 1.813995 4.139999866 41.3912114 18.12
2006 1.466078 4 40.93327269 18.2
2007 4.767211 3.75999999 41.46315155 18.07
2008 5.843024 4.360000134 43.26637446 22.39
2009 -0.70063 4.288000107 46.44130408 25.52
2010 3.325775 4.199999809 47.61226023 24.96
2011 5.410918 4.340000153 47.68586754 27.01
2012 2.643052 4.46999979 47.23453111 28.06
2013 2.628086 4.539999962 47.38775199 28.54
2014 2.000345 4.592999935 47.00771662 28.97
2015 1.437025 4.605000019 45.40088041 31.32
2016 2 4.649000168 44.31060661 31.95
(Source: data.worldbank.org)
Table 5: Inflation, unemployment, gross capital formation and expense in Japan
Japan
Year Inflation Unemploymen
t
Gross capital
formation
Expense
Paraphrase This Document
Need a fresh take? Get an instant paraphrase of this document with our AI Paraphraser
7THE GLOBAL ECONOMY
1991 3.29806 2.09 33.93256909 29.68
1992 1.707359 2.16 32.16449203 30.57
1993 1.267416 2.51 30.77640483 32.37
1994 0.68794 2.89 29.54485774 15.23929
1995 -0.12348 3.15 29.88285636 15.22473
1996 0.131872 3.35 30.86515221 15.1676
1997 1.761462 3.39 29.95099622 14.63257
1998 0.663269 4.11 28.51517087 20.39496
1999 -0.32945 4.68 27.11881302 17.542
2000 -0.65302 4.73 27.30713149 17.34241
2001 -0.74006 5.04 26.56051089 16.46877
2002 -0.92349 5.37 24.65550435 16.36226
2003 -0.25654 5.25 24.39723113 15.97741
2004 -0.00857 4.71 24.34862277 15.34087
2005 -0.28295 4.42 24.74947189 15.31547
2006 0.249355 4.13 24.74862858 15.07756
2007 0.060039 3.85 24.48344725 14.17419
2008 1.380079 3.98 24.54784828 15.46619
2009 -1.35284 5.08 21.32367452 18.40497
2010 -0.71998 5.07 21.29748564 17.39946
2011 -0.26763 4.55 22.10330102 18.8211
2012 -0.05194 4.35 22.65442345 18.33817
2013 0.34644 4.03 23.19090989 18.34244
2014 2.761954 3.58 23.91610038 17.77248
2015 0.789518 3.33 24.0053024 17.14929
2016 -0.11667 3.13 23.56428446 16.93938
(Source: data.worldbank.org)
1991
1992
1993
1994
1995
1996
1997
1998
1999
2000
2001
2002
2003
2004
2005
2006
2007
2008
2009
2010
2011
2012
2013
2014
2015
2016-5
0
5
10
15
20
25
30
Inflation
Inflation (AUS) Inflation (China) Inflation (South Korea
Inflation (Japan) Inflation (UK)
Year
Inflation rate
8THE GLOBAL ECONOMY
Figure 3: Inflation rate for all the five countries
1991
1992
1993
1994
1995
1996
1997
1998
1999
2000
2001
2002
2003
2004
2005
2006
2007
2008
2009
2010
2011
2012
2013
2014
2015
2016
0
2
4
6
8
10
12
0
5
10
15
20
25
30
35
Australia
Unemployment Gross capital formation Expense
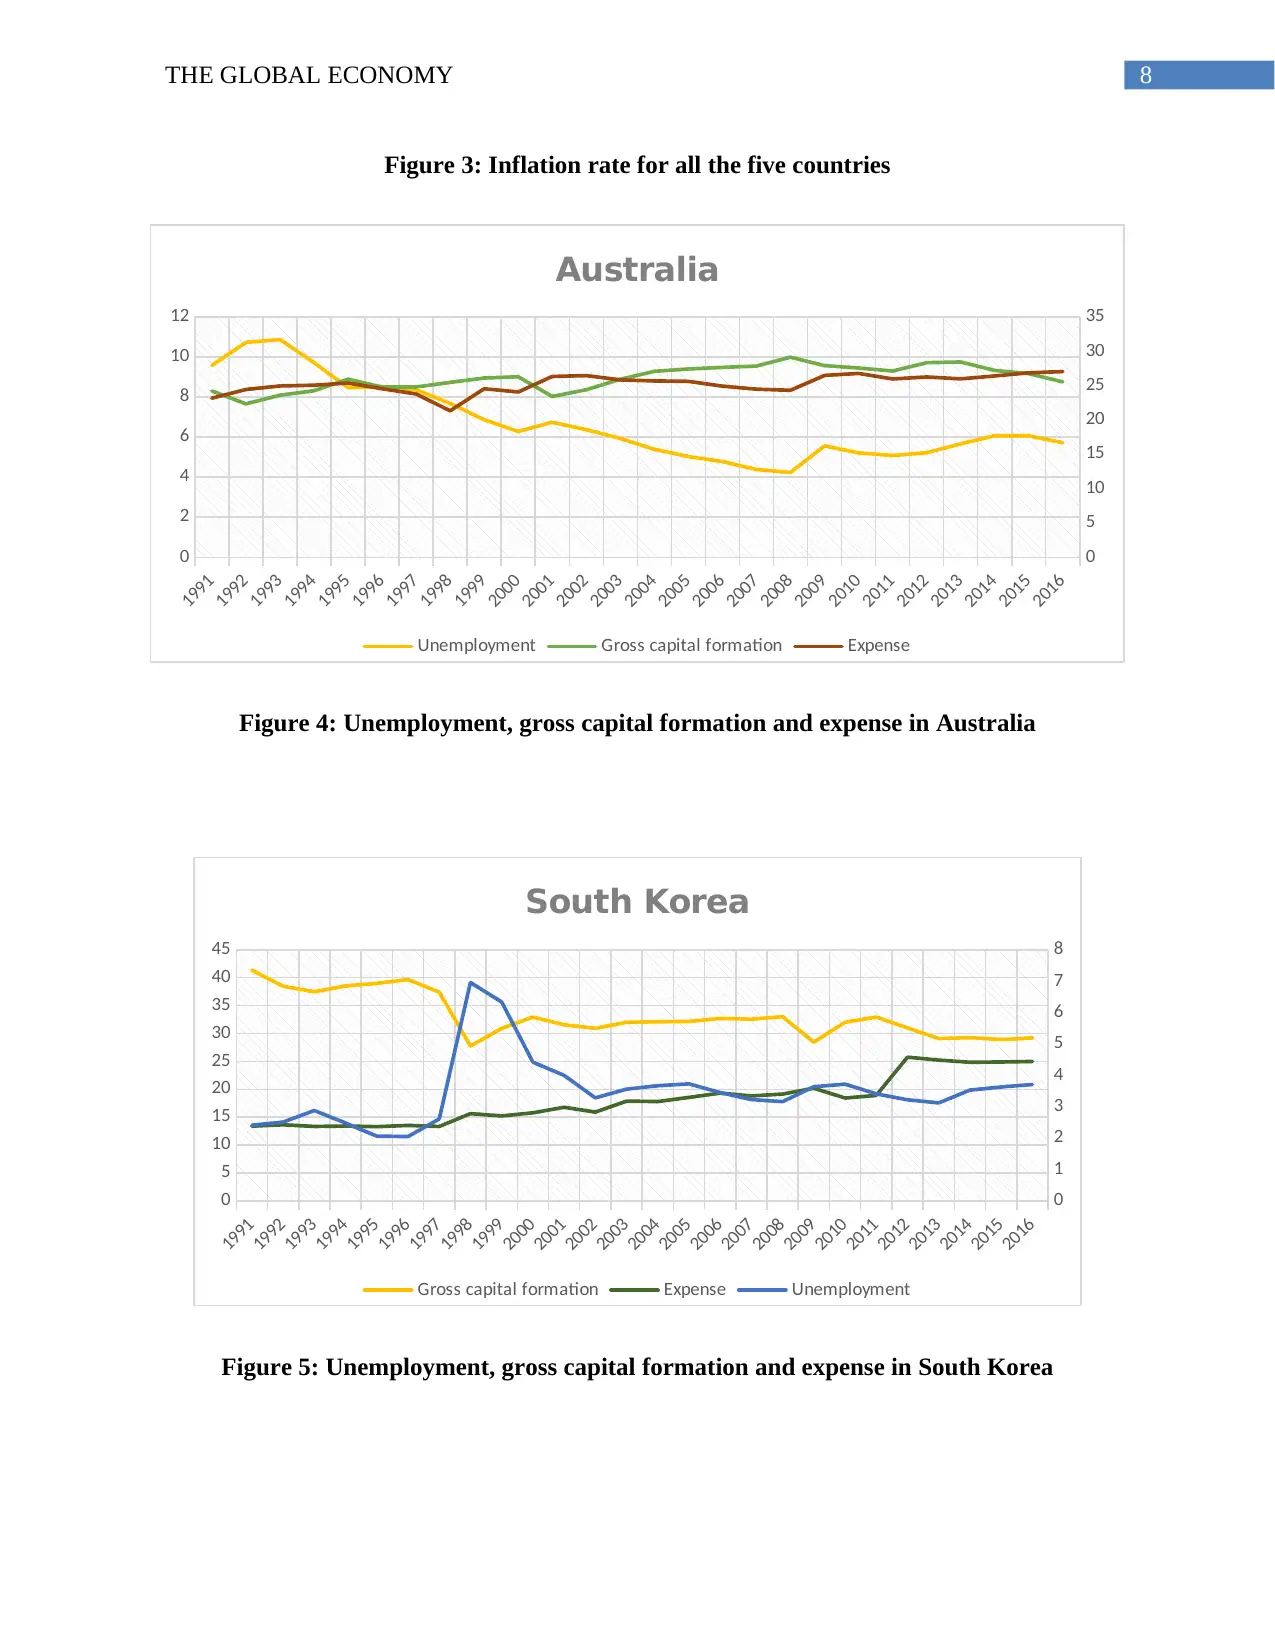
Figure 4: Unemployment, gross capital formation and expense in Australia
1991
1992
1993
1994
1995
1996
1997
1998
1999
2000
2001
2002
2003
2004
2005
2006
2007
2008
2009
2010
2011
2012
2013
2014
2015
2016
0
5
10
15
20
25
30
35
40
45
0
1
2
3
4
5
6
7
8
South Korea
Gross capital formation Expense Unemployment
Figure 5: Unemployment, gross capital formation and expense in South Korea
Figure 3: Inflation rate for all the five countries
1991
1992
1993
1994
1995
1996
1997
1998
1999
2000
2001
2002
2003
2004
2005
2006
2007
2008
2009
2010
2011
2012
2013
2014
2015
2016
0
2
4
6
8
10
12
0
5
10
15
20
25
30
35
Australia
Unemployment Gross capital formation Expense
Figure 4: Unemployment, gross capital formation and expense in Australia
1991
1992
1993
1994
1995
1996
1997
1998
1999
2000
2001
2002
2003
2004
2005
2006
2007
2008
2009
2010
2011
2012
2013
2014
2015
2016
0
5
10
15
20
25
30
35
40
45
0
1
2
3
4
5
6
7
8
South Korea
Gross capital formation Expense Unemployment
Figure 5: Unemployment, gross capital formation and expense in South Korea
⊘ This is a preview!⊘
Do you want full access?
Subscribe today to unlock all pages.
Trusted by 1+ million students worldwide
9THE GLOBAL ECONOMY
1991
1992
1993
1994
1995
1996
1997
1998
1999
2000
2001
2002
2003
2004
2005
2006
2007
2008
2009
2010
2011
2012
2013
2014
2015
2016
0
5
10
15
20
25
30
35
40
45
50
0
2
4
6
8
10
12
United Kingdom
Gross capital formation Expense Unemployment
Figure 6: Unemployment, gross capital formation and expense in United Kingdom
1991
1992
1993
1994
1995
1996
1997
1998
1999
2000
2001
2002
2003
2004
2005
2006
2007
2008
2009
2010
2011
2012
2013
2014
2015
2016
0
10
20
30
40
50
60
0
1
2
3
4
5
6
China
Gross capital formation Expense Unemployment
Figure 7: Unemployment, gross capital formation and expense in China
1991
1992
1993
1994
1995
1996
1997
1998
1999
2000
2001
2002
2003
2004
2005
2006
2007
2008
2009
2010
2011
2012
2013
2014
2015
2016
0
5
10
15
20
25
30
35
40
45
50
0
2
4
6
8
10
12
United Kingdom
Gross capital formation Expense Unemployment
Figure 6: Unemployment, gross capital formation and expense in United Kingdom
1991
1992
1993
1994
1995
1996
1997
1998
1999
2000
2001
2002
2003
2004
2005
2006
2007
2008
2009
2010
2011
2012
2013
2014
2015
2016
0
10
20
30
40
50
60
0
1
2
3
4
5
6
China
Gross capital formation Expense Unemployment
Figure 7: Unemployment, gross capital formation and expense in China
Paraphrase This Document
Need a fresh take? Get an instant paraphrase of this document with our AI Paraphraser
10THE GLOBAL ECONOMY
1991
1993
1995
1997
1999
2001
2003
2005
2007
2009
2011
2013
2015
0
5
10
15
20
25
30
35
40
0
1
2
3
4
5
6
Japan
Gross capital formation Expense
Unemployment
Figure 8: Unemployment, gross capital formation and expense in Japan
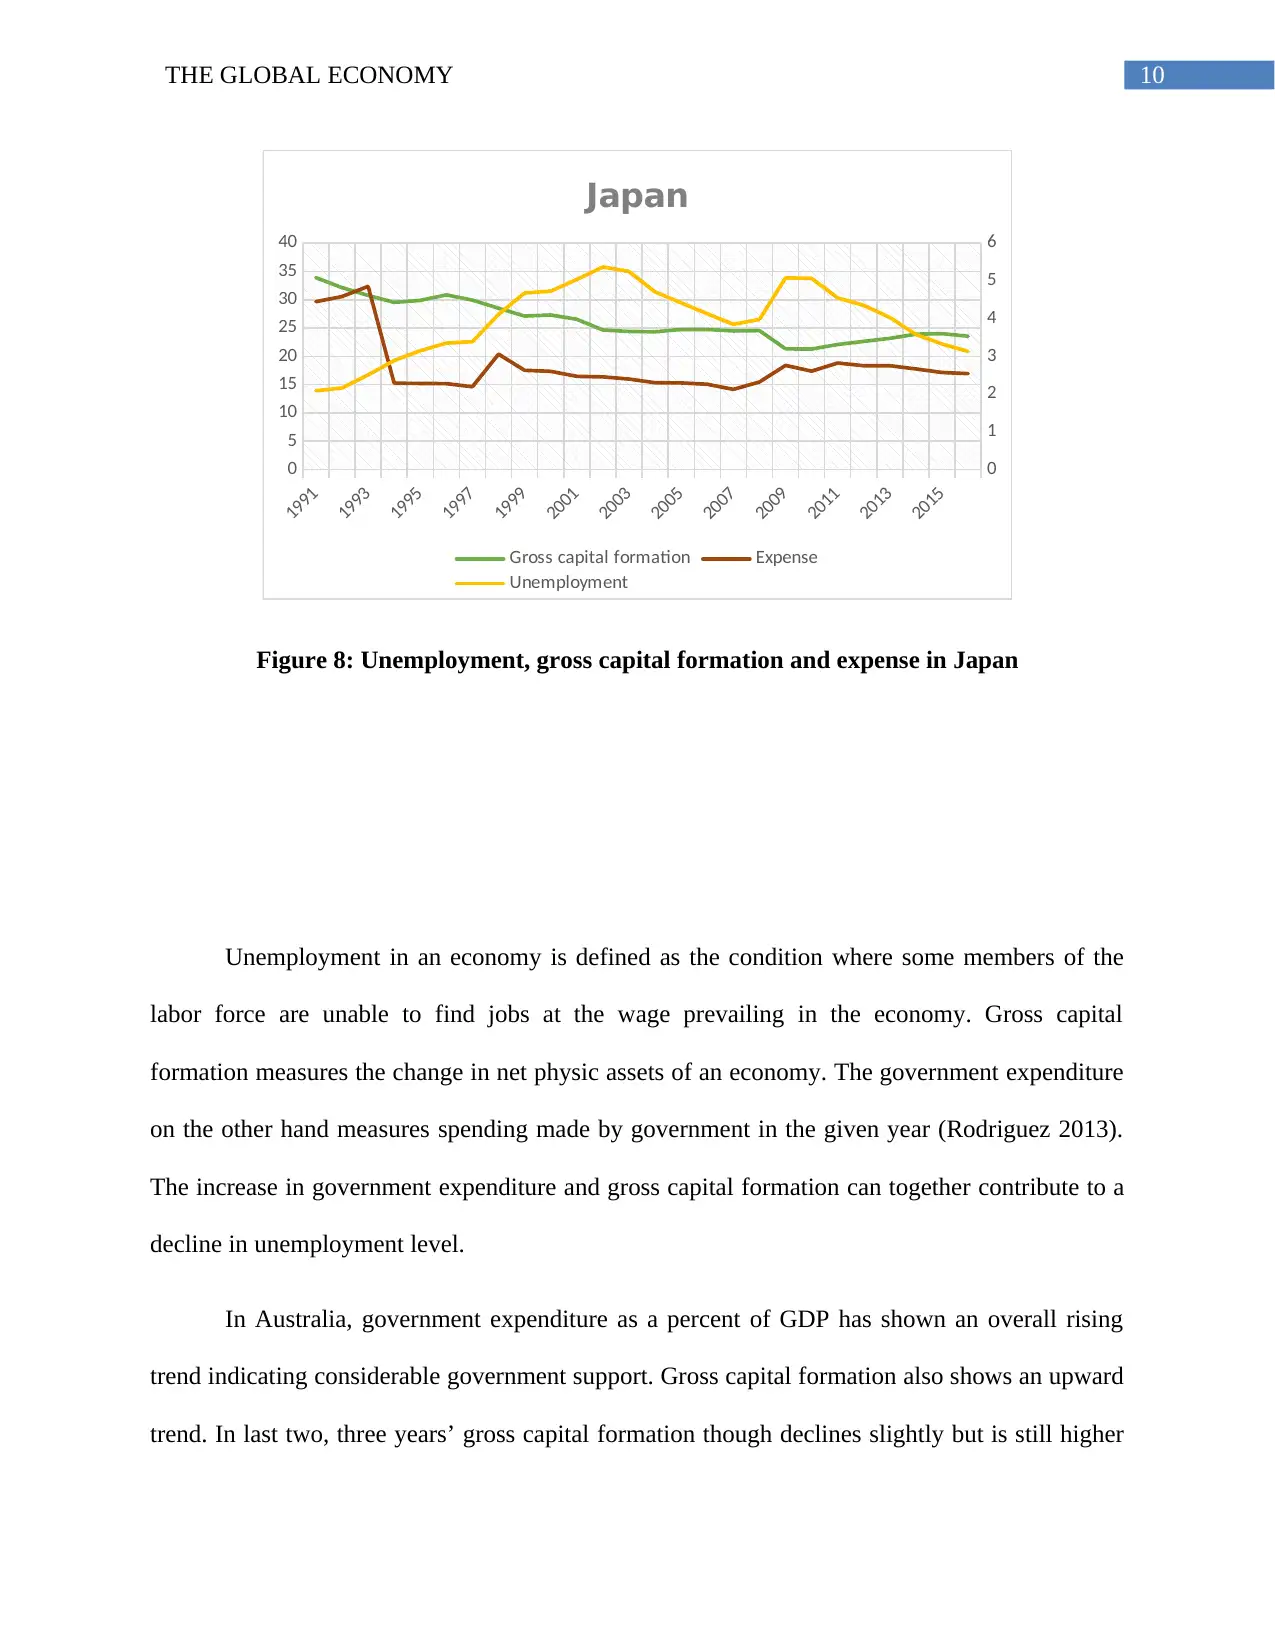
Unemployment in an economy is defined as the condition where some members of the
labor force are unable to find jobs at the wage prevailing in the economy. Gross capital
formation measures the change in net physic assets of an economy. The government expenditure
on the other hand measures spending made by government in the given year (Rodriguez 2013).
The increase in government expenditure and gross capital formation can together contribute to a
decline in unemployment level.
In Australia, government expenditure as a percent of GDP has shown an overall rising
trend indicating considerable government support. Gross capital formation also shows an upward
trend. In last two, three years’ gross capital formation though declines slightly but is still higher
1991
1993
1995
1997
1999
2001
2003
2005
2007
2009
2011
2013
2015
0
5
10
15
20
25
30
35
40
0
1
2
3
4
5
6
Japan
Gross capital formation Expense
Unemployment
Figure 8: Unemployment, gross capital formation and expense in Japan
Unemployment in an economy is defined as the condition where some members of the
labor force are unable to find jobs at the wage prevailing in the economy. Gross capital
formation measures the change in net physic assets of an economy. The government expenditure
on the other hand measures spending made by government in the given year (Rodriguez 2013).
The increase in government expenditure and gross capital formation can together contribute to a
decline in unemployment level.
In Australia, government expenditure as a percent of GDP has shown an overall rising
trend indicating considerable government support. Gross capital formation also shows an upward
trend. In last two, three years’ gross capital formation though declines slightly but is still higher
11THE GLOBAL ECONOMY
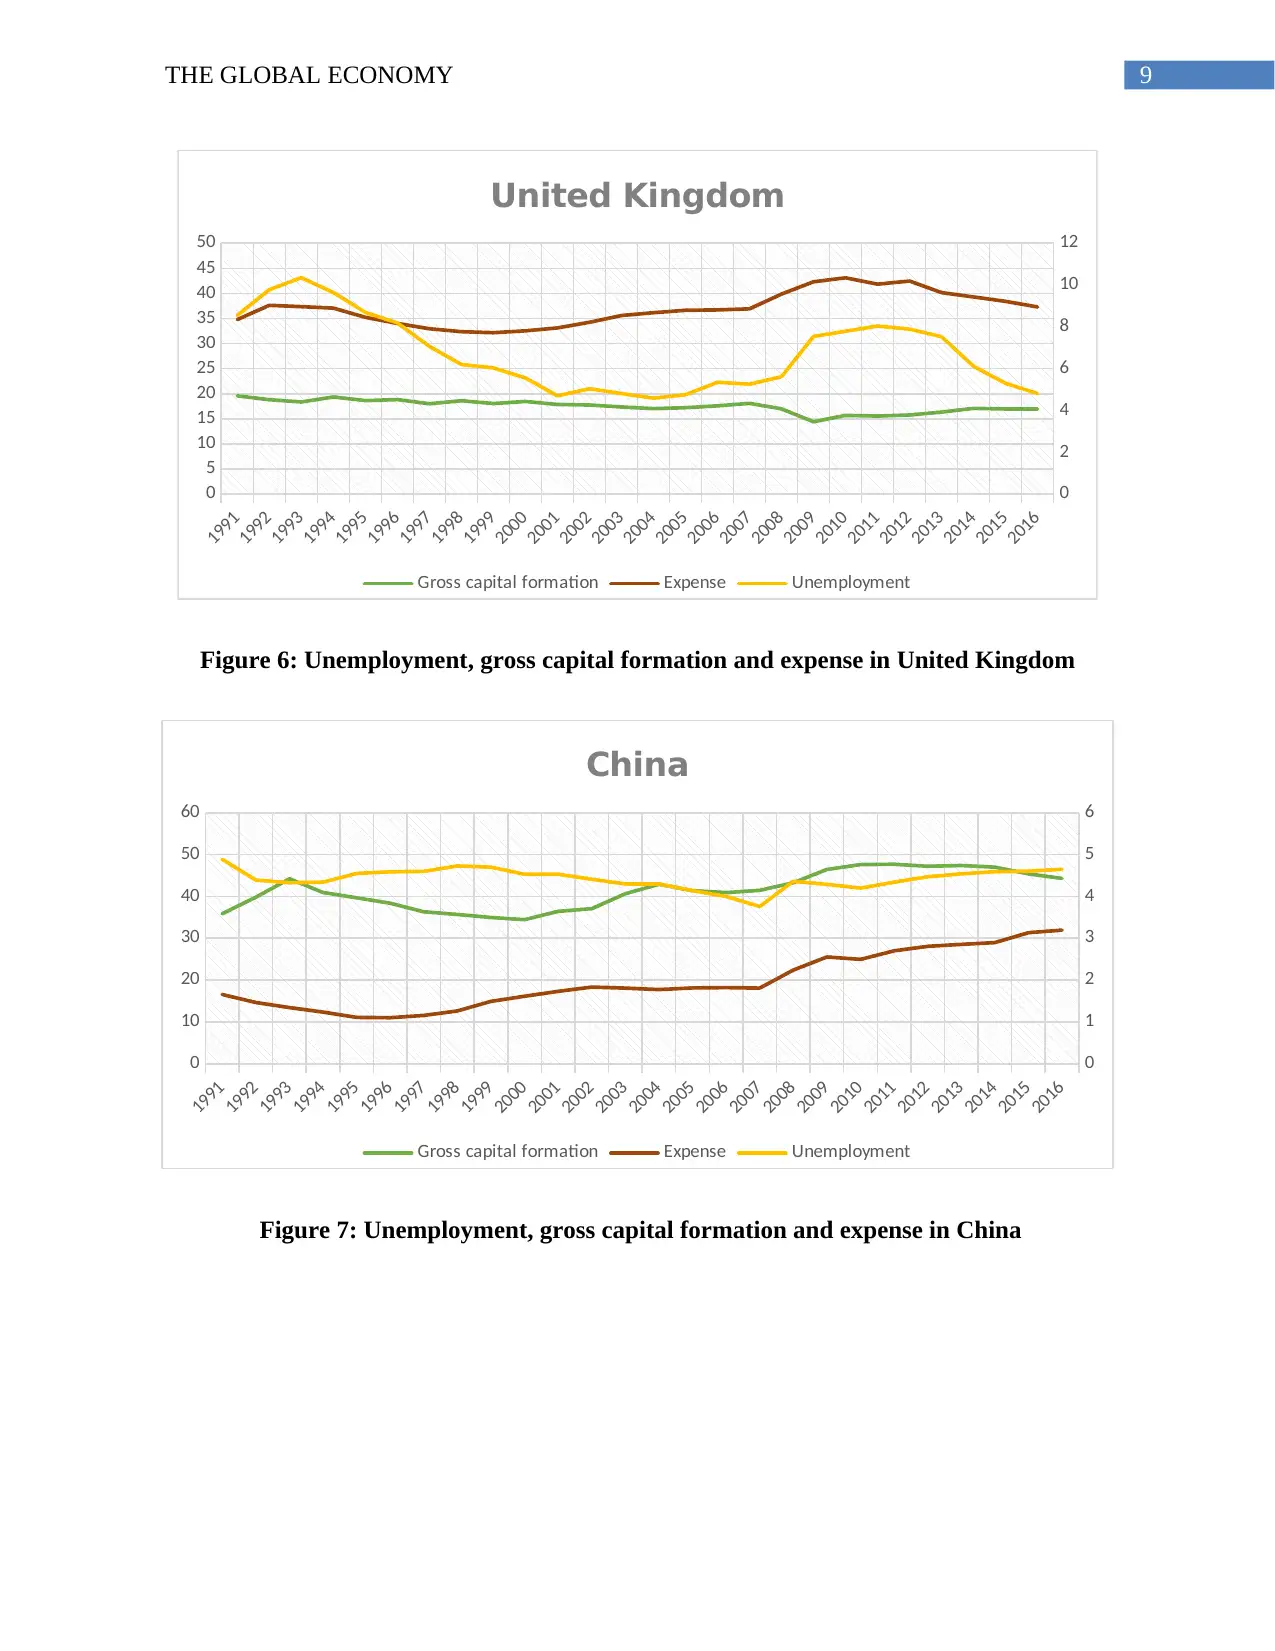
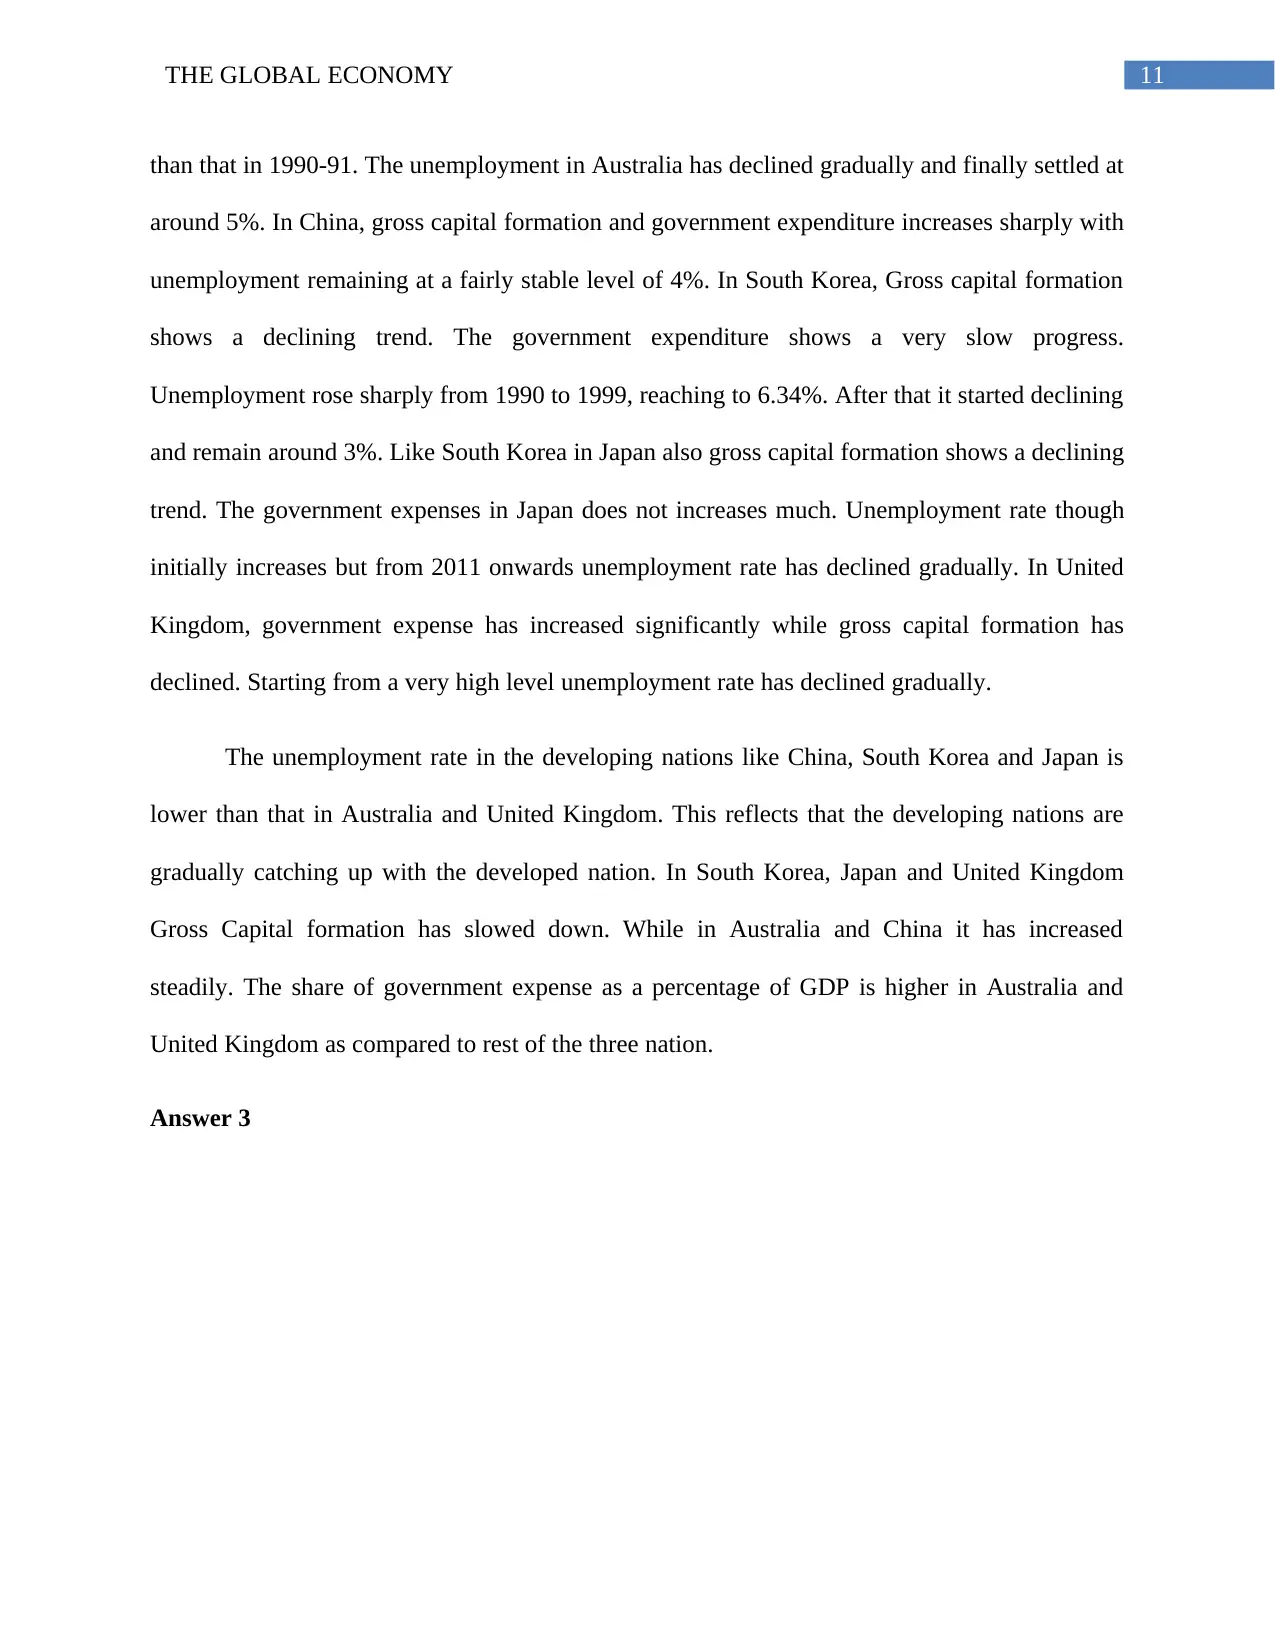
than that in 1990-91. The unemployment in Australia has declined gradually and finally settled at
around 5%. In China, gross capital formation and government expenditure increases sharply with
unemployment remaining at a fairly stable level of 4%. In South Korea, Gross capital formation
shows a declining trend. The government expenditure shows a very slow progress.
Unemployment rose sharply from 1990 to 1999, reaching to 6.34%. After that it started declining
and remain around 3%. Like South Korea in Japan also gross capital formation shows a declining
trend. The government expenses in Japan does not increases much. Unemployment rate though
initially increases but from 2011 onwards unemployment rate has declined gradually. In United
Kingdom, government expense has increased significantly while gross capital formation has
declined. Starting from a very high level unemployment rate has declined gradually.
The unemployment rate in the developing nations like China, South Korea and Japan is
lower than that in Australia and United Kingdom. This reflects that the developing nations are
gradually catching up with the developed nation. In South Korea, Japan and United Kingdom
Gross Capital formation has slowed down. While in Australia and China it has increased
steadily. The share of government expense as a percentage of GDP is higher in Australia and
United Kingdom as compared to rest of the three nation.
Answer 3
⊘ This is a preview!⊘
Do you want full access?
Subscribe today to unlock all pages.
Trusted by 1+ million students worldwide
1 out of 25
Related Documents


Your All-in-One AI-Powered Toolkit for Academic Success.
+13062052269
info@desklib.com
Available 24*7 on WhatsApp / Email
![[object Object]](/_next/static/media/star-bottom.7253800d.svg)
Unlock your academic potential
Copyright © 2020–2026 A2Z Services. All Rights Reserved. Developed and managed by ZUCOL.