ITECH7407: Real World Analytics - Food Resource Management Report
VerifiedAdded on 2023/06/07
|12
|2651
|266
Report
AI Summary
This report analyzes global food production and consumption trends from 1961 to 2013, addressing the growing global population and its impact on food demand. Utilizing IBM Watson analytics, the report examines data on food, feed, and meat production across various countries, with a focus on the United States, China, and India. The analysis includes business intelligence dashboards visualizing area-wise, country-wise, and element-wise production and consumption patterns. The report highlights significant increases in consumption and production, particularly in China, and provides recommendations for efficient resource management to address potential food crises. The study targets governments, non-profit organizations, and academic institutions, aiming to inform strategies for sustainable food production and distribution. The report emphasizes the need for efficient resource utilization to meet rising global food demands, especially in light of climate change and other challenges.
Running Head: REAL WORLD ANALYTICS
Real World Analytics
Name of the Student:
Name of the University:
Course ID:
Real World Analytics
Name of the Student:
Name of the University:
Course ID:
Paraphrase This Document
Need a fresh take? Get an instant paraphrase of this document with our AI Paraphraser
1REAL WORLD ANALYTICS
Table of Contents
1. Introduction:................................................................................................................................3
1.1 Background:...........................................................................................................................3
1.2 Software used:........................................................................................................................4
1.3 Data Source:...........................................................................................................................4
1.4 Variables used:.......................................................................................................................4
1.5 Target Audience:....................................................................................................................5
1.6 Analytical Approach:.............................................................................................................5
2. Business Intelligence Dashboards:..............................................................................................5
3. Conclusion:..................................................................................................................................9
4. Recommendation:........................................................................................................................9
5. Cover Letter to the CEO............................................................................................................10
References:....................................................................................................................................11
2REAL WORLD ANALYTICS
Table of Dashboards
Dashboard 1: Area wise Production and Consumption of food and feed........................................5
Dashboard 2: Country wise production and consumption of food and feed...................................6
Dashboard 3: Element wise average production and consumption.................................................6
Dashboard 4: Average production and consumption of meats in all countries...............................7
⊘ This is a preview!⊘
Do you want full access?
Subscribe today to unlock all pages.
Trusted by 1+ million students worldwide
3REAL WORLD ANALYTICS
1. Introduction:
In the contemporary period, one of the primary issues of immense concern across the
globe is that of the increasing population in all corners of the world. The population of the world
has been growing immensely, which in turn has led to the increase in the consumption of
necessary products required for sustenance of life of human beings as well as other living
creatures in the world (Knox, Marston & Imort, 2016). Of these products, the commodities of
utmost importance are that of food as well as agricultural products as the survival of the
increasing population of the world depends on the extent of production of the same. Over the
years, with the rising population and increase in the demand for food and related products, the
supply of the same has also changed considerably and variously across different countries of the
globe (Khoury et al., 2014). Keeping this into consideration, the concerned paper emphasizes on
studying the trends of growth of these substances and the variances of the same across different
parts of the globe.
1.1 Background:
The global population, as discussed in the above section, is expected to increase from 7.3
billion in the current period to as high as 9.7 billion by the year 2050. With this huge increase in
the population, the demand for food and agricultural products have also been increasing as the
demand for the same is inelastic (Bloom, Canning & Lubet, 2015). This in turn, has made it
challenging for the agricultural sector in all parts of the world, to develop and produce more
effectively and efficiently in order to fulfill the demands of an increasing population across the
globe (Seto, Güneralp & Hutyra, 2012). In this context, however, the climatic changes and
phenomena like that of global warming, pollution explosion have been making it more difficult
for the agricultural and food production sector of different parts of the countries. In this context,
it becomes crucial to analyze the trends in the changes of the production and supply of food and
agricultural products, especially food and feed over different parts of the globe (Herrero &
Thornton, 2013). While the category of food refers to the amount of human food available for
consumption, the category of feed refers to the food items which are available for the livestock
and poultry. The concerned research tries to analyze these trends between the years 1961 and
2013.
Paraphrase This Document
Need a fresh take? Get an instant paraphrase of this document with our AI Paraphraser
4REAL WORLD ANALYTICS
1.2 Software used:
For the purpose of analysis of the trends and patterns of changes in the consumption and
production of agricultural products (food, feed and different items like meat), the software
named IBM Watson has been used and a descriptive analysis has been done instead of a
predictive analysis where with the help of the data collected and observed the assertions about
the trends and patterns in the changes in production and consumption of food, feed and meat
products across different countries of the world. The software has been used to develop the
dashboards representation of the patterns (High, 2012).
1.3 Data Source:
For the purpose of formation of the concerned analytical report, different authentic and
reputed academic journals, sources as well as articles have been taken into consideration. For the
purpose of analysis, the data regarding the volume of production and consumption of food
products, feed and meat, across different parts of the world, over the time period of 1961 to
2013, has been collected from the following statistical database:
https://data.world/mchadhar/worldfood-dataset
1.4 Variables used:
Variables Descriptions
Area Abbreviation Abbreviation of Countries
Area Name of the Country
Item code Numerical code of different types of food and
feed
Item Name of feed, food and drinks
Element Categorization of food and feed
Unit 1000 tons
Latitude Latitude of the country
Longitude Longitude of the country
Y2016 to Y2013 The production and consumption of food or
feed in year 1961 and year 2013.
5REAL WORLD ANALYTICS
1.5 Target Audience:
The concerned research targets governments, different non-profit organizations as well as
academic institutions with the intention of spreading the information and knowledge about the
ongoing problem of growing crisis of food supply and demand-supply mismatch, thereby making
the global population aware through them and also involving them in designing and
implementation of the production increasing and optimizing techniques in the areas of problems
(Argote, 2012).
1.6 Analytical Approach:
The descriptive analytical approach has been taken for the purpose of conduction of the
concerned research with the help of which the production and consumption patterns of feed, food
and meet have been compared between the years 1961 and 2013 and the changes in the same
with time as well as the average trends in the production and consumption patterns. The IBM
Watson analytics has been used for the purpose of visualization of the same. With the help of the
database, the patterns, limitations are discussed and the recommendations have been provided
(Hoyt et al., 2016).
2. Business Intelligence Dashboards:
For the purpose of analysis and interpretation as well as visualization of large number of
evidences. The Dashboard form has been increasingly becoming a popular and efficient method
and the same has been used in this case, as can be seen in the following section.
⊘ This is a preview!⊘
Do you want full access?
Subscribe today to unlock all pages.
Trusted by 1+ million students worldwide
6REAL WORLD ANALYTICS
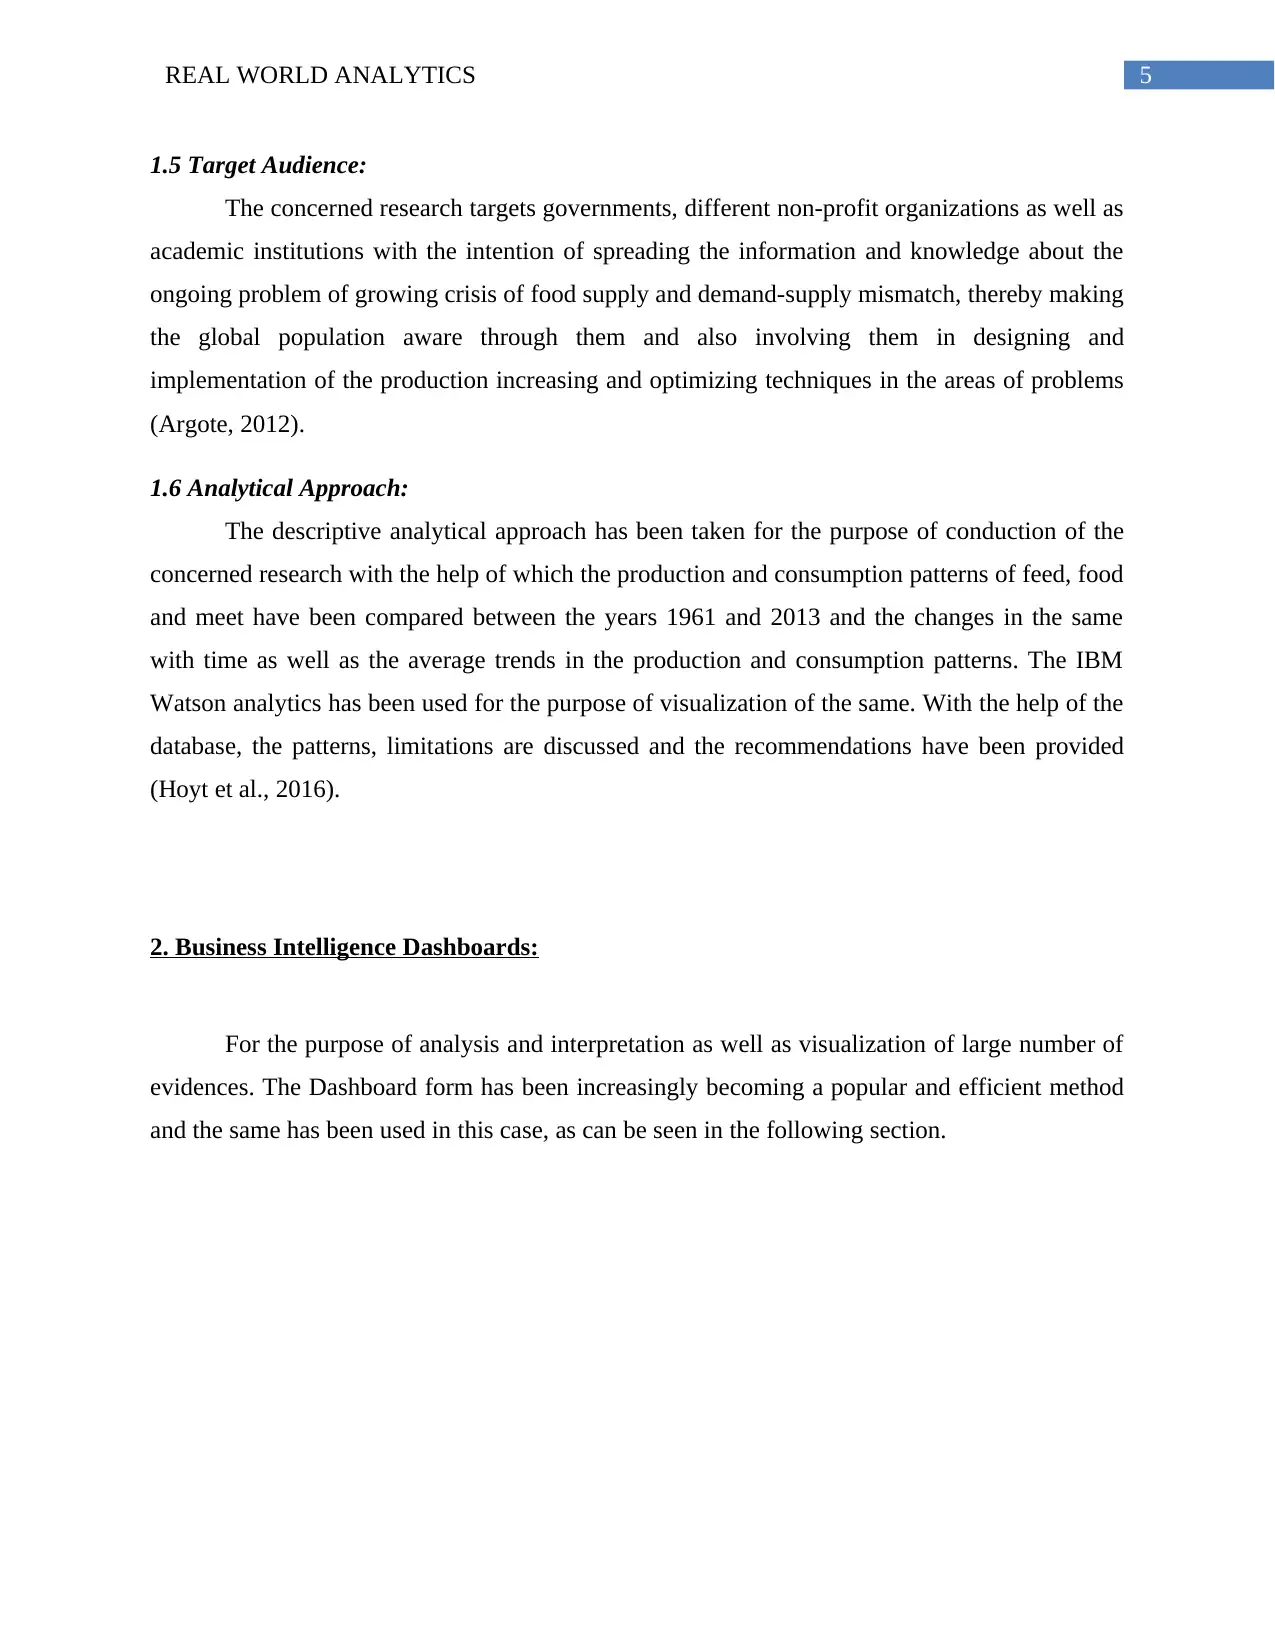
Dashboard 1: Area wise Production and Consumption of food and feed
As is clear from the above presentation, the total consumption of food and feed was
higher in countries like United States of America, China and India in 1961. The total
consumption of food and feed, both can still be seen to be higher in these three countries and
especially in China in the recent period (2013) too. The change of production and consumption
of food and feed from 1961 to 2016 is very significant in China. The average production and
consumption of food and feed in these 53 years is significant in China followed by India and
USA, which in turn indicates towards both the increases in the population as well as the increase
in the supply of agricultural products in the concerned regions.
Paraphrase This Document
Need a fresh take? Get an instant paraphrase of this document with our AI Paraphraser
7REAL WORLD ANALYTICS
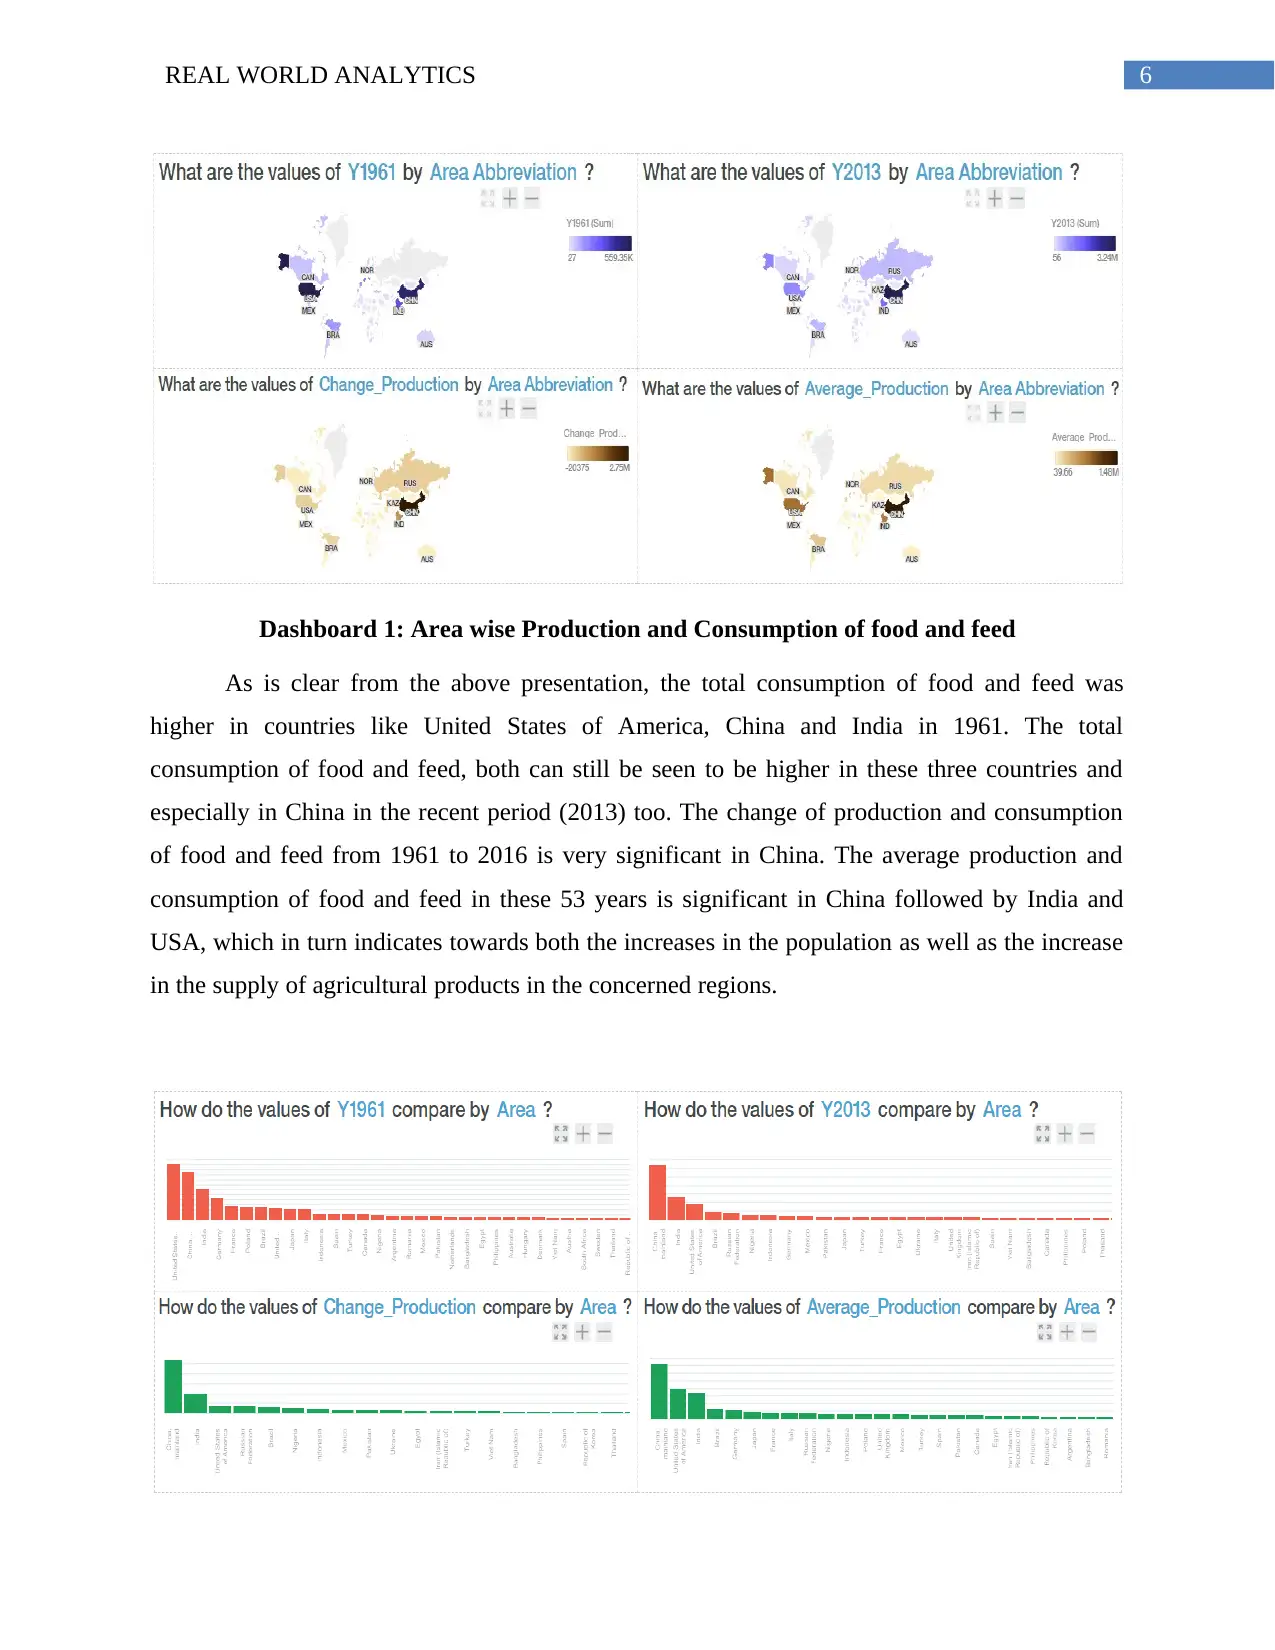
Dashboard 2: Country wise production and consumption of food and feed
The top producer and consumer of food and feed in 1961 are – 1) USA 2) China,
Mainland and 3) India. The top producer and consumer of food and feed in 2013 are – 1) China,
Mainland, 2) India and 3) United States of America. This, thereby, indicates towards the fact that
over the concerned period, these countries remained the leading producers of food as well as
feed.
The change in production from 1961 to 2013 are considerably observed in – 1) China,
mainland, 2) India, 3) United States of America. The average production of food and feed in 53
years can be seen to be highest in China, Mainland followed by United States of America and
India.
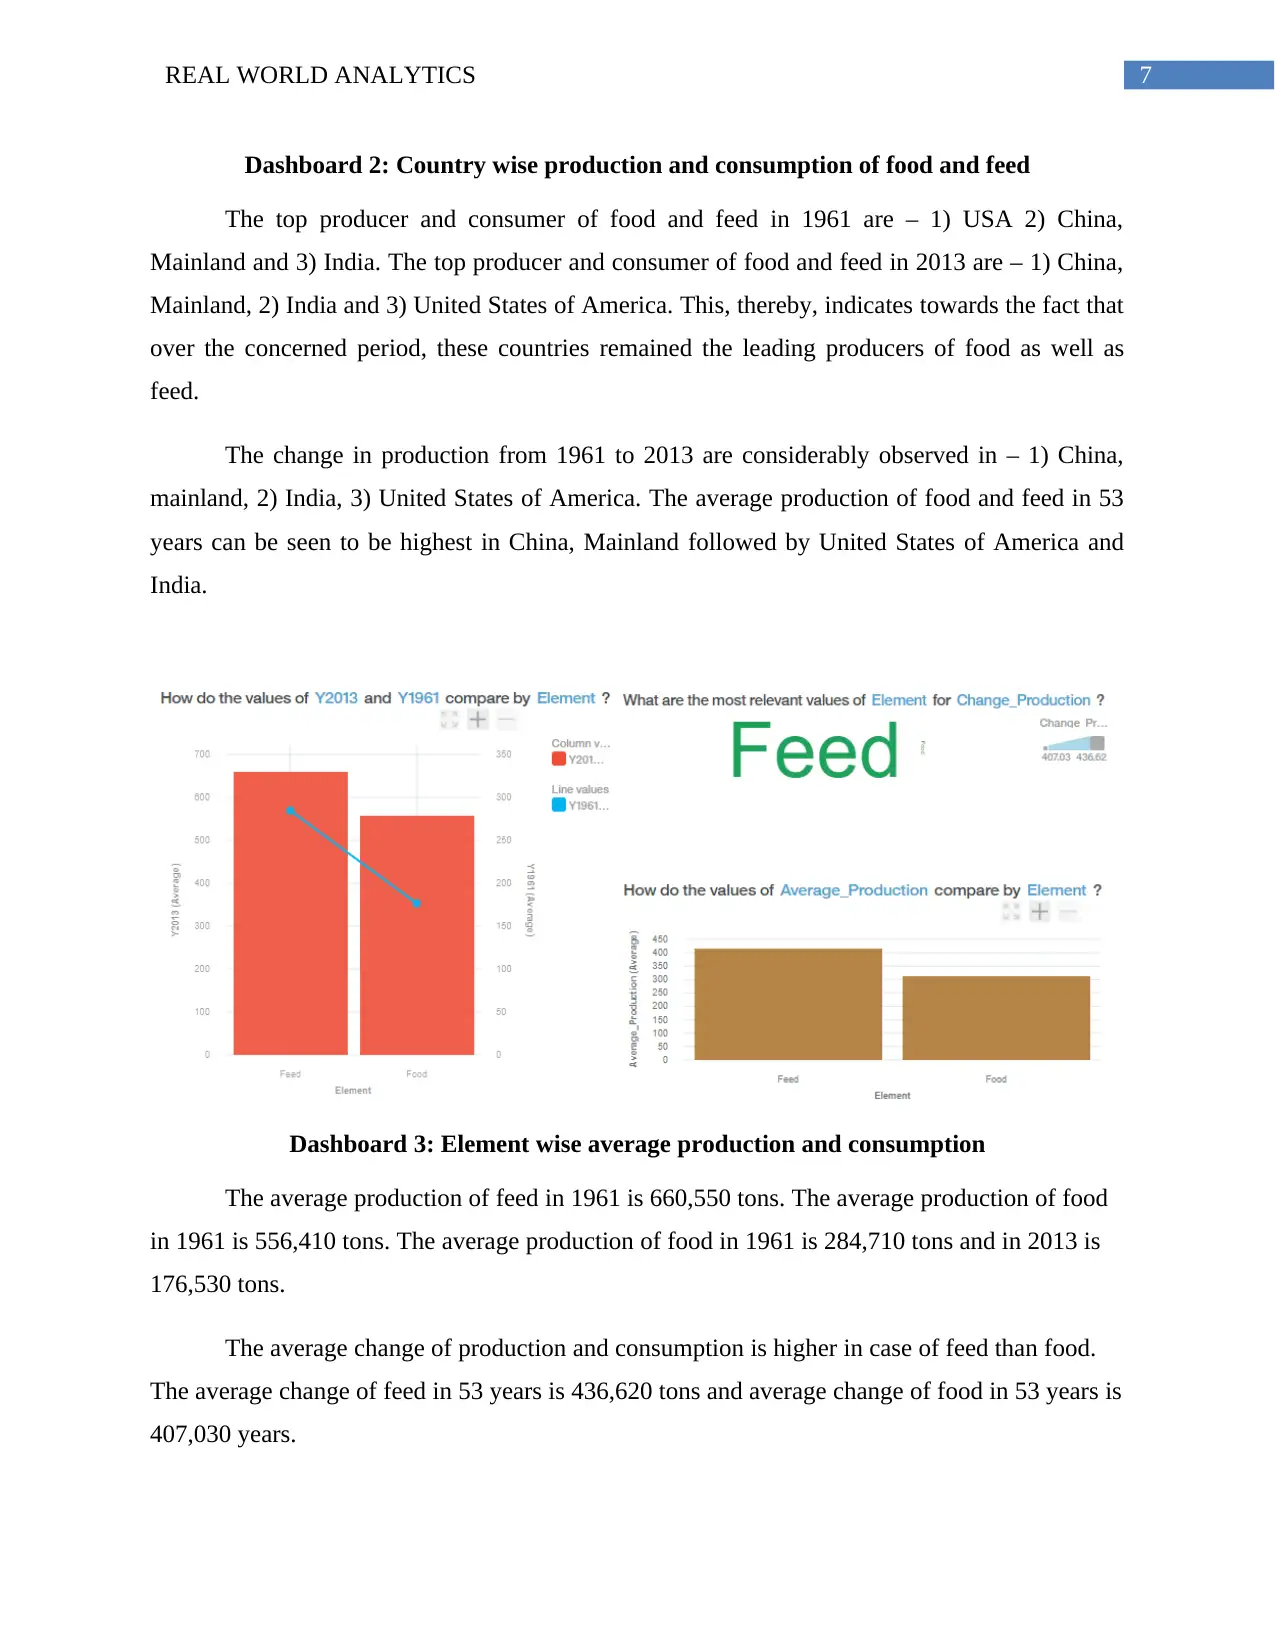
Dashboard 3: Element wise average production and consumption
The average production of feed in 1961 is 660,550 tons. The average production of food
in 1961 is 556,410 tons. The average production of food in 1961 is 284,710 tons and in 2013 is
176,530 tons.
The average change of production and consumption is higher in case of feed than food.
The average change of feed in 53 years is 436,620 tons and average change of food in 53 years is
407,030 years.
Dashboard 2: Country wise production and consumption of food and feed
The top producer and consumer of food and feed in 1961 are – 1) USA 2) China,
Mainland and 3) India. The top producer and consumer of food and feed in 2013 are – 1) China,
Mainland, 2) India and 3) United States of America. This, thereby, indicates towards the fact that
over the concerned period, these countries remained the leading producers of food as well as
feed.
The change in production from 1961 to 2013 are considerably observed in – 1) China,
mainland, 2) India, 3) United States of America. The average production of food and feed in 53
years can be seen to be highest in China, Mainland followed by United States of America and
India.
Dashboard 3: Element wise average production and consumption
The average production of feed in 1961 is 660,550 tons. The average production of food
in 1961 is 556,410 tons. The average production of food in 1961 is 284,710 tons and in 2013 is
176,530 tons.
The average change of production and consumption is higher in case of feed than food.
The average change of feed in 53 years is 436,620 tons and average change of food in 53 years is
407,030 years.
8REAL WORLD ANALYTICS
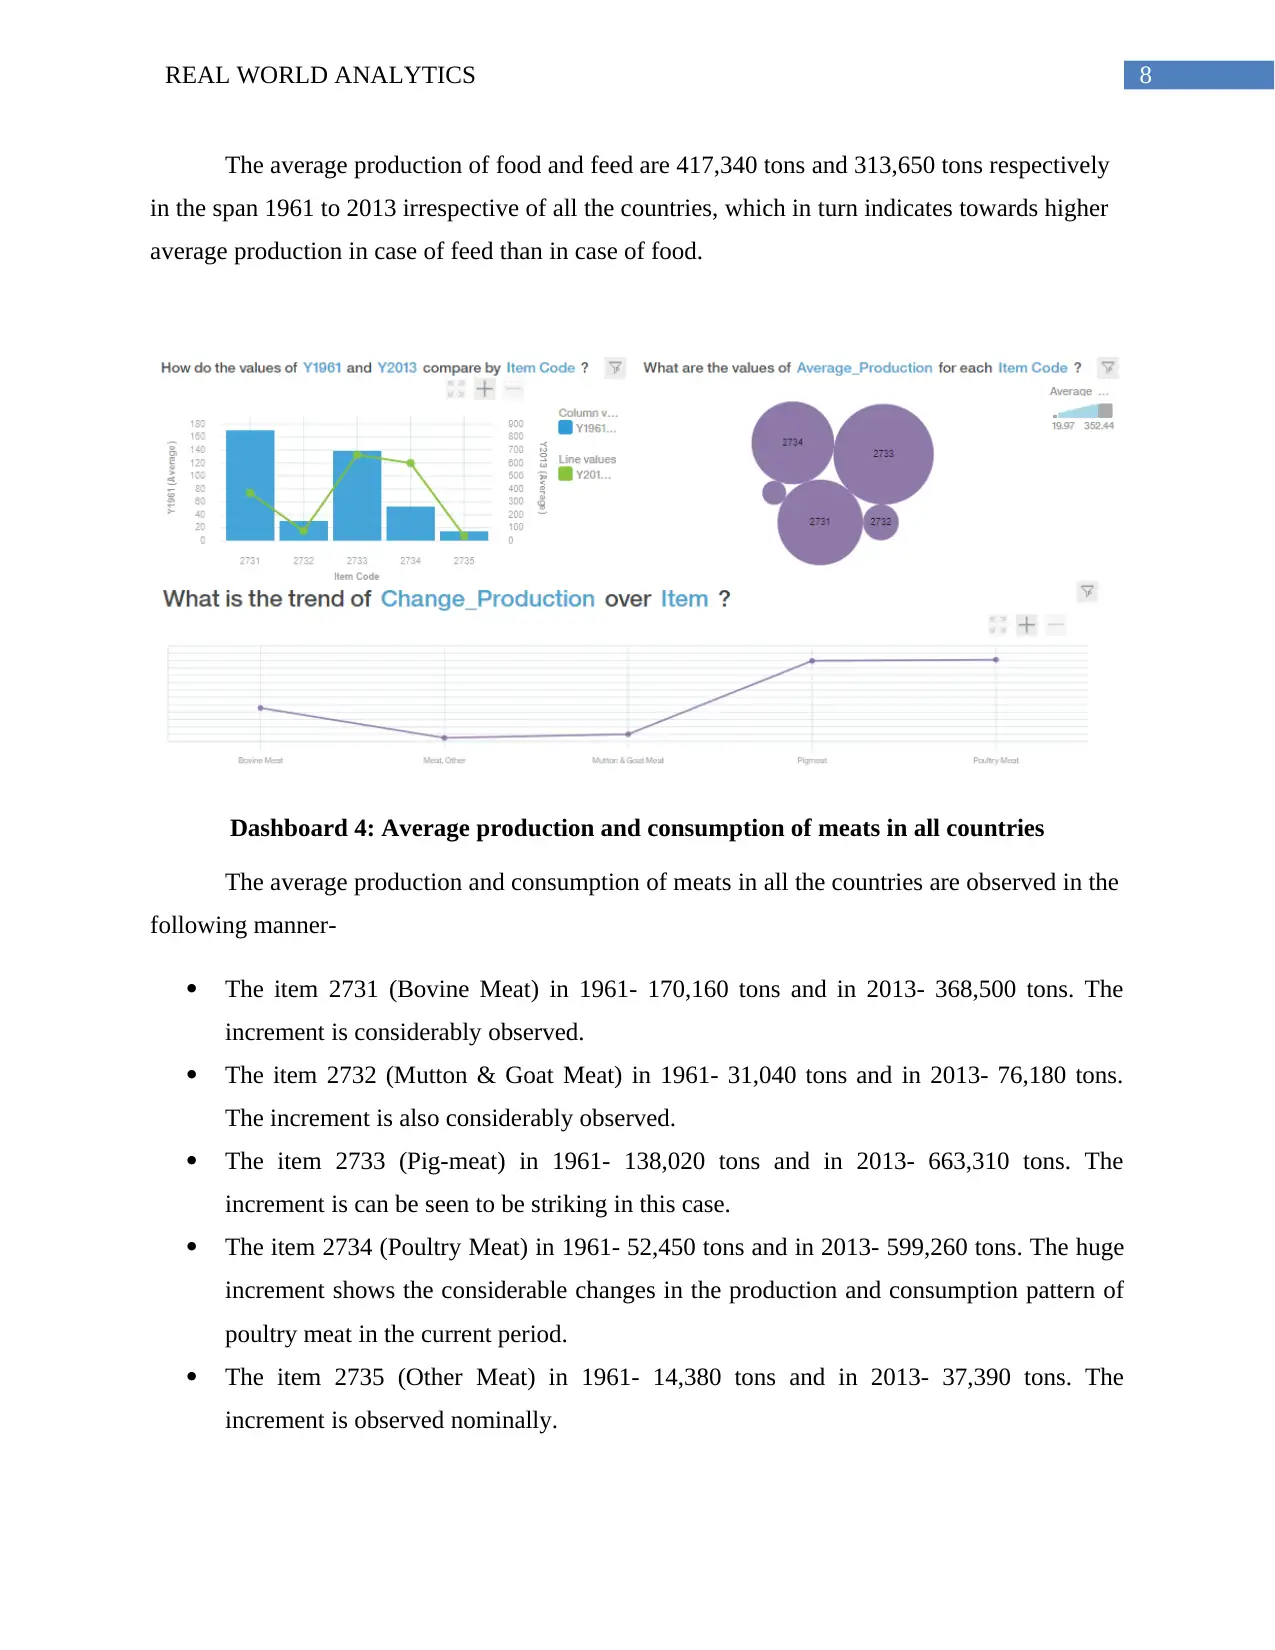
The average production of food and feed are 417,340 tons and 313,650 tons respectively
in the span 1961 to 2013 irrespective of all the countries, which in turn indicates towards higher
average production in case of feed than in case of food.
Dashboard 4: Average production and consumption of meats in all countries
The average production and consumption of meats in all the countries are observed in the
following manner-
The item 2731 (Bovine Meat) in 1961- 170,160 tons and in 2013- 368,500 tons. The
increment is considerably observed.
The item 2732 (Mutton & Goat Meat) in 1961- 31,040 tons and in 2013- 76,180 tons.
The increment is also considerably observed.
The item 2733 (Pig-meat) in 1961- 138,020 tons and in 2013- 663,310 tons. The
increment is can be seen to be striking in this case.
The item 2734 (Poultry Meat) in 1961- 52,450 tons and in 2013- 599,260 tons. The huge
increment shows the considerable changes in the production and consumption pattern of
poultry meat in the current period.
The item 2735 (Other Meat) in 1961- 14,380 tons and in 2013- 37,390 tons. The
increment is observed nominally.
⊘ This is a preview!⊘
Do you want full access?
Subscribe today to unlock all pages.
Trusted by 1+ million students worldwide
9REAL WORLD ANALYTICS
The average production and consumption of meats in all countries is highest for item
code 2733 (352,440 tons) followed by 2731 (255,630 tons). The average production and
consumption of meats in all countries is least for item code 2735 (19,970 tons).
The change of production and consumption from 1961 to 2013 is arranged as –
1) Poultry meat (555,210 tons)
2) Pig-meat (547,340 tons)
3) Bovine Meat (228,140 tons)
4) Mutton and Goat Meat (50,070 tons)
5) Other types of meat (25,200 tons).
This in turn implies that over the years the demand as well as production of poultry meat
as well as pig meat have increased substantially.
3. Conclusion:
As can be seen from the above analysis, over the concerned time period (1961-2013), it
can be seen that over the years, both production as well as consumption of food, feed and meet
have increased substantially. However, the consumption demand has been increasing more than
that of the supply. While production has been considerably increasing in China, India and the
USA, there lies many other countries whose production of food products have not been
increasing substantially, although the population and consumption of the products can be seen to
be increasing.
4. Recommendation:
In the recent period, the population of the globe has been increasing substantially and
especially in the Asian countries, attributing to the increasing development and industrial
Paraphrase This Document
Need a fresh take? Get an instant paraphrase of this document with our AI Paraphraser
10REAL WORLD ANALYTICS
activities in these regions, which in turn has led to a striking increase in the demand for food in
these regions. However, barring India and China, the production and supply of food cannot be
seen to be increasing in the same proportion in these countries, which can be due to loss of lands
to industries and residential aspects. Thus, to avoid crisis, the food production in these regions
need to be efficient in the aspects of proper utilization of resources and in meeting the rising
demand for the same owing to the increasing population in these regions.
5. Cover Letter to the CEO
Respected Sir/Madam,
From the analysis of the data collected, regarding the changes in the consumption and
production patterns of food products, feed and meat, across different parts of the globe, within
the time period of 1961 and 2013, it can be asserted that both the consumption and average
production of food as well as feed products have been increasing in the global scenario.
However, while the consumption of the same has been increasing at all parts of the globe, owing
to the increase in population, more or less everywhere, the production and supply of the same has
not been increasing to that extent and the magnitude of increase can also be seen to be varying
across different countries. The problem is expected to be more acute in the Asian countries,
except China and India, which in turn indicates towards the need for implementation of more
efficient production techniques as well as more effective allocation of the agricultural resources
(which are scarce as well as decreasing) in order to avoid the potential food crisis and food
inflation in these countries in near future.
Thanking You.
11REAL WORLD ANALYTICS
References:
Argote, L. (2012). Organizational learning: Creating, retaining and transferring knowledge.
Springer Science & Business Media.
Bloom, D. E., Canning, D., & Lubet, A. (2015). Global population aging: Facts, challenges,
solutions & perspectives. Daedalus, 144(2), 80-92.
Herrero, M., & Thornton, P. K. (2013). Livestock and global change: emerging issues for
sustainable food systems.
High, R. (2012). The era of cognitive systems: An inside look at IBM Watson and how it
works. IBM Corporation, Redbooks.
Hoyt, R. E., Snider, D., Thompson, C., & Mantravadi, S. (2016). IBM Watson analytics:
automating visualization, descriptive, and predictive statistics. JMIR public health and
surveillance, 2(2).
Khoury, C. K., Bjorkman, A. D., Dempewolf, H., Ramirez-Villegas, J., Guarino, L., Jarvis, A., ...
& Struik, P. C. (2014). Increasing homogeneity in global food supplies and the implications for
food security. Proceedings of the National Academy of Sciences, 111(11), 4001-4006.
Knox, P. L., Marston, S. A., & Imort, M. (2016). Human geography: Places and regions in
global context. Pearson.
Seto, K. C., Güneralp, B., & Hutyra, L. R. (2012). Global forecasts of urban expansion to 2030
and direct impacts on biodiversity and carbon pools. Proceedings of the National Academy of
Sciences, 109(40), 16083-16088.
⊘ This is a preview!⊘
Do you want full access?
Subscribe today to unlock all pages.
Trusted by 1+ million students worldwide
1 out of 12
Related Documents


Your All-in-One AI-Powered Toolkit for Academic Success.
+13062052269
info@desklib.com
Available 24*7 on WhatsApp / Email
![[object Object]](/_next/static/media/star-bottom.7253800d.svg)
Unlock your academic potential
Copyright © 2020–2026 A2Z Services. All Rights Reserved. Developed and managed by ZUCOL.