Analysis of Global Malaria Mortality: Business Analytics Report

Verified

Added on  2022/09/21

|17
|717
|30
Report
AI Summary
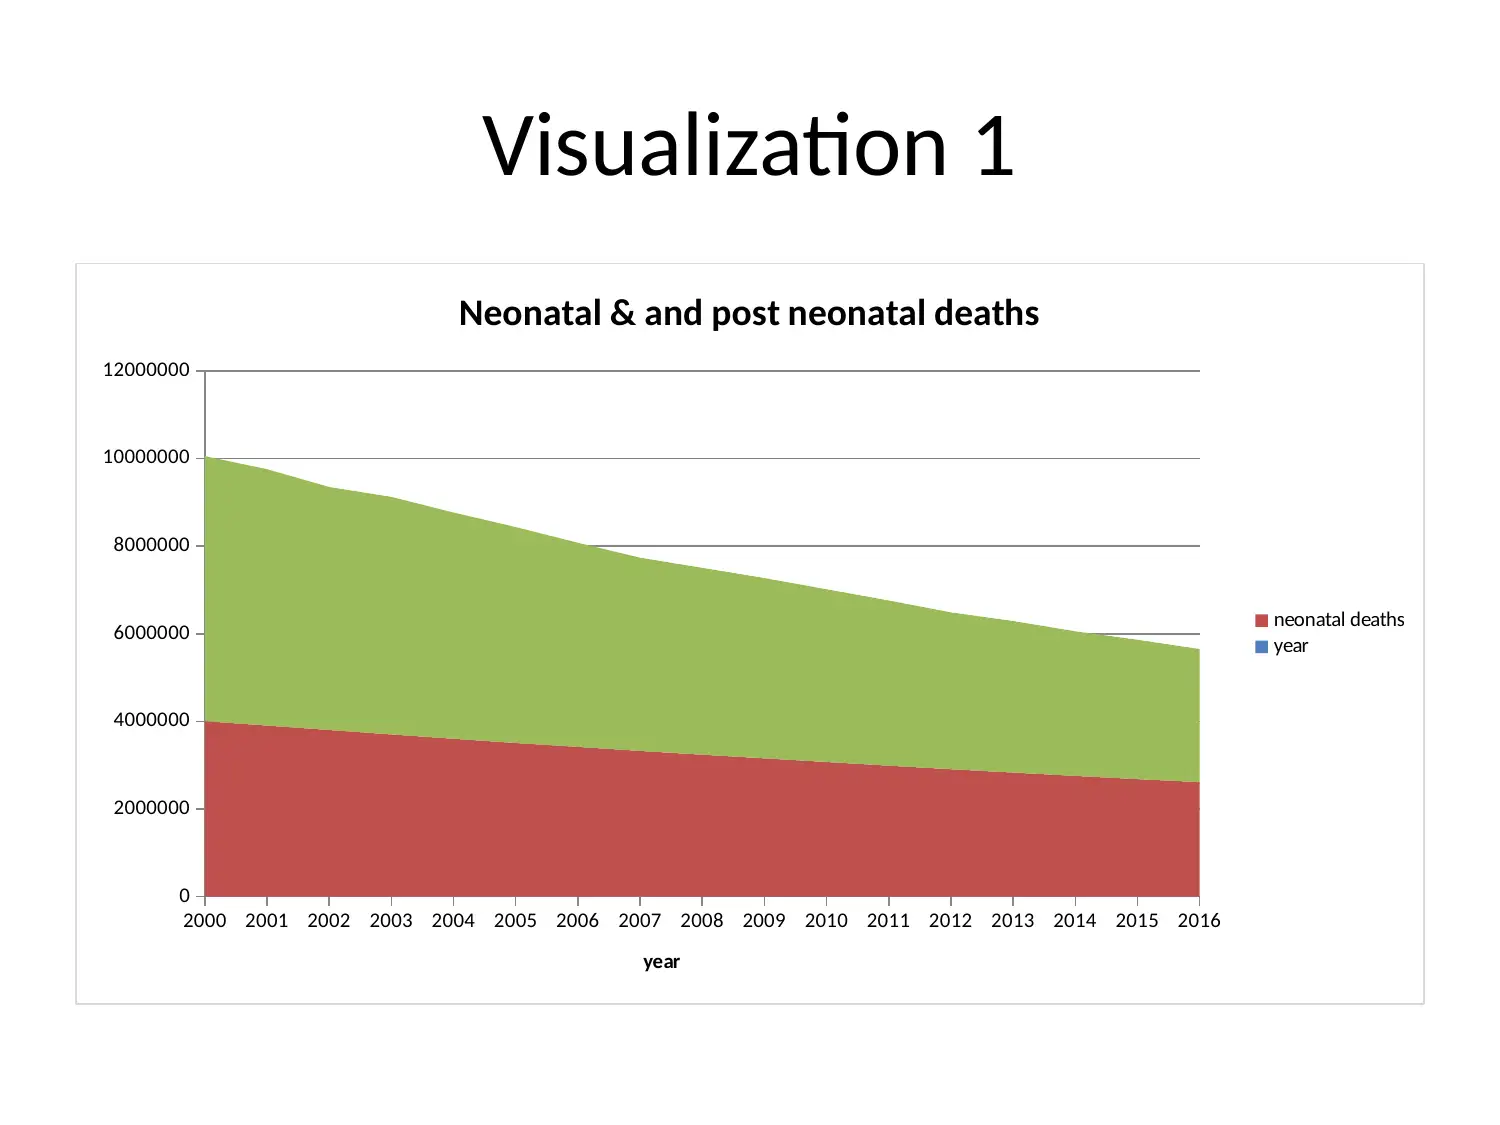
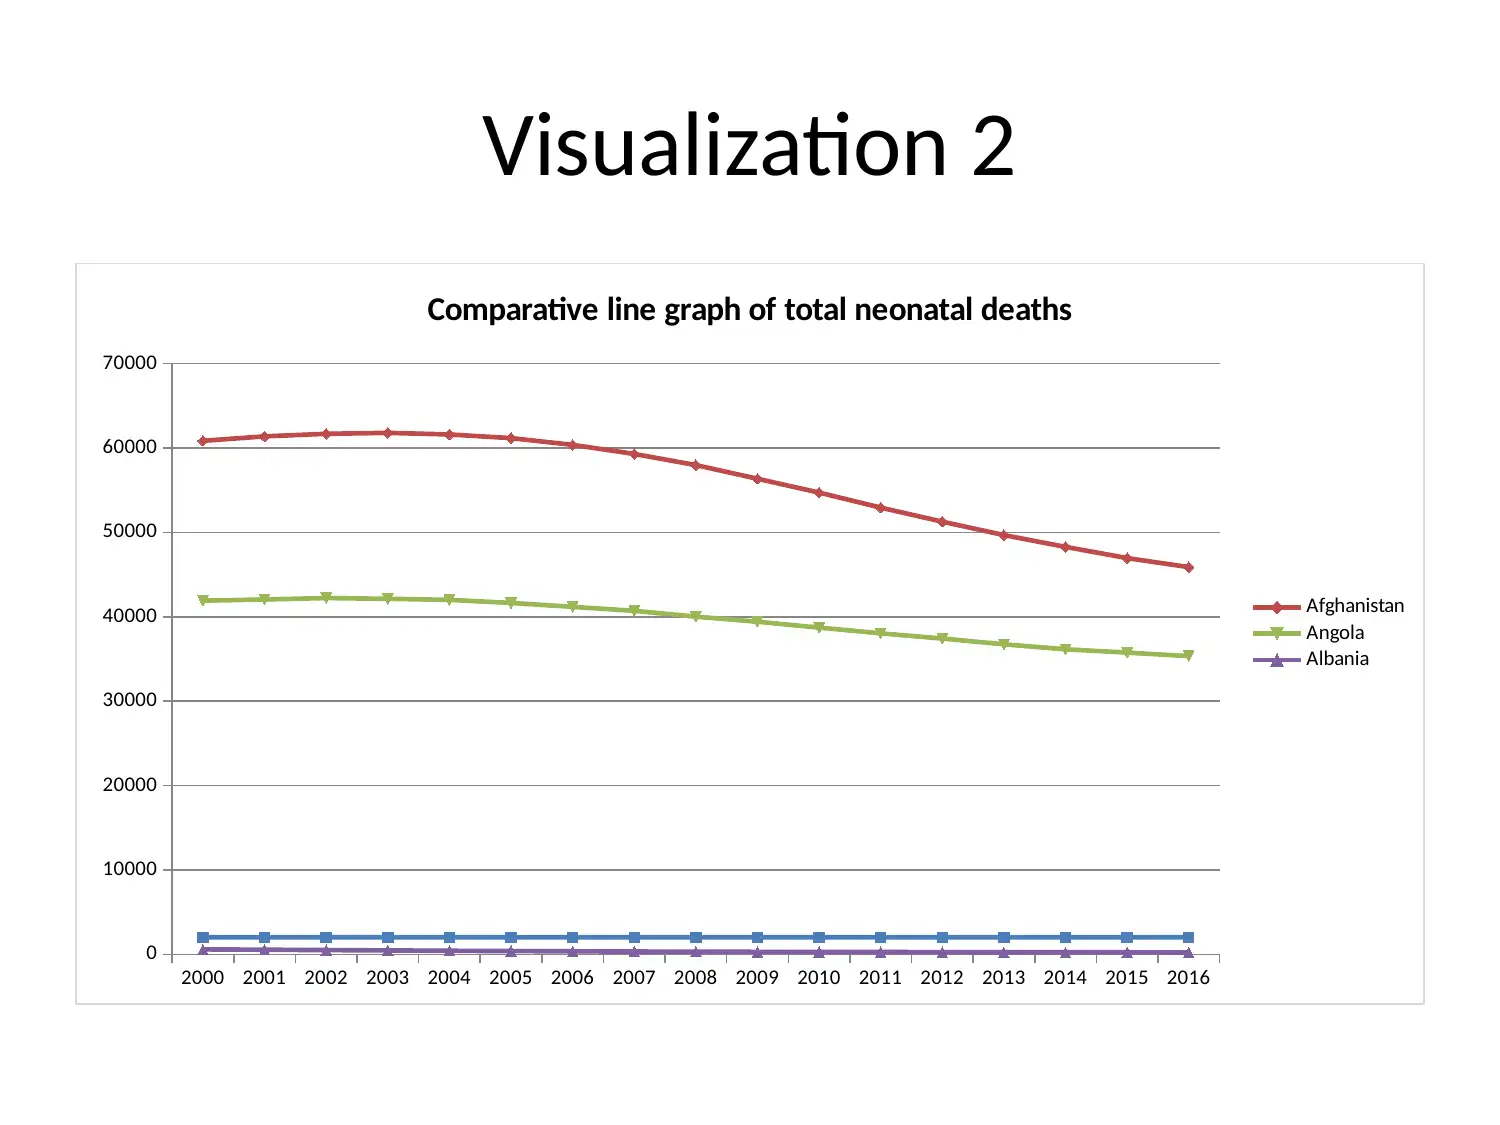
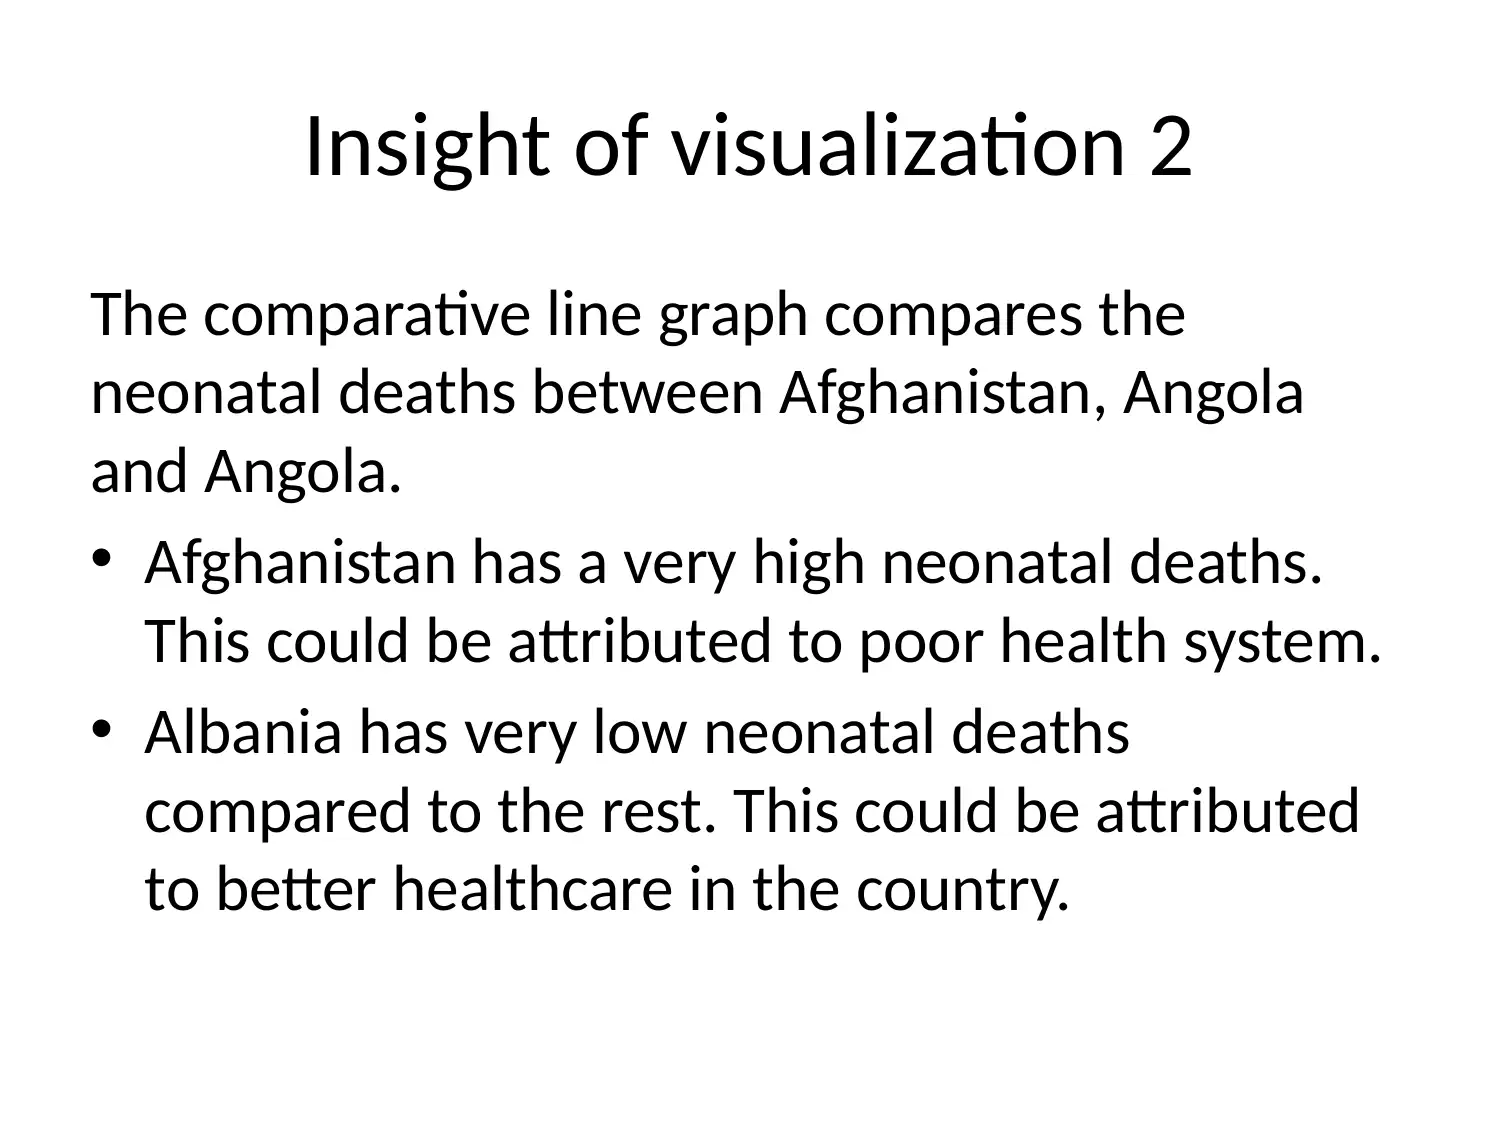
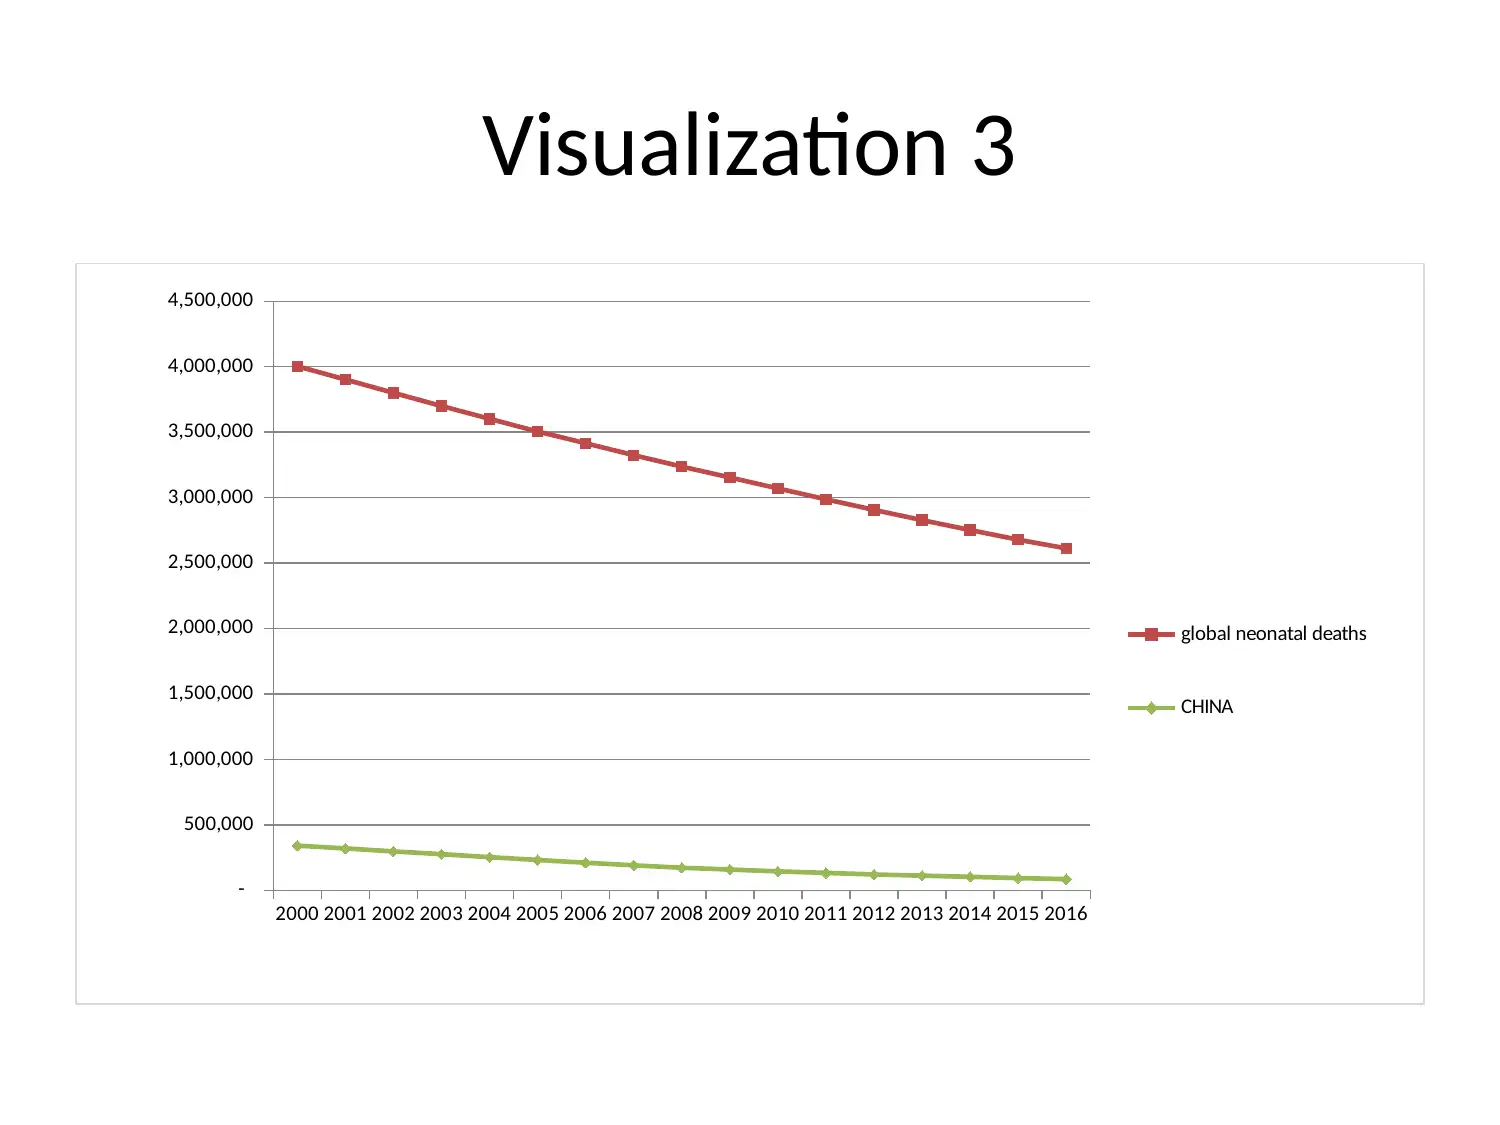
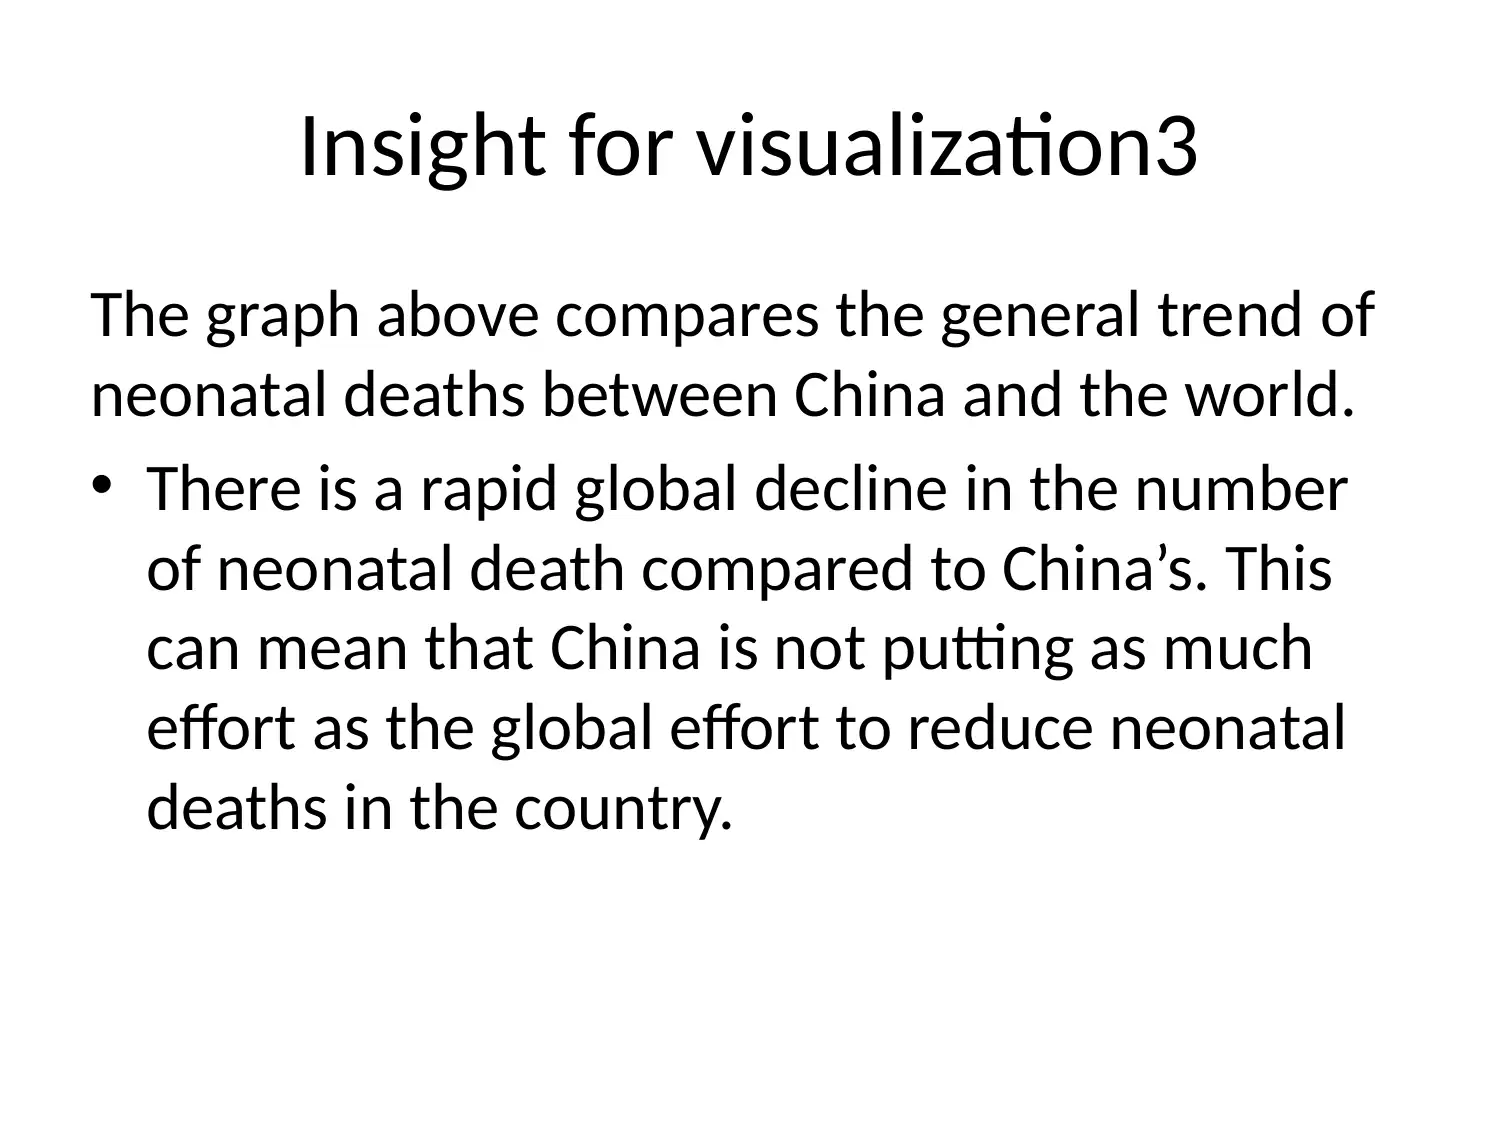
This report presents an analysis of global child mortality data due to malaria, utilizing data from Unicef. The objective is to analyze the patterns of deaths, comparing neonatal and post-neonatal deaths, and identifying trends from 2000 to 2016. The methodology employs descriptive statistics, including measures of central tendency, and presents results through line graphs and pie charts for easy interpretation. The data includes quantitative and categorical variables such as country names and death counts. The analysis reveals that post-neonatal deaths are generally higher than neonatal deaths, with a declining trend from 2000 to 2016. The report further compares neonatal deaths across countries like Afghanistan, Angola, and Albania, highlighting disparities in healthcare. Comparisons between China and global neonatal death trends are also presented. The report concludes that malaria contributes to 10% of global post-neonatal deaths and highlights the declining trend in under-5 deaths due to malaria, indicating improved healthcare.
Document Page
BUSINESS ANALYTICS
Global mortality due to malaria
tabler-icon-diamond-filled.svg

Paraphrase This Document

Need a fresh take? Get an instant paraphrase of this document with our AI Paraphraser
Document Page
Introduction
Health is an important aspect of human life. As such there
is need to ensure every human being is able to access
quality and affordable healthcare. However, this quest has
been met with myriad of challenges from resources to
infrastructure. The most vulnerable people have been the
pregnant women and infants. In this regard there has been
effort put by the Unicef to protect the life of infants. They
have been collecting data so that this can be used to
understand the patterns of infants deaths due to various
diseases. This research report focuses on deaths due to
malaria.
Document Page
Objective
The aim of this report is to present analyses and
results obtained from the Unicef data about
child mortality due to malaria. It seeks to
compare the mean global post-neonatal death
and the same deaths due to malaria.
Document Page
Methodology
This report adopted a descriptive statistics approach to describe the
data.
Descriptive statistics such as measures of central tendency was used
to establish the mean global post-neonatal deaths due to malaria.
Results of the analysis was presented in form of line graphs and pie
charts.
Pie chart was used to compare the mean global post-neonatal death
and the same deaths due to malaria.
Line graphs were used to determine the death trend from the year
2000 to 2016.
This was appropriate since the graphs and charts are easy to
interpret and have a visual appeal.
tabler-icon-diamond-filled.svg

Paraphrase This Document

Need a fresh take? Get an instant paraphrase of this document with our AI Paraphraser
Document Page
Data description
The data used in this analyses are both quantitative and
categorical. Categorical variable are the names of the countries
while the quantitative variables represent the number of deaths.
The data has several variables. The main variables of analysis
are;
Total global neonatal deaths.
Total global post-neonatal deaths.
Neonatal deaths due to malaria.
Post-neonatal deaths due to malaria.
Under five years deaths due to malaria.
Document Page
Visualization and insights
This section presents the results from the
analyses and their corresponding insights.
Document Page
Visualization 1
2000 2001 2002 2003 2004 2005 2006 2007 2008 2009 2010 2011 2012 2013 2014 2015 2016
0
2000000
4000000
6000000
8000000
10000000
12000000
Neonatal & and post neonatal deaths
neonatal deaths
year
year
tabler-icon-diamond-filled.svg

Paraphrase This Document

Need a fresh take? Get an instant paraphrase of this document with our AI Paraphraser
Document Page
Insight of visualization 1
In general post neonatal deaths are higher than
neonatal deaths. This means that most babies
are delivered safely.
There is a general reduction in post neonatal
deaths from the year 2000 to 2016. this could
be attributed to improving healthcare globally.
However, the rate of reduction of neonatal
deaths is a bit lower than that of post neonatal.
Document Page
Visualization 2
2000 2001 2002 2003 2004 2005 2006 2007 2008 2009 2010 2011 2012 2013 2014 2015 2016
0
10000
20000
30000
40000
50000
60000
70000
Comparative line graph of total neonatal deaths
Afghanistan
Angola
Albania
Document Page
Insight of visualization 2
The comparative line graph compares the
neonatal deaths between Afghanistan, Angola
and Angola.
Afghanistan has a very high neonatal deaths.
This could be attributed to poor health system.
Albania has very low neonatal deaths
compared to the rest. This could be attributed
to better healthcare in the country.
tabler-icon-diamond-filled.svg

Paraphrase This Document

Need a fresh take? Get an instant paraphrase of this document with our AI Paraphraser
Document Page
Visualization 3
2000 2001 2002 2003 2004 2005 2006 2007 2008 2009 2010 2011 2012 2013 2014 2015 2016
-
500,000
1,000,000
1,500,000
2,000,000
2,500,000
3,000,000
3,500,000
4,000,000
4,500,000
global neonatal deaths
CHINA
Document Page
Insight for visualization3
The graph above compares the general trend of
neonatal deaths between China and the world.
There is a rapid global decline in the number
of neonatal death compared to China’s. This
can mean that China is not putting as much
effort as the global effort to reduce neonatal
deaths in the country.
chevron_up_icon
1 out of 17
circle_padding
hide_on_mobile
zoom_out_icon
[object Object]