ITECH7407: Real-Time Analysis of Global Wheat & Products Consumption
VerifiedAdded on 2023/06/11
|18
|4359
|133
Report
AI Summary
This report analyzes global wheat and products consumption using real-time analytics, focusing on both food and feed applications. Data from the FAO is used to examine consumption trends from 1961 to 2013, highlighting significant increases in both food and feed consumption. The study identifies top consuming countries, analyzes per capita consumption, and examines consumption relative to population density. Time series analysis forecasts a decrease in per capita wheat consumption by 2050, estimating a total global need of 522,499 (1000 tonnes) wheat and products to meet future demands. The report concludes with key findings on consumption patterns and future projections.
Study of Consumption of Wheat and products over the World: A
real time analytics
Introduction
World population growing continuously, so finding the solution for feeding the
growing world population becomes the major concern for many academics, entrepreneurs and
food and agricultural organizations. There are foods that are highly demanded such as meat,
rice, wheat, fruits, milk etc. Wheat and products and Meat are the most demanded food for
human. For providing the meat, we need to produce animals for meat products. This animals
such as goat, pig, hens required wheat and products for feeding.
In this study, we concentrate on consumption of wheat and products for human and
for animals. Many authors studied the chemical properties of wheat and products including
Hashimoto, et al. (1998), Bonafaccia,et al. (2000), Kohler and Palter (1967), Zook et al.
(1970), Simonato et al. (2001).
Gooding and Davies (1997) explained the wheat production and its utilization. Garde
et al. (2002) studied the lactic acid production from wheat.
Research Question:
We have mainly focused on the following question:
i) How much wheat and products (food) consumed?
ii) How much wheat and products (feed) consumed?
Paraphrase This Document
Need a fresh take? Get an instant paraphrase of this document with our AI Paraphraser
iii) Which countries or territory consume more wheat and products (food)?
iv) Which countries or territory consume more wheat and products (feed)?
v) What is consumption of wheat and products per capita (in Kg) for the year 2013?
vi) What is consumption of wheat and products according to the population density for
the year 2013?
vii) What will be the total wheat and products consumption for the 2050?
Data Collection:
We have collected the data from The Food and Agriculture Organization (FAO) of the
United Nations. (Data Collection Website: http://www.fao.org/faostat/en/#home). FAO gives
the free access for the data of 245 countries and territories starting from 1961 to 2013. This
data includes 115 items for feed and food whichever applicable. Feed and food can refereed
as follows:
Feed : Quantity of feed available for feeding the animals and
Food : Total amount of food available for human.
We have also used population total and population density collected from
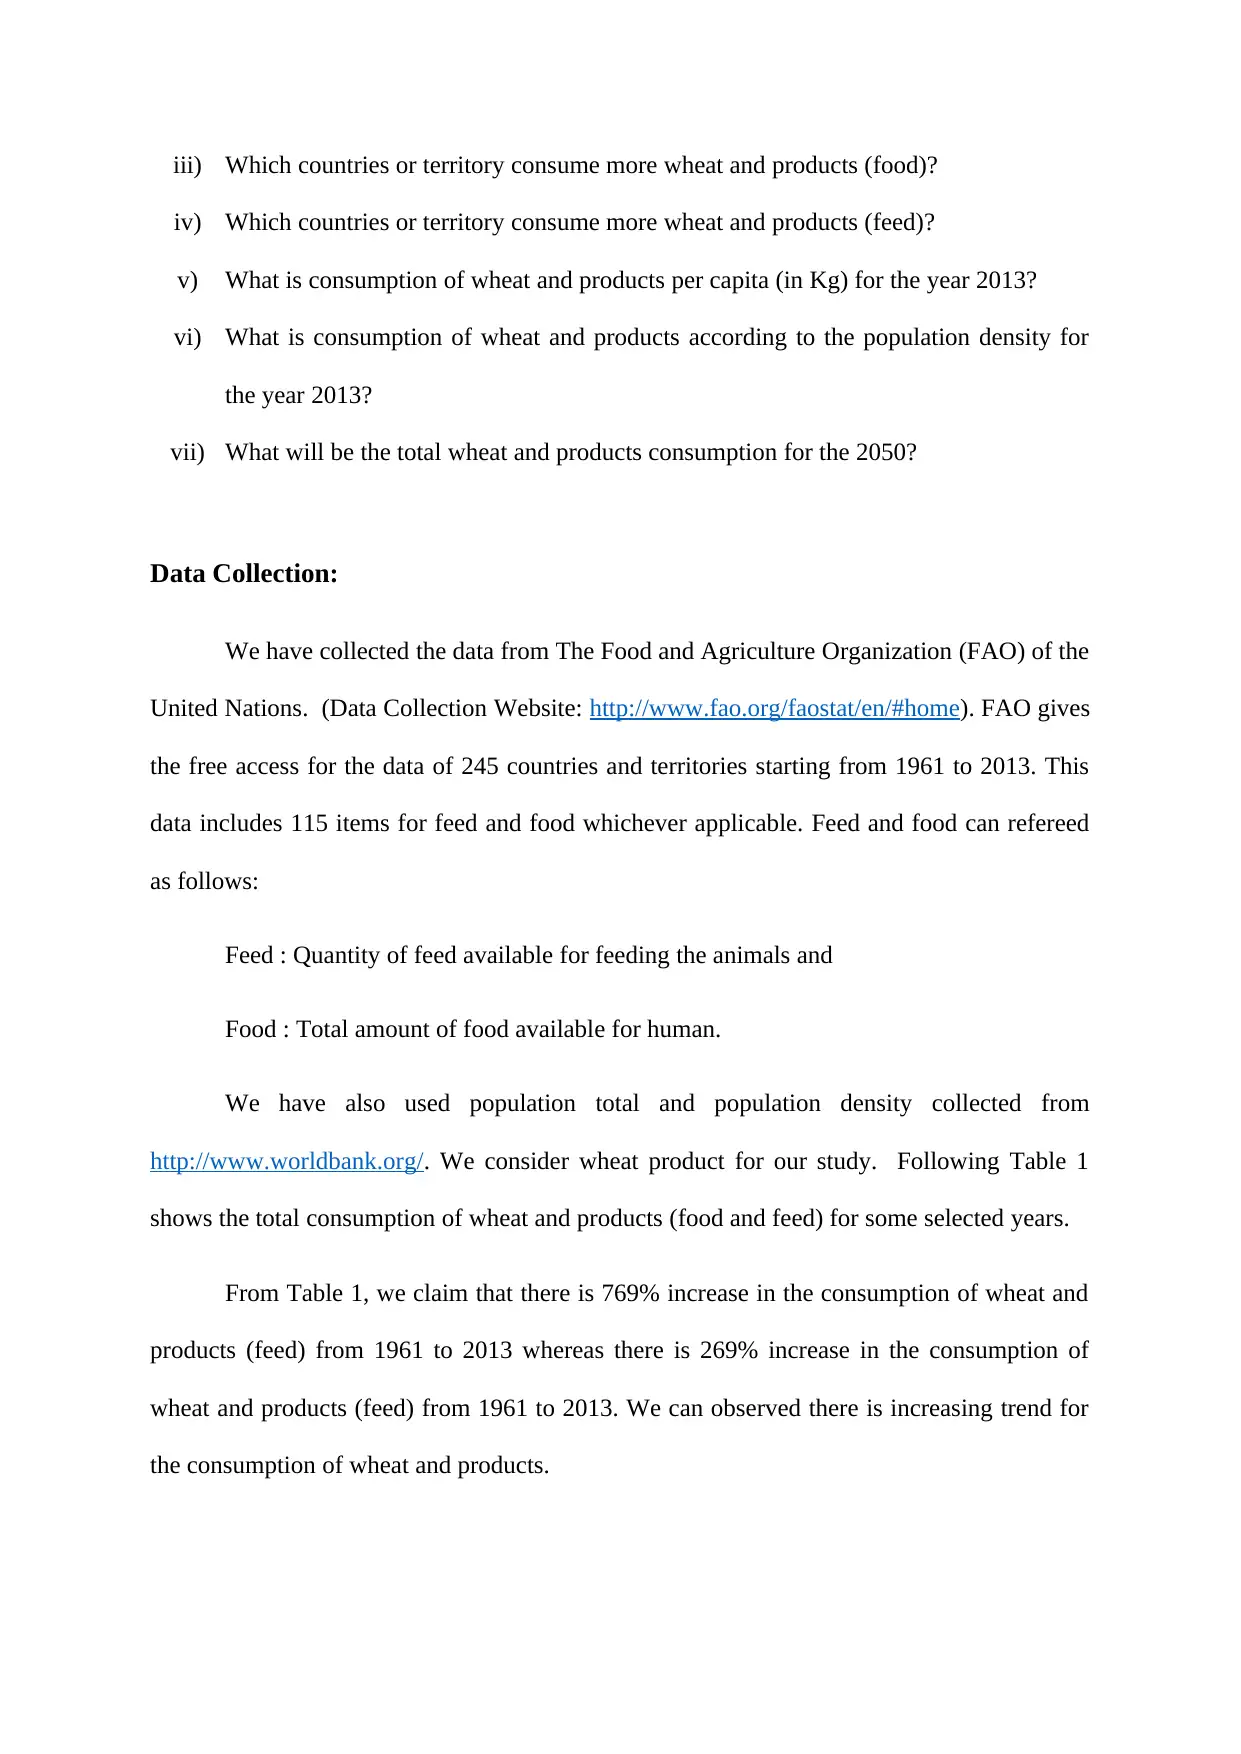
http://www.worldbank.org/. We consider wheat product for our study. Following Table 1
shows the total consumption of wheat and products (food and feed) for some selected years.
From Table 1, we claim that there is 769% increase in the consumption of wheat and
products (feed) from 1961 to 2013 whereas there is 269% increase in the consumption of
wheat and products (feed) from 1961 to 2013. We can observed there is increasing trend for
the consumption of wheat and products.
iv) Which countries or territory consume more wheat and products (feed)?
v) What is consumption of wheat and products per capita (in Kg) for the year 2013?
vi) What is consumption of wheat and products according to the population density for
the year 2013?
vii) What will be the total wheat and products consumption for the 2050?
Data Collection:
We have collected the data from The Food and Agriculture Organization (FAO) of the
United Nations. (Data Collection Website: http://www.fao.org/faostat/en/#home). FAO gives
the free access for the data of 245 countries and territories starting from 1961 to 2013. This
data includes 115 items for feed and food whichever applicable. Feed and food can refereed
as follows:
Feed : Quantity of feed available for feeding the animals and
Food : Total amount of food available for human.
We have also used population total and population density collected from
http://www.worldbank.org/. We consider wheat product for our study. Following Table 1
shows the total consumption of wheat and products (food and feed) for some selected years.
From Table 1, we claim that there is 769% increase in the consumption of wheat and
products (feed) from 1961 to 2013 whereas there is 269% increase in the consumption of
wheat and products (feed) from 1961 to 2013. We can observed there is increasing trend for
the consumption of wheat and products.
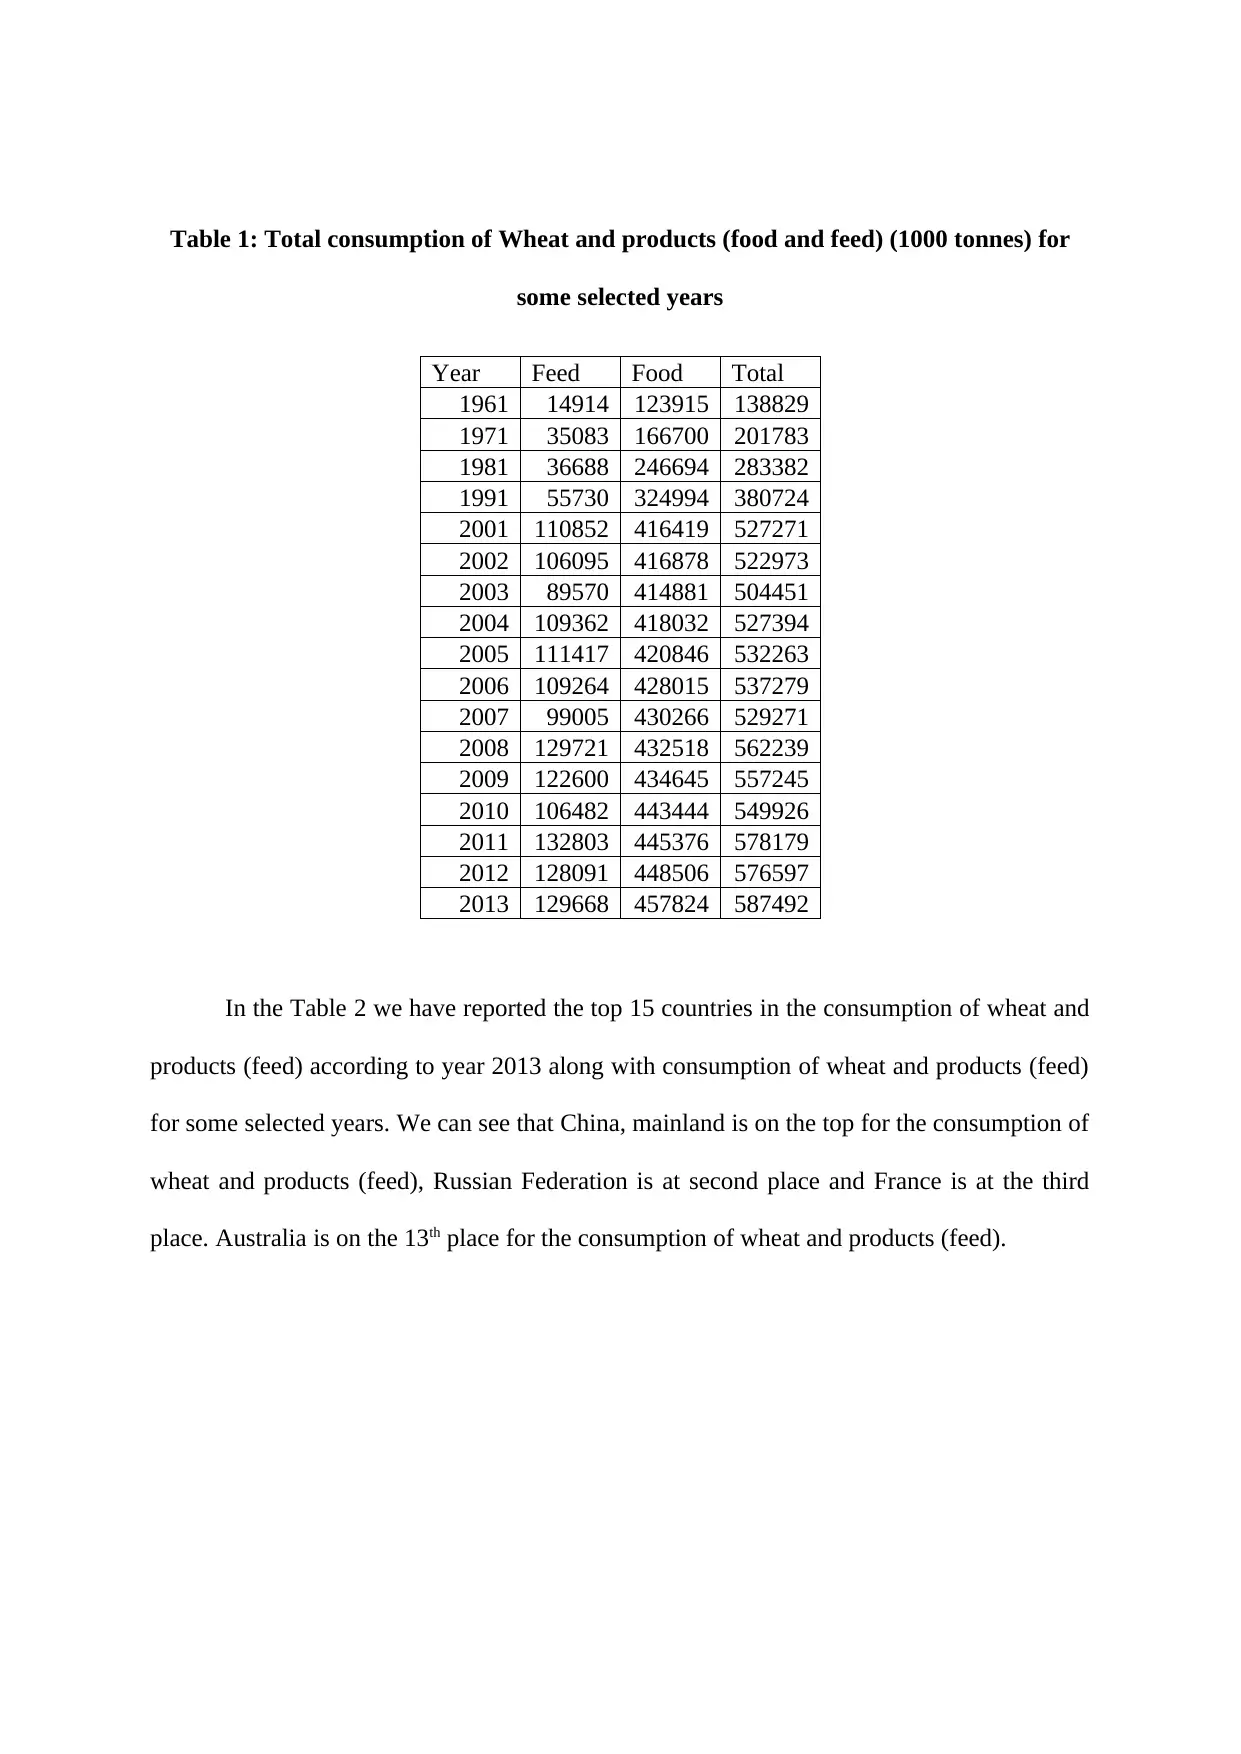
Table 1: Total consumption of Wheat and products (food and feed) (1000 tonnes) for
some selected years
Year Feed Food Total
1961 14914 123915 138829
1971 35083 166700 201783
1981 36688 246694 283382
1991 55730 324994 380724
2001 110852 416419 527271
2002 106095 416878 522973
2003 89570 414881 504451
2004 109362 418032 527394
2005 111417 420846 532263
2006 109264 428015 537279
2007 99005 430266 529271
2008 129721 432518 562239
2009 122600 434645 557245
2010 106482 443444 549926
2011 132803 445376 578179
2012 128091 448506 576597
2013 129668 457824 587492
In the Table 2 we have reported the top 15 countries in the consumption of wheat and
products (feed) according to year 2013 along with consumption of wheat and products (feed)
for some selected years. We can see that China, mainland is on the top for the consumption of
wheat and products (feed), Russian Federation is at second place and France is at the third
place. Australia is on the 13th place for the consumption of wheat and products (feed).
⊘ This is a preview!⊘
Do you want full access?
Subscribe today to unlock all pages.
Trusted by 1+ million students worldwide
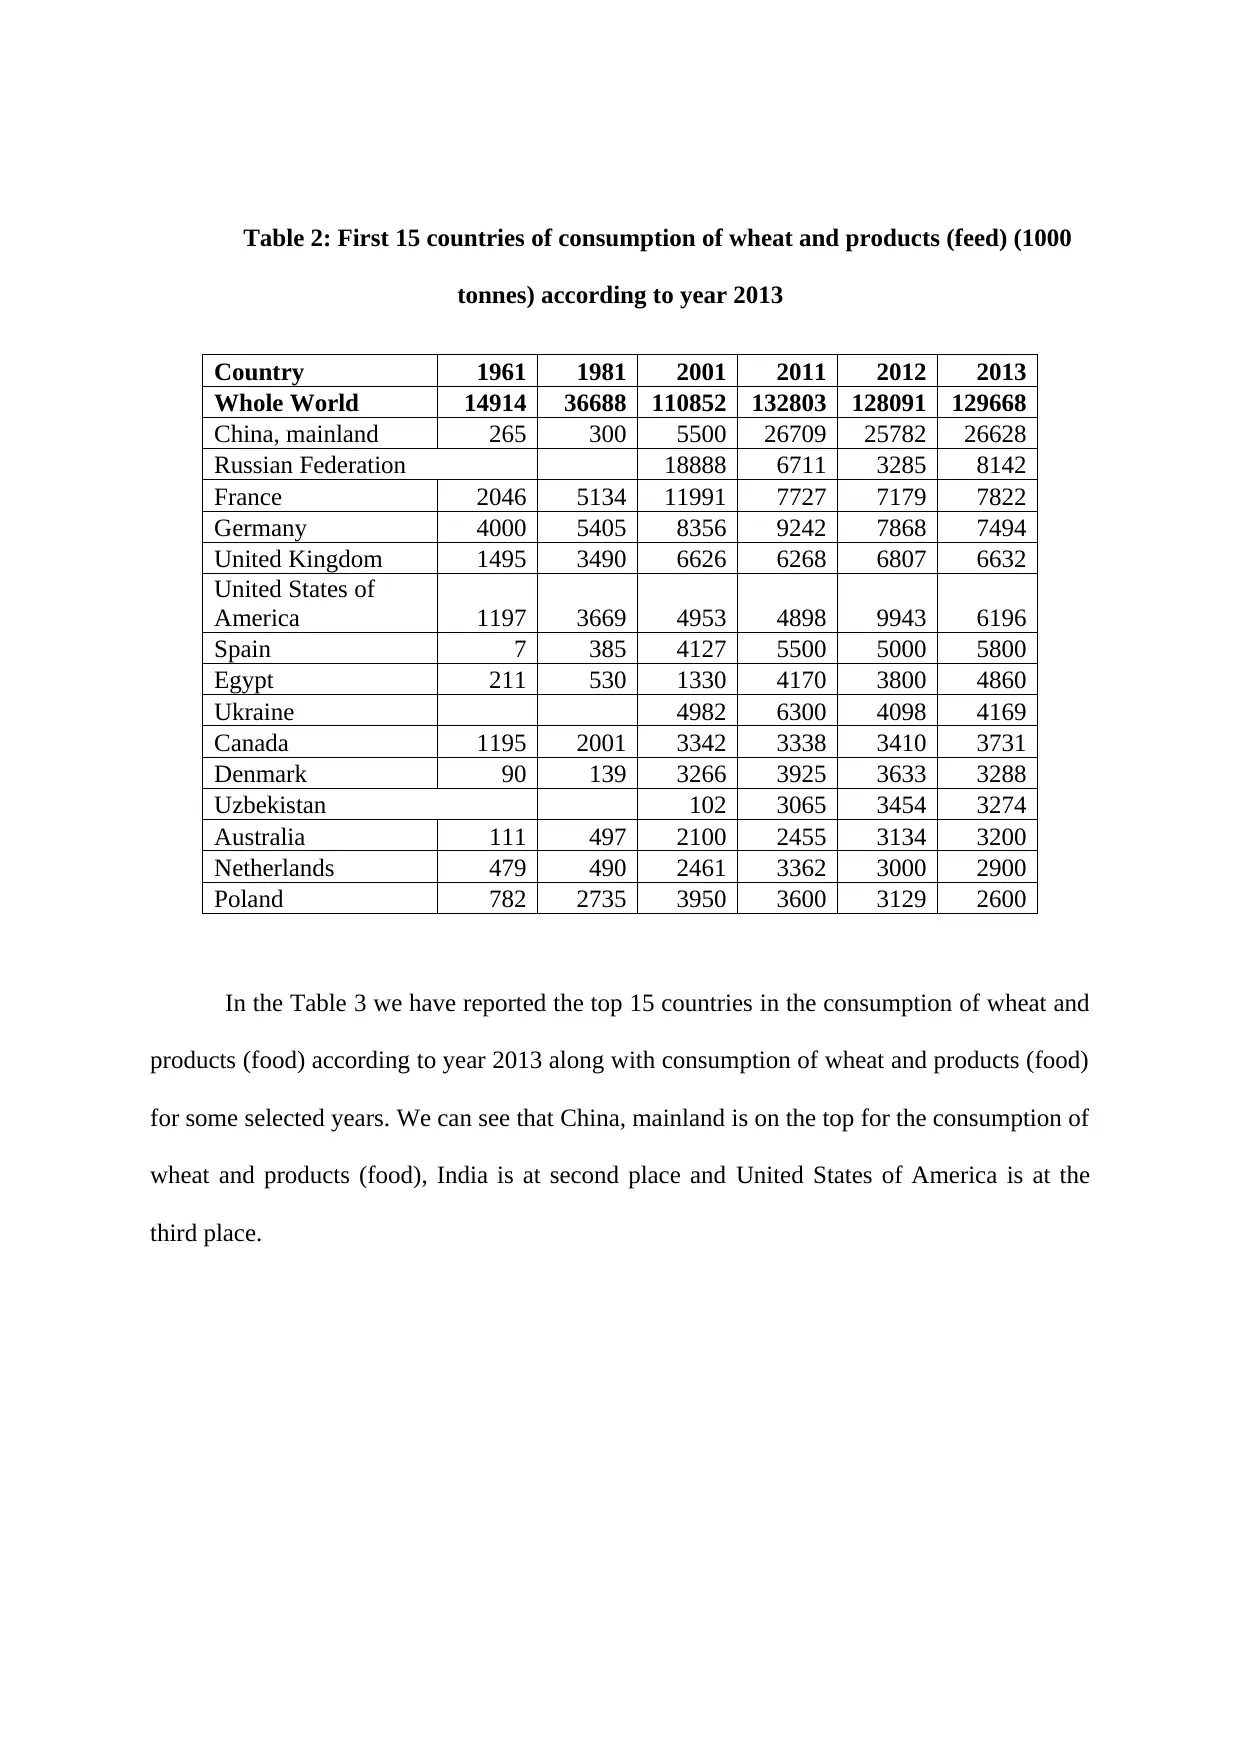
Table 2: First 15 countries of consumption of wheat and products (feed) (1000
tonnes) according to year 2013
Country 1961 1981 2001 2011 2012 2013
Whole World 14914 36688 110852 132803 128091 129668
China, mainland 265 300 5500 26709 25782 26628
Russian Federation 18888 6711 3285 8142
France 2046 5134 11991 7727 7179 7822
Germany 4000 5405 8356 9242 7868 7494
United Kingdom 1495 3490 6626 6268 6807 6632
United States of
America 1197 3669 4953 4898 9943 6196
Spain 7 385 4127 5500 5000 5800
Egypt 211 530 1330 4170 3800 4860
Ukraine 4982 6300 4098 4169
Canada 1195 2001 3342 3338 3410 3731
Denmark 90 139 3266 3925 3633 3288
Uzbekistan 102 3065 3454 3274
Australia 111 497 2100 2455 3134 3200
Netherlands 479 490 2461 3362 3000 2900
Poland 782 2735 3950 3600 3129 2600
In the Table 3 we have reported the top 15 countries in the consumption of wheat and
products (food) according to year 2013 along with consumption of wheat and products (food)
for some selected years. We can see that China, mainland is on the top for the consumption of
wheat and products (food), India is at second place and United States of America is at the
third place.
Paraphrase This Document
Need a fresh take? Get an instant paraphrase of this document with our AI Paraphraser
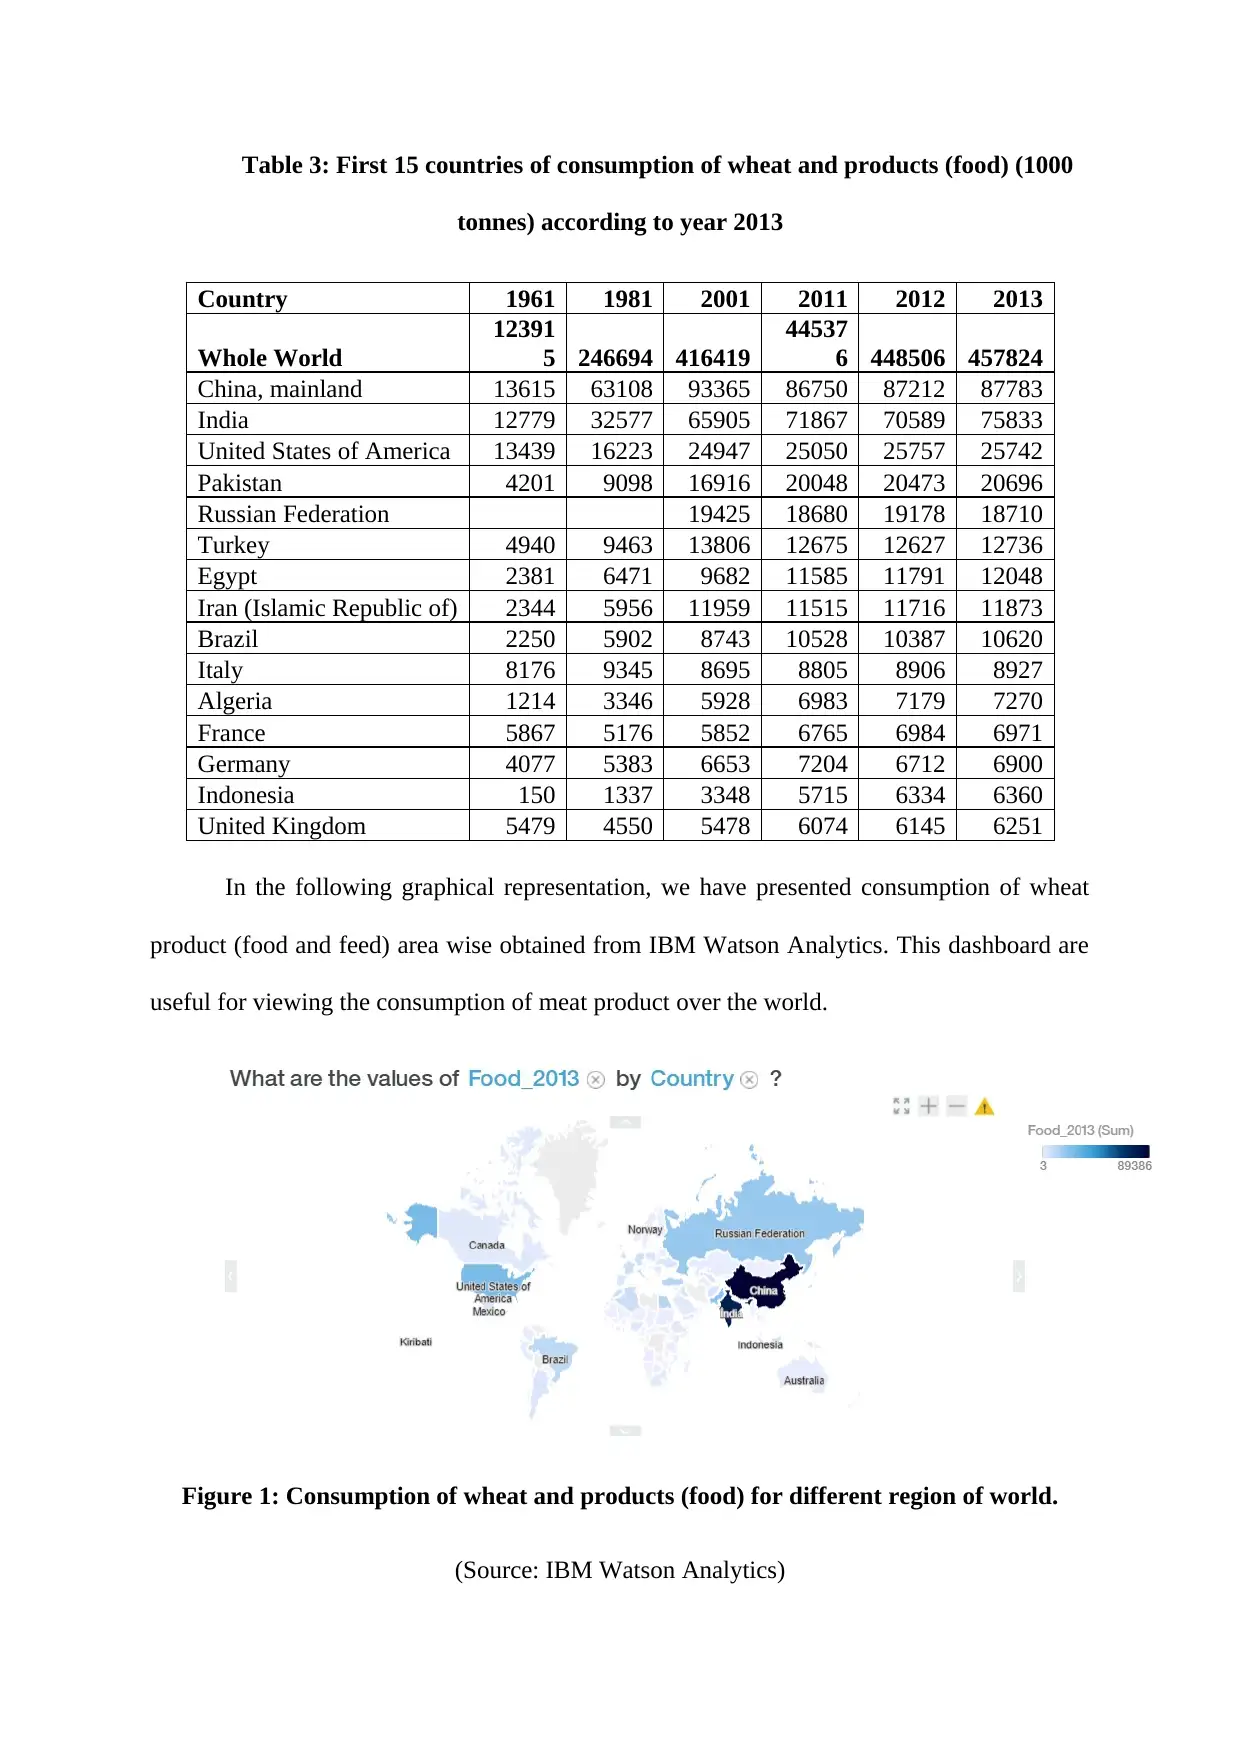
Table 3: First 15 countries of consumption of wheat and products (food) (1000
tonnes) according to year 2013
Country 1961 1981 2001 2011 2012 2013
Whole World
12391
5 246694 416419
44537
6 448506 457824
China, mainland 13615 63108 93365 86750 87212 87783
India 12779 32577 65905 71867 70589 75833
United States of America 13439 16223 24947 25050 25757 25742
Pakistan 4201 9098 16916 20048 20473 20696
Russian Federation 19425 18680 19178 18710
Turkey 4940 9463 13806 12675 12627 12736
Egypt 2381 6471 9682 11585 11791 12048
Iran (Islamic Republic of) 2344 5956 11959 11515 11716 11873
Brazil 2250 5902 8743 10528 10387 10620
Italy 8176 9345 8695 8805 8906 8927
Algeria 1214 3346 5928 6983 7179 7270
France 5867 5176 5852 6765 6984 6971
Germany 4077 5383 6653 7204 6712 6900
Indonesia 150 1337 3348 5715 6334 6360
United Kingdom 5479 4550 5478 6074 6145 6251
In the following graphical representation, we have presented consumption of wheat
product (food and feed) area wise obtained from IBM Watson Analytics. This dashboard are
useful for viewing the consumption of meat product over the world.
Figure 1: Consumption of wheat and products (food) for different region of world.
(Source: IBM Watson Analytics)
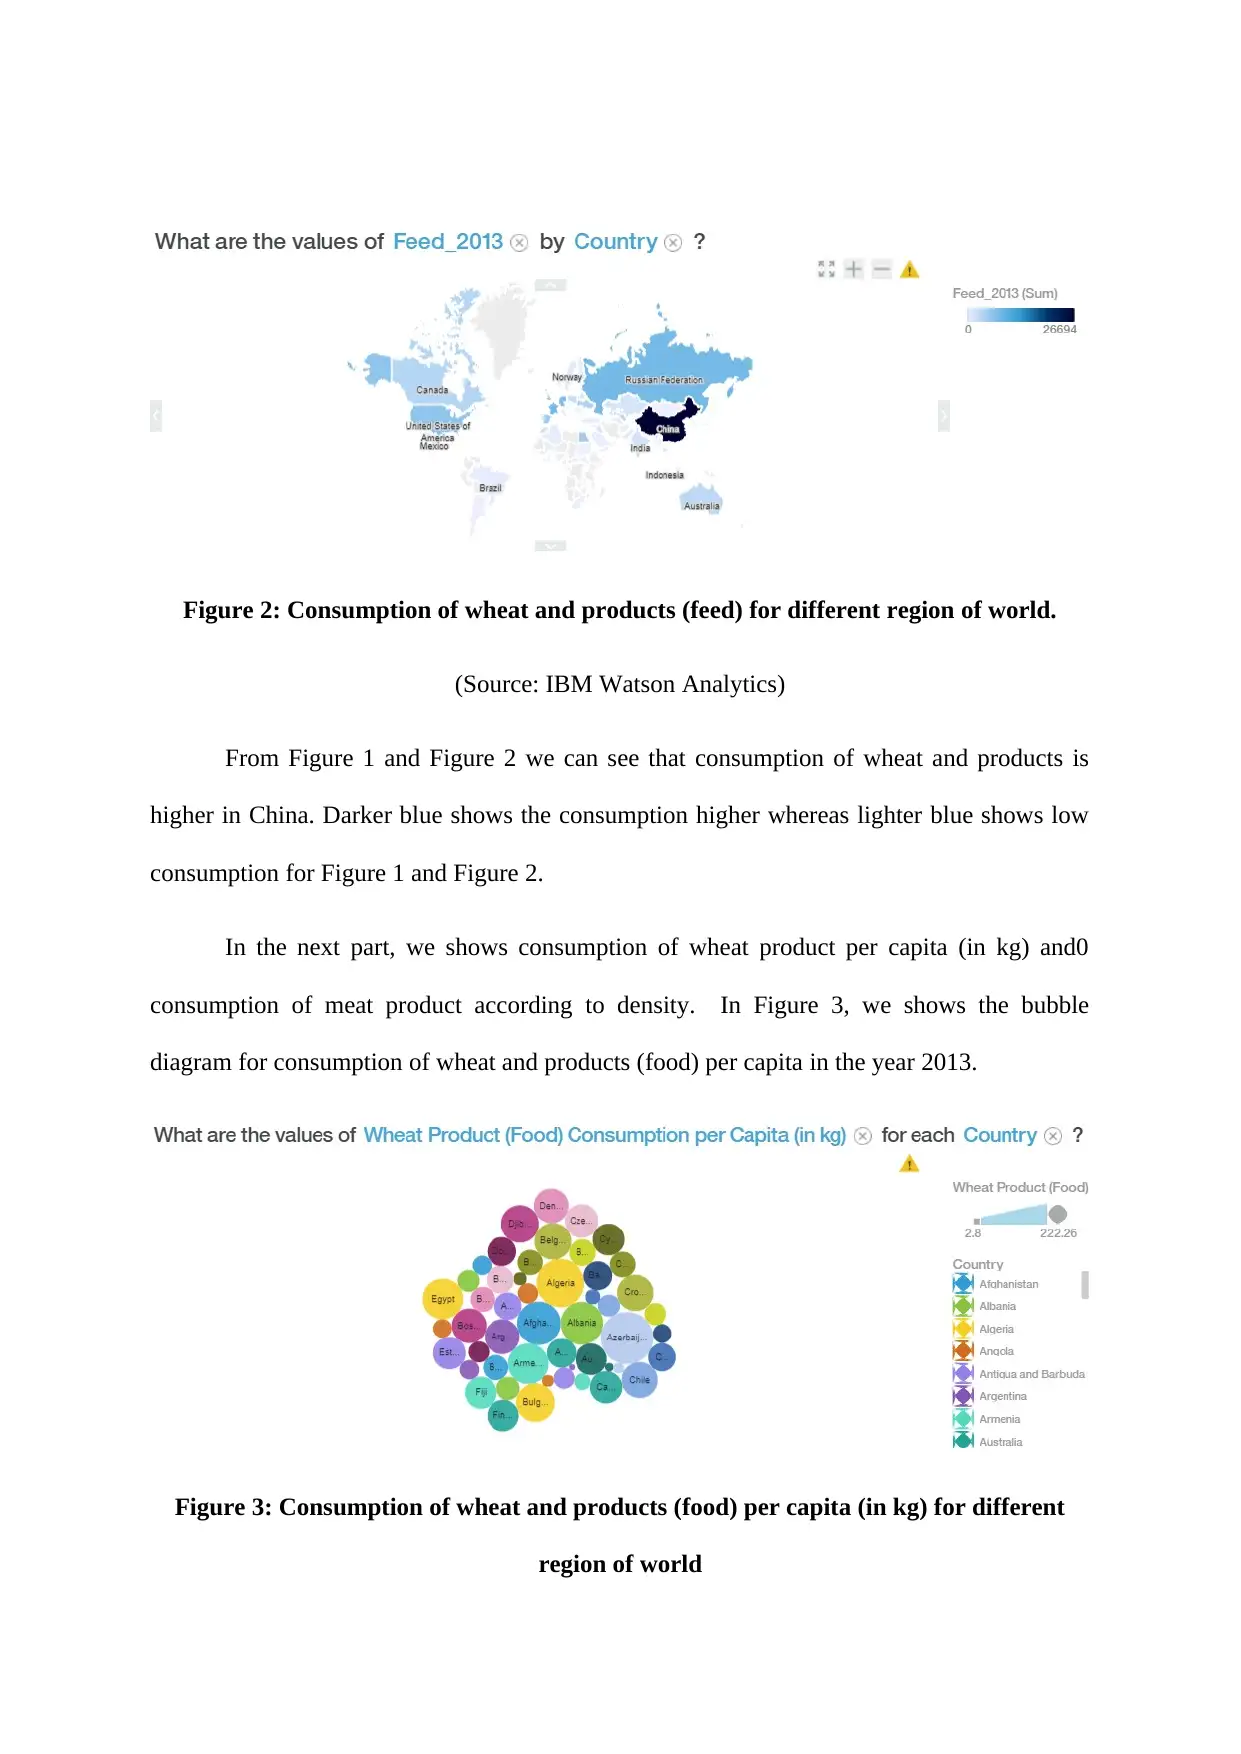
Figure 2: Consumption of wheat and products (feed) for different region of world.
(Source: IBM Watson Analytics)
From Figure 1 and Figure 2 we can see that consumption of wheat and products is
higher in China. Darker blue shows the consumption higher whereas lighter blue shows low
consumption for Figure 1 and Figure 2.
In the next part, we shows consumption of wheat product per capita (in kg) and0
consumption of meat product according to density. In Figure 3, we shows the bubble
diagram for consumption of wheat and products (food) per capita in the year 2013.
Figure 3: Consumption of wheat and products (food) per capita (in kg) for different
region of world
⊘ This is a preview!⊘
Do you want full access?
Subscribe today to unlock all pages.
Trusted by 1+ million students worldwide
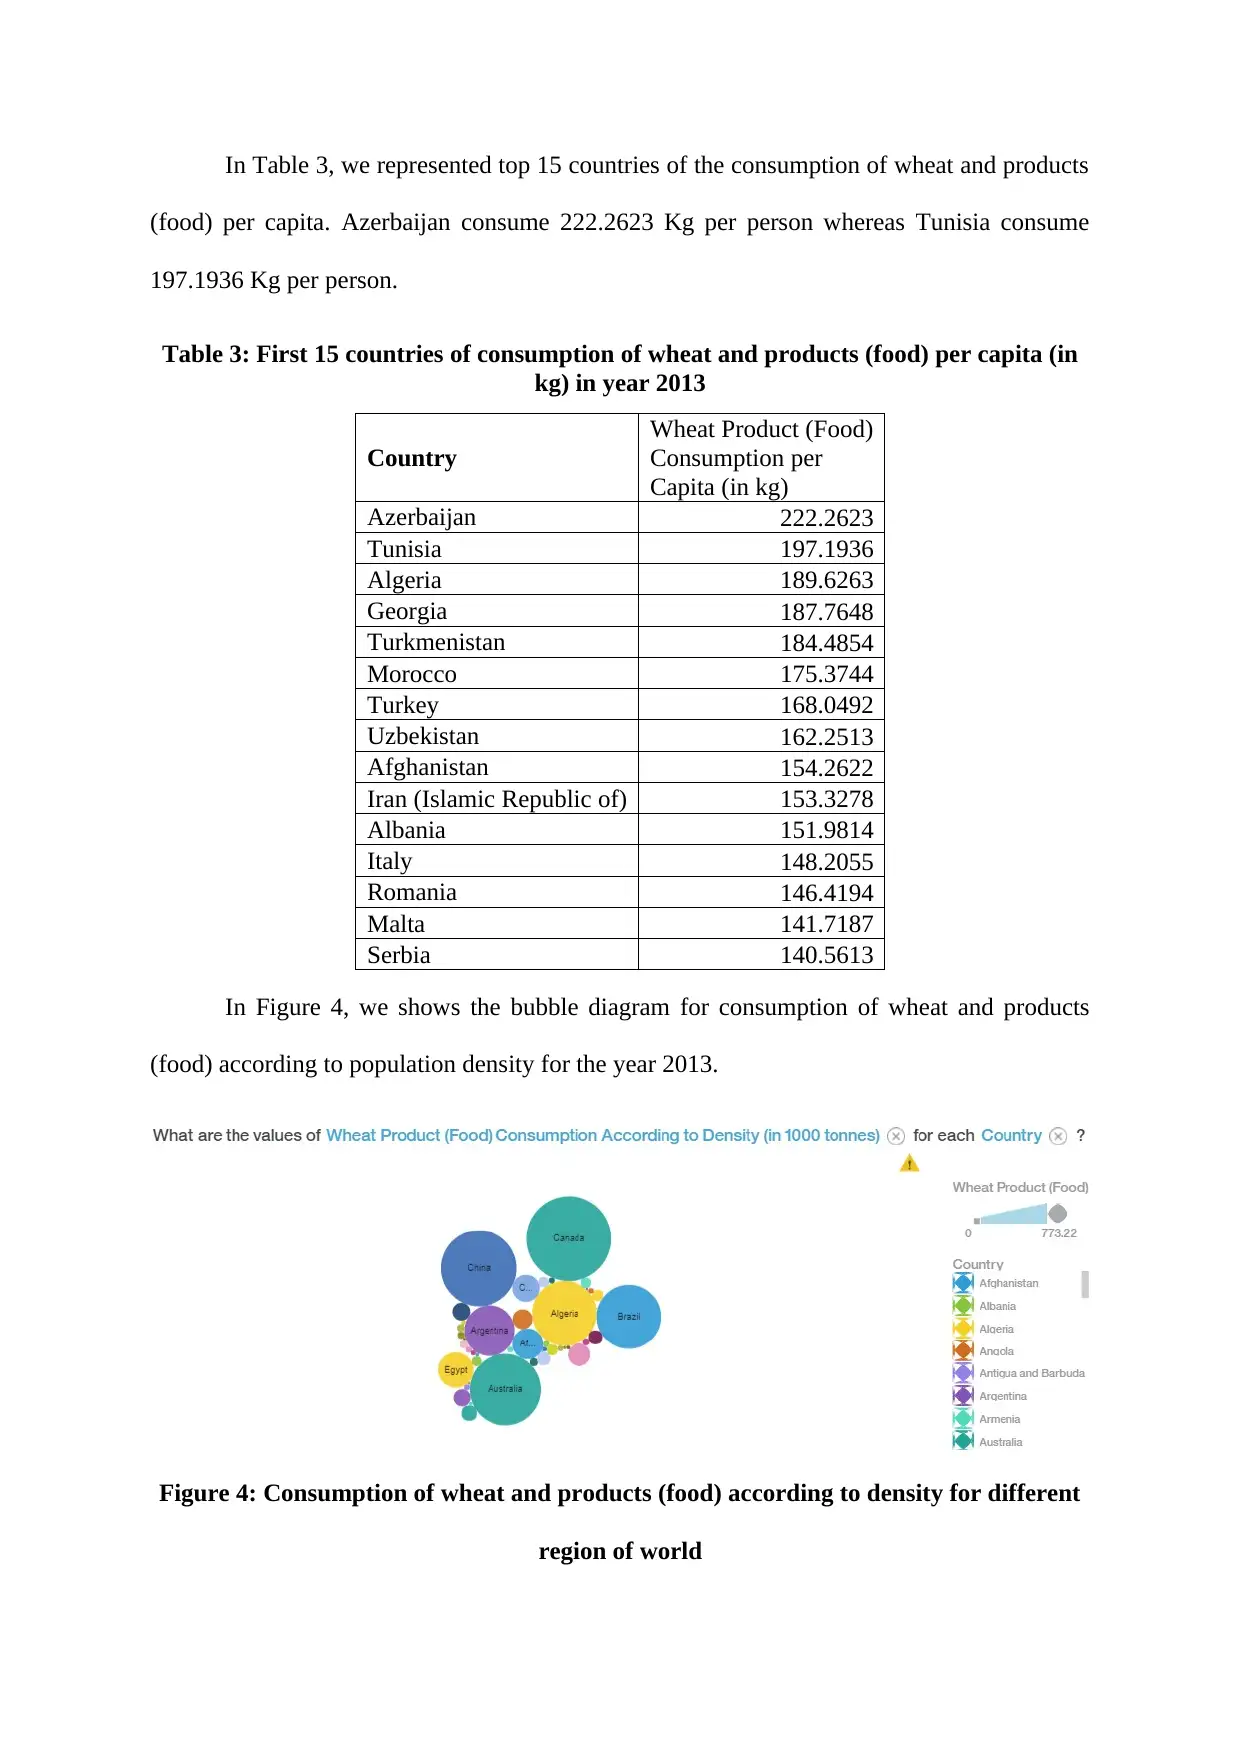
In Table 3, we represented top 15 countries of the consumption of wheat and products
(food) per capita. Azerbaijan consume 222.2623 Kg per person whereas Tunisia consume
197.1936 Kg per person.
Table 3: First 15 countries of consumption of wheat and products (food) per capita (in
kg) in year 2013
Country
Wheat Product (Food)
Consumption per
Capita (in kg)
Azerbaijan 222.2623
Tunisia 197.1936
Algeria 189.6263
Georgia 187.7648
Turkmenistan 184.4854
Morocco 175.3744
Turkey 168.0492
Uzbekistan 162.2513
Afghanistan 154.2622
Iran (Islamic Republic of) 153.3278
Albania 151.9814
Italy 148.2055
Romania 146.4194
Malta 141.7187
Serbia 140.5613
In Figure 4, we shows the bubble diagram for consumption of wheat and products
(food) according to population density for the year 2013.
Figure 4: Consumption of wheat and products (food) according to density for different
region of world
Paraphrase This Document
Need a fresh take? Get an instant paraphrase of this document with our AI Paraphraser
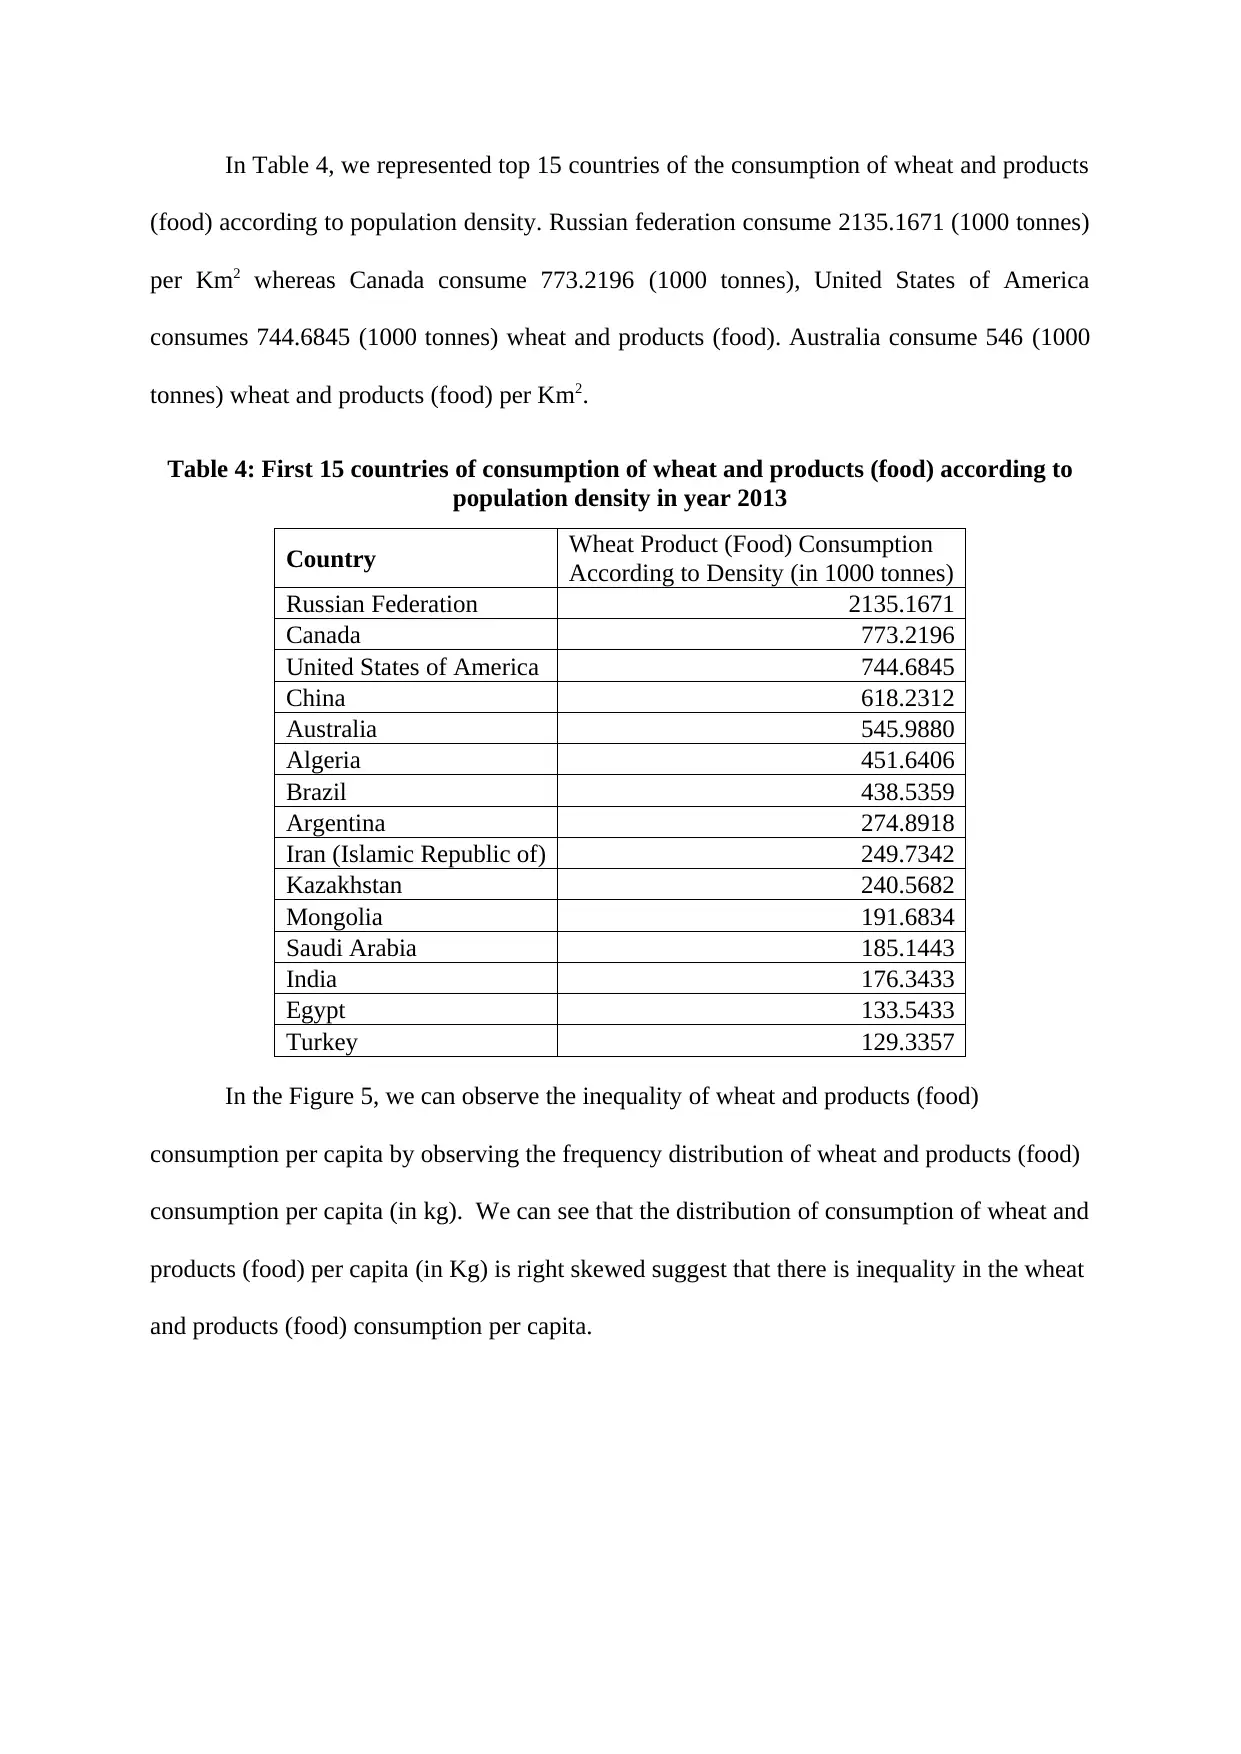
In Table 4, we represented top 15 countries of the consumption of wheat and products
(food) according to population density. Russian federation consume 2135.1671 (1000 tonnes)
per Km2 whereas Canada consume 773.2196 (1000 tonnes), United States of America
consumes 744.6845 (1000 tonnes) wheat and products (food). Australia consume 546 (1000
tonnes) wheat and products (food) per Km2.
Table 4: First 15 countries of consumption of wheat and products (food) according to
population density in year 2013
Country Wheat Product (Food) Consumption
According to Density (in 1000 tonnes)
Russian Federation 2135.1671
Canada 773.2196
United States of America 744.6845
China 618.2312
Australia 545.9880
Algeria 451.6406
Brazil 438.5359
Argentina 274.8918
Iran (Islamic Republic of) 249.7342
Kazakhstan 240.5682
Mongolia 191.6834
Saudi Arabia 185.1443
India 176.3433
Egypt 133.5433
Turkey 129.3357
In the Figure 5, we can observe the inequality of wheat and products (food)
consumption per capita by observing the frequency distribution of wheat and products (food)
consumption per capita (in kg). We can see that the distribution of consumption of wheat and
products (food) per capita (in Kg) is right skewed suggest that there is inequality in the wheat
and products (food) consumption per capita.
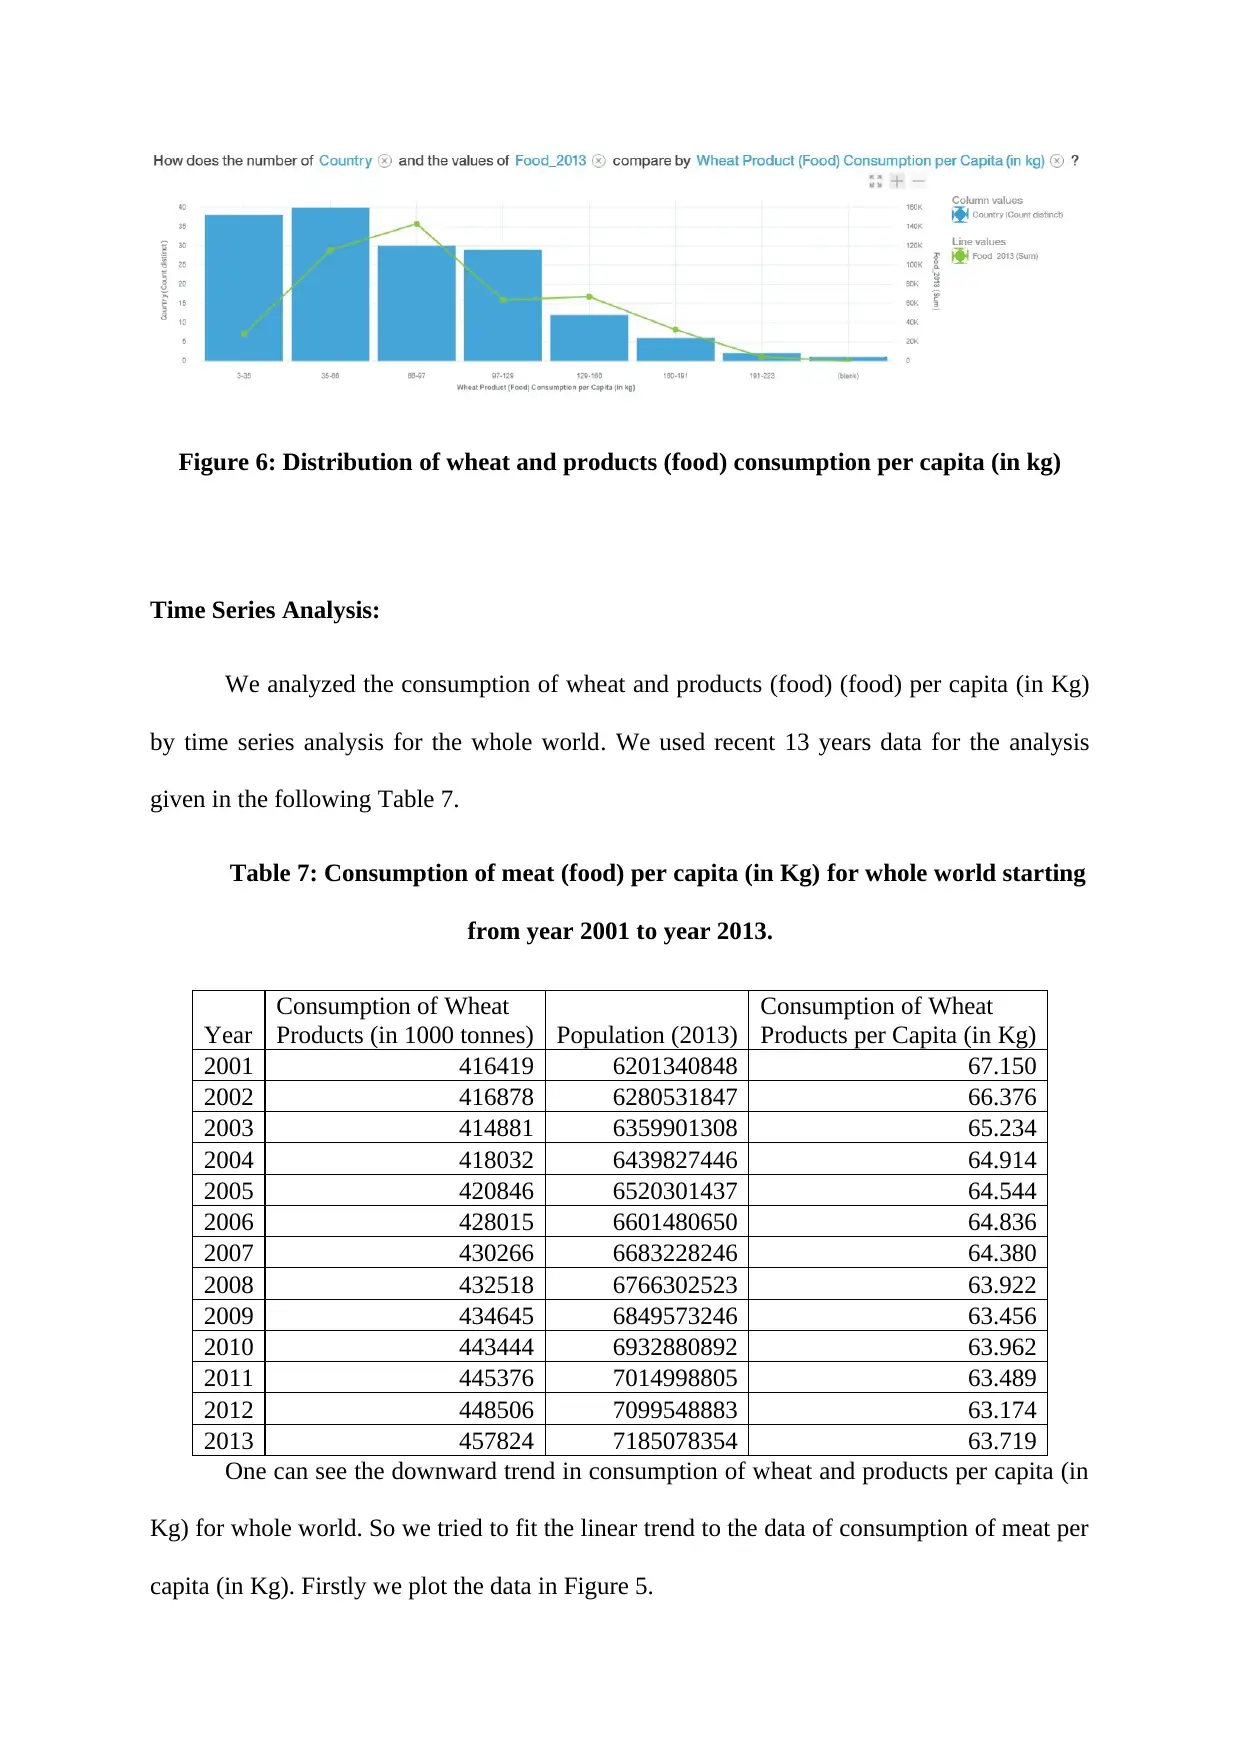
Figure 6: Distribution of wheat and products (food) consumption per capita (in kg)
Time Series Analysis:
We analyzed the consumption of wheat and products (food) (food) per capita (in Kg)
by time series analysis for the whole world. We used recent 13 years data for the analysis
given in the following Table 7.
Table 7: Consumption of meat (food) per capita (in Kg) for whole world starting
from year 2001 to year 2013.
Year
Consumption of Wheat
Products (in 1000 tonnes) Population (2013)
Consumption of Wheat
Products per Capita (in Kg)
2001 416419 6201340848 67.150
2002 416878 6280531847 66.376
2003 414881 6359901308 65.234
2004 418032 6439827446 64.914
2005 420846 6520301437 64.544
2006 428015 6601480650 64.836
2007 430266 6683228246 64.380
2008 432518 6766302523 63.922
2009 434645 6849573246 63.456
2010 443444 6932880892 63.962
2011 445376 7014998805 63.489
2012 448506 7099548883 63.174
2013 457824 7185078354 63.719
One can see the downward trend in consumption of wheat and products per capita (in
Kg) for whole world. So we tried to fit the linear trend to the data of consumption of meat per
capita (in Kg). Firstly we plot the data in Figure 5.
⊘ This is a preview!⊘
Do you want full access?
Subscribe today to unlock all pages.
Trusted by 1+ million students worldwide
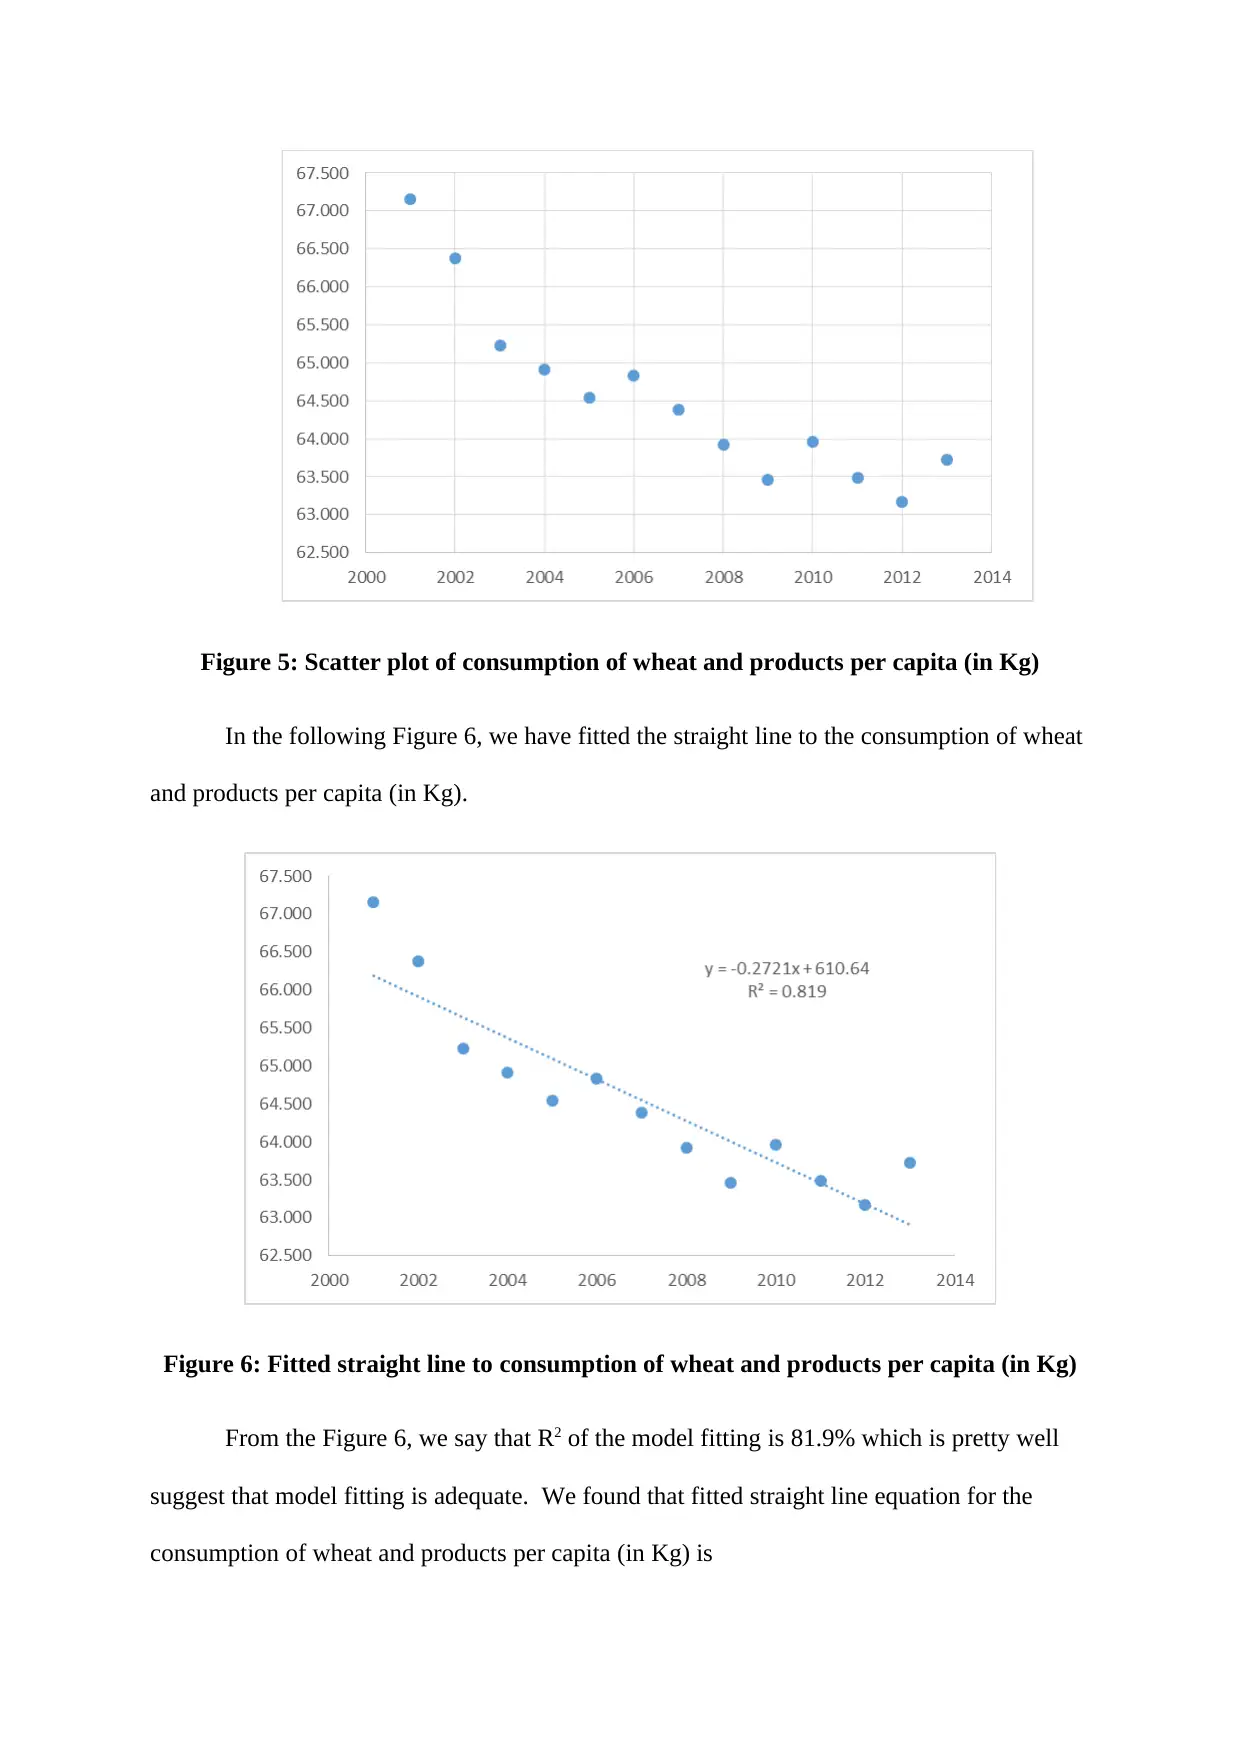
Figure 5: Scatter plot of consumption of wheat and products per capita (in Kg)
In the following Figure 6, we have fitted the straight line to the consumption of wheat
and products per capita (in Kg).
Figure 6: Fitted straight line to consumption of wheat and products per capita (in Kg)
From the Figure 6, we say that R2 of the model fitting is 81.9% which is pretty well
suggest that model fitting is adequate. We found that fitted straight line equation for the
consumption of wheat and products per capita (in Kg) is
Paraphrase This Document
Need a fresh take? Get an instant paraphrase of this document with our AI Paraphraser
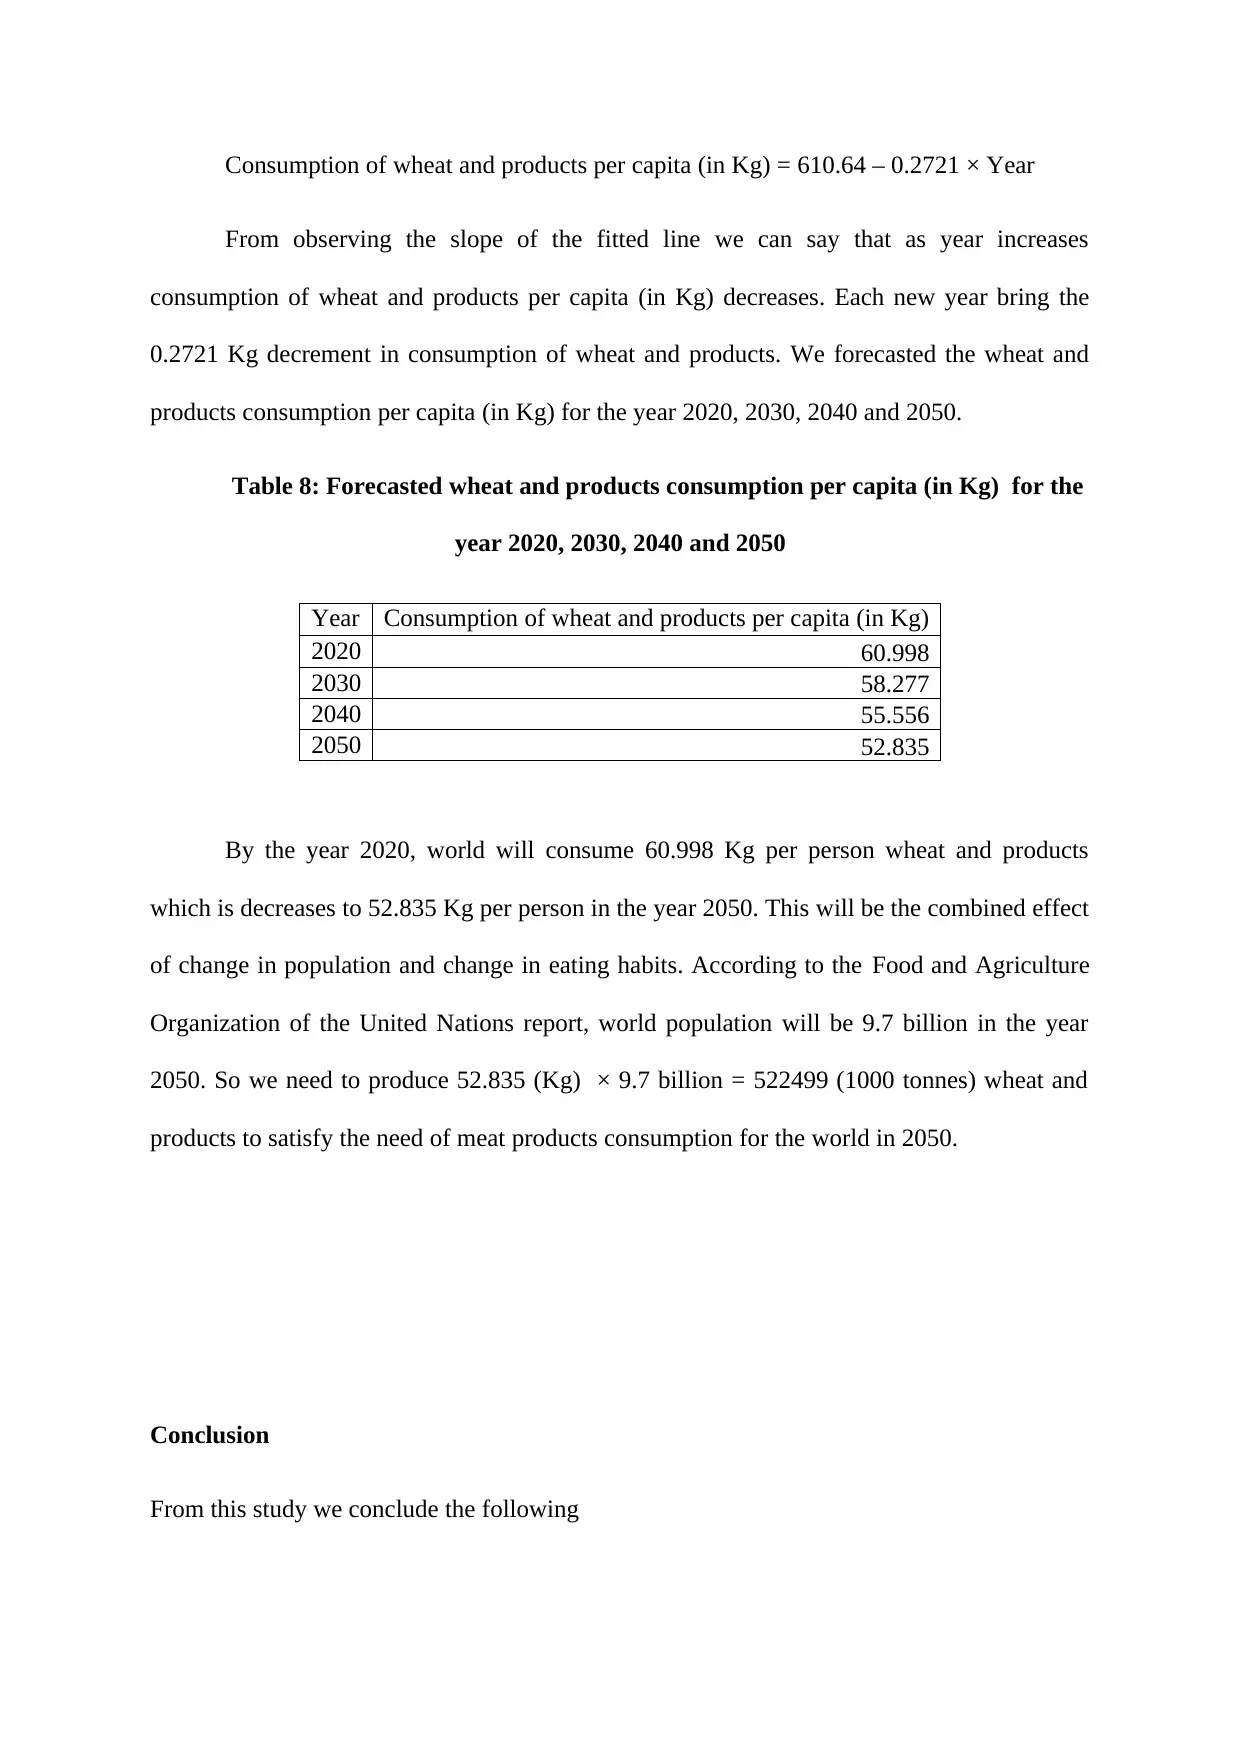
Consumption of wheat and products per capita (in Kg) = 610.64 – 0.2721 × Year
From observing the slope of the fitted line we can say that as year increases
consumption of wheat and products per capita (in Kg) decreases. Each new year bring the
0.2721 Kg decrement in consumption of wheat and products. We forecasted the wheat and
products consumption per capita (in Kg) for the year 2020, 2030, 2040 and 2050.
Table 8: Forecasted wheat and products consumption per capita (in Kg) for the
year 2020, 2030, 2040 and 2050
Year Consumption of wheat and products per capita (in Kg)
2020 60.998
2030 58.277
2040 55.556
2050 52.835
By the year 2020, world will consume 60.998 Kg per person wheat and products
which is decreases to 52.835 Kg per person in the year 2050. This will be the combined effect
of change in population and change in eating habits. According to the Food and Agriculture
Organization of the United Nations report, world population will be 9.7 billion in the year
2050. So we need to produce 52.835 (Kg) × 9.7 billion = 522499 (1000 tonnes) wheat and
products to satisfy the need of meat products consumption for the world in 2050.
Conclusion
From this study we conclude the following
i) We claim that there is 769% increase in the consumption of wheat and products (feed)
from 1961 to 2013 whereas there is 269% increase in the consumption of wheat and
products (feed) from 1961 to 2013. We can observed there is increasing trend for the
consumption of wheat and products.
ii) We observed that China, mainland is on the top for the consumption of wheat and
products (feed), Russian Federation is at second place and France is at the third place.
Australia is on the 13th place for the consumption of wheat and products (feed).
iii) We can see that China, mainland is on the top for the consumption of wheat and
products (food), India is at second place and United States of America is at the third
place.
iv) Azerbaijan consume 222.2623 Kg per person whereas Tunisia consume 197.1936 Kg
per person.
v) Russian federation consume 2135.1671 (1000 tonnes) per Km2 whereas Canada
consume 773.2196 (1000 tonnes), United States of America consumes 744.6845
(1000 tonnes) wheat and products (food). Australia consume 546 (1000 tonnes) wheat
and products (food) per Km2.
vi) We can see that the distribution of consumption of wheat and products (food) per
capita (in Kg) is right skewed suggest that there is inequality in the wheat and
products (food) consumption per capita.
vii) By the year 2020, world will consume 60.998 Kg per person wheat and products
which is decreases to 52.835 Kg per person in the year 2050. This will be the
combined effect of change in population and change in eating habits. According to the
Food and Agriculture Organization of the United Nations report, world population
will be 9.7 billion in the year 2050. So we need to produce 52.835 (Kg) × 9.7 billion
⊘ This is a preview!⊘
Do you want full access?
Subscribe today to unlock all pages.
Trusted by 1+ million students worldwide
1 out of 18
Related Documents


Your All-in-One AI-Powered Toolkit for Academic Success.
+13062052269
info@desklib.com
Available 24*7 on WhatsApp / Email
![[object Object]](/_next/static/media/star-bottom.7253800d.svg)
Unlock your academic potential
Copyright © 2020–2026 A2Z Services. All Rights Reserved. Developed and managed by ZUCOL.