Goal Orientation and Impulsivity: A Psychometric Report Analysis
VerifiedAdded on 2022/12/22
|14
|2894
|86
Report
AI Summary
This report presents a psychometric analysis of goal orientation and its correlation with impulsivity. The study utilized questionnaires administered to 5 students initially, with data from 180 participants harmonized and analyzed using SPSS software. The report includes a literature review on goal orientation, exploring its definition, models, and significance in setting targets and enhancing performance. The methodology section details the research design, participants, materials, and collection procedure, including the use of Likert scales and measures of validity. The results section reveals demographic data, reliability analysis (Cronbach's Alpha of 0.455), and item-total statistics. The validity of the goal orientation measure was assessed through correlation with an overall impulsivity scale, involving principal component analysis for data reduction. The analysis revealed correlations among the variables, with the results presented in SPSS outputs. The report concludes with a discussion of the findings, appendices containing SPSS outputs, and a list of references. The report also highlights the importance of goal orientation in setting targets, daily planning, and overall optimism.
Abstract
The report aims at describing the scales and items used in goal orientation and their validation
using impulsive scale correlation. The data was collected ethically from 5 students using
questionnaires and 180 participants’ data was harmonized and analyzed using SPSS analytic
software. The results obtained were as follows: On the gender 82.78% were male, 13.89% were
female and 3.33% had their gender information missing, on age the age group aged between 18-
21 years were 30.56%, aged between 22-29 years were 25.56%, aged between 30-39 years were
22.22%, aged over 40 years were 20.00% and 1.67% were missing their ages, reliability analysis
we had a Cronbach's Alpha of 0.455, The items total table shows the figure the Cronbach's Alpha
would have been if the specific item would have been removed from the analysis. From the
analysis table we can observe that all the Cronbach's Alpha if item deleted was nearly close for
all the items hence it would significantly important that we say that almost all item individual
removal could give in a slightly smaller Cronbach's Alpha. Only eelive3 that have had the largest
Cronbach's Alpha if item deleted value at .478 would only have resulted in a better and bigger
Cronbach's Alpha value
1
Paraphrase This Document
Need a fresh take? Get an instant paraphrase of this document with our AI Paraphraser
Table of Contents
Abstract...................................................................................................................................................1
Introduction.............................................................................................................................................3
Literature review.....................................................................................................................................3
Likert scale...............................................................................................................................................4
Validity measures....................................................................................................................................4
Methods......................................................................................................................................................6
Research design.......................................................................................................................................6
Participants..............................................................................................................................................6
Materials used.........................................................................................................................................6
Collection procedure...............................................................................................................................6
Data collection assumption.....................................................................................................................6
Results and discussion.................................................................................................................................7
Appendices..................................................................................................................................................8
SPSS OUTPUTS.........................................................................................................................................8
First Output.............................................................................................................................................8
Second Output.........................................................................................................................................9
Appropriate totals...................................................................................................................................9
Third Output..........................................................................................................................................10
Validity...................................................................................................................................................10
Validity of the goal orientation measure by its correlation with the overall impulsive scale............10
Fourth Output........................................................................................................................................12
LIST OF REFERENCE....................................................................................................................................14
2
Introduction
The term goal orientation is defined as a person’s ability and willingness to set target standards
and demonstration of character and desire to achieve the set target through set means. It is for the
need of goal orientation that sets the basis of Psychometric test which are used to measure
persons mental abilities and behaviors. This study is set to examine goal orientation through
Psychometric tests among 180 participants. The report includes the literature review, methods,
results, appendices and the list of reference.
Literature review
The concept of goal orientation has been a topic of that has attracted interest among scholars
from all over the world. The researchers focused on the analysis models, categories, new task
and how generally the concept of goal orientation was assumed by the masses. According to Van
de Pol and Kavussanu 2011 they defined goal orientation as task and target orientation being set
for purposes such as enjoyment and for self-actualization and gratification, Roberts 2012
suggested that goal orientation had much association with a person’s ego than the need of being
task oriented. Goal orientation is important as it enables individual set their work or activities
targets or aim of the work. Jones et al 2009 argued that goal orientation is much significant in
increasing performance of individuals who set and observe the set goals. The model used in
setting Psychometric test to test goal orientation are varied, majority of the scholars argue that
using of the likert scale is the best way of examining the Psychometric test. According to Moneta
2012 and Rheinberg 2008 orthogonal model are the best models in examining goal orientation,
while Decoster et al 2009, Sourial et al 2009, Doey and Kurta 2011 and Garson 2012 all argue
that correspondence analysis between scales and variables is the most significant way of
demonstrating the correlations and their validation to the performance.
3
⊘ This is a preview!⊘
Do you want full access?
Subscribe today to unlock all pages.
Trusted by 1+ million students worldwide
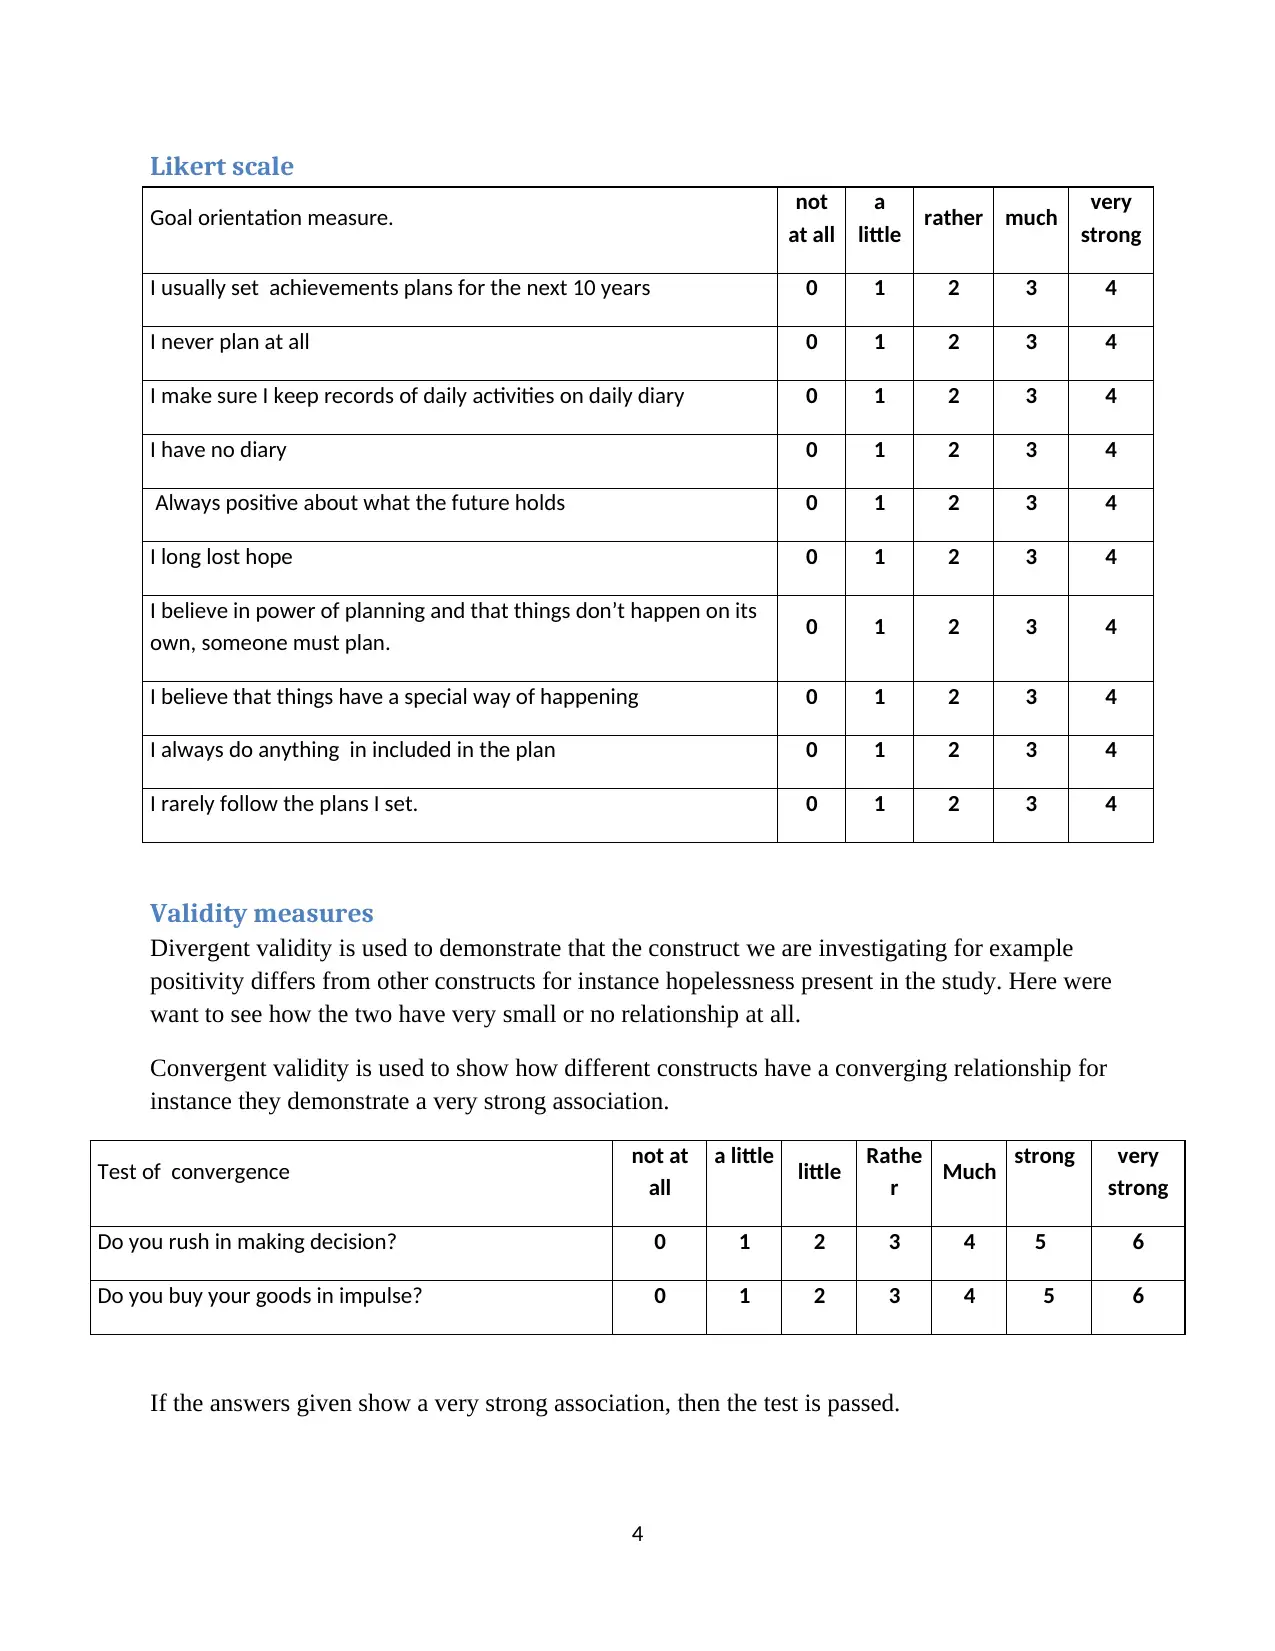
Likert scale
Goal orientation measure. not
at all
a
little rather much very
strong
I usually set achievements plans for the next 10 years 0 1 2 3 4
I never plan at all 0 1 2 3 4
I make sure I keep records of daily activities on daily diary 0 1 2 3 4
I have no diary 0 1 2 3 4
Always positive about what the future holds 0 1 2 3 4
I long lost hope 0 1 2 3 4
I believe in power of planning and that things don’t happen on its
own, someone must plan. 0 1 2 3 4
I believe that things have a special way of happening 0 1 2 3 4
I always do anything in included in the plan 0 1 2 3 4
I rarely follow the plans I set. 0 1 2 3 4
Validity measures
Divergent validity is used to demonstrate that the construct we are investigating for example
positivity differs from other constructs for instance hopelessness present in the study. Here were
want to see how the two have very small or no relationship at all.
Convergent validity is used to show how different constructs have a converging relationship for
instance they demonstrate a very strong association.
Test of convergence not at
all
a little little Rathe
r Much strong very
strong
Do you rush in making decision? 0 1 2 3 4 5 6
Do you buy your goods in impulse? 0 1 2 3 4 5 6
If the answers given show a very strong association, then the test is passed.
4
Paraphrase This Document
Need a fresh take? Get an instant paraphrase of this document with our AI Paraphraser
Test of divergence not at
all
a little little Rathe
r Much strong very
strong
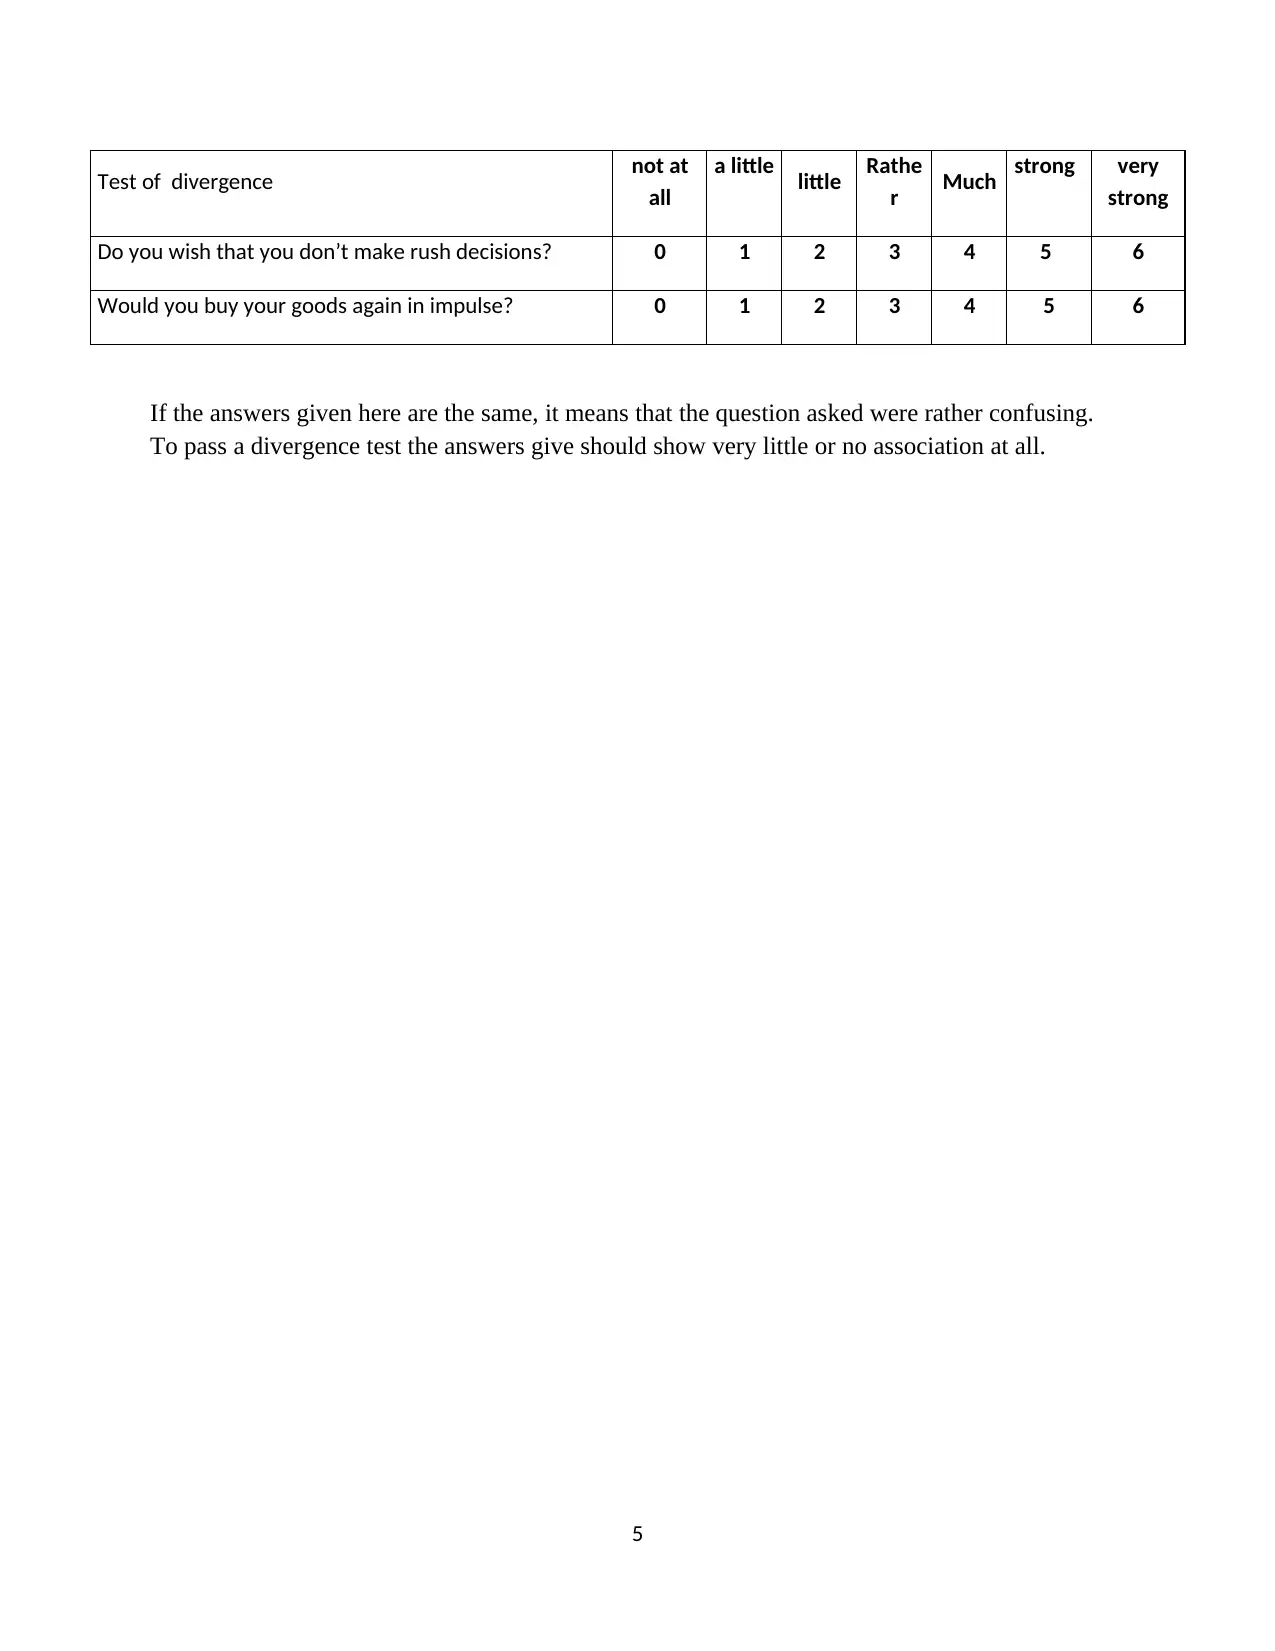
Do you wish that you don’t make rush decisions? 0 1 2 3 4 5 6
Would you buy your goods again in impulse? 0 1 2 3 4 5 6
If the answers given here are the same, it means that the question asked were rather confusing.
To pass a divergence test the answers give should show very little or no association at all.
5
all
a little little Rathe
r Much strong very
strong
Do you wish that you don’t make rush decisions? 0 1 2 3 4 5 6
Would you buy your goods again in impulse? 0 1 2 3 4 5 6
If the answers given here are the same, it means that the question asked were rather confusing.
To pass a divergence test the answers give should show very little or no association at all.
5
Methods
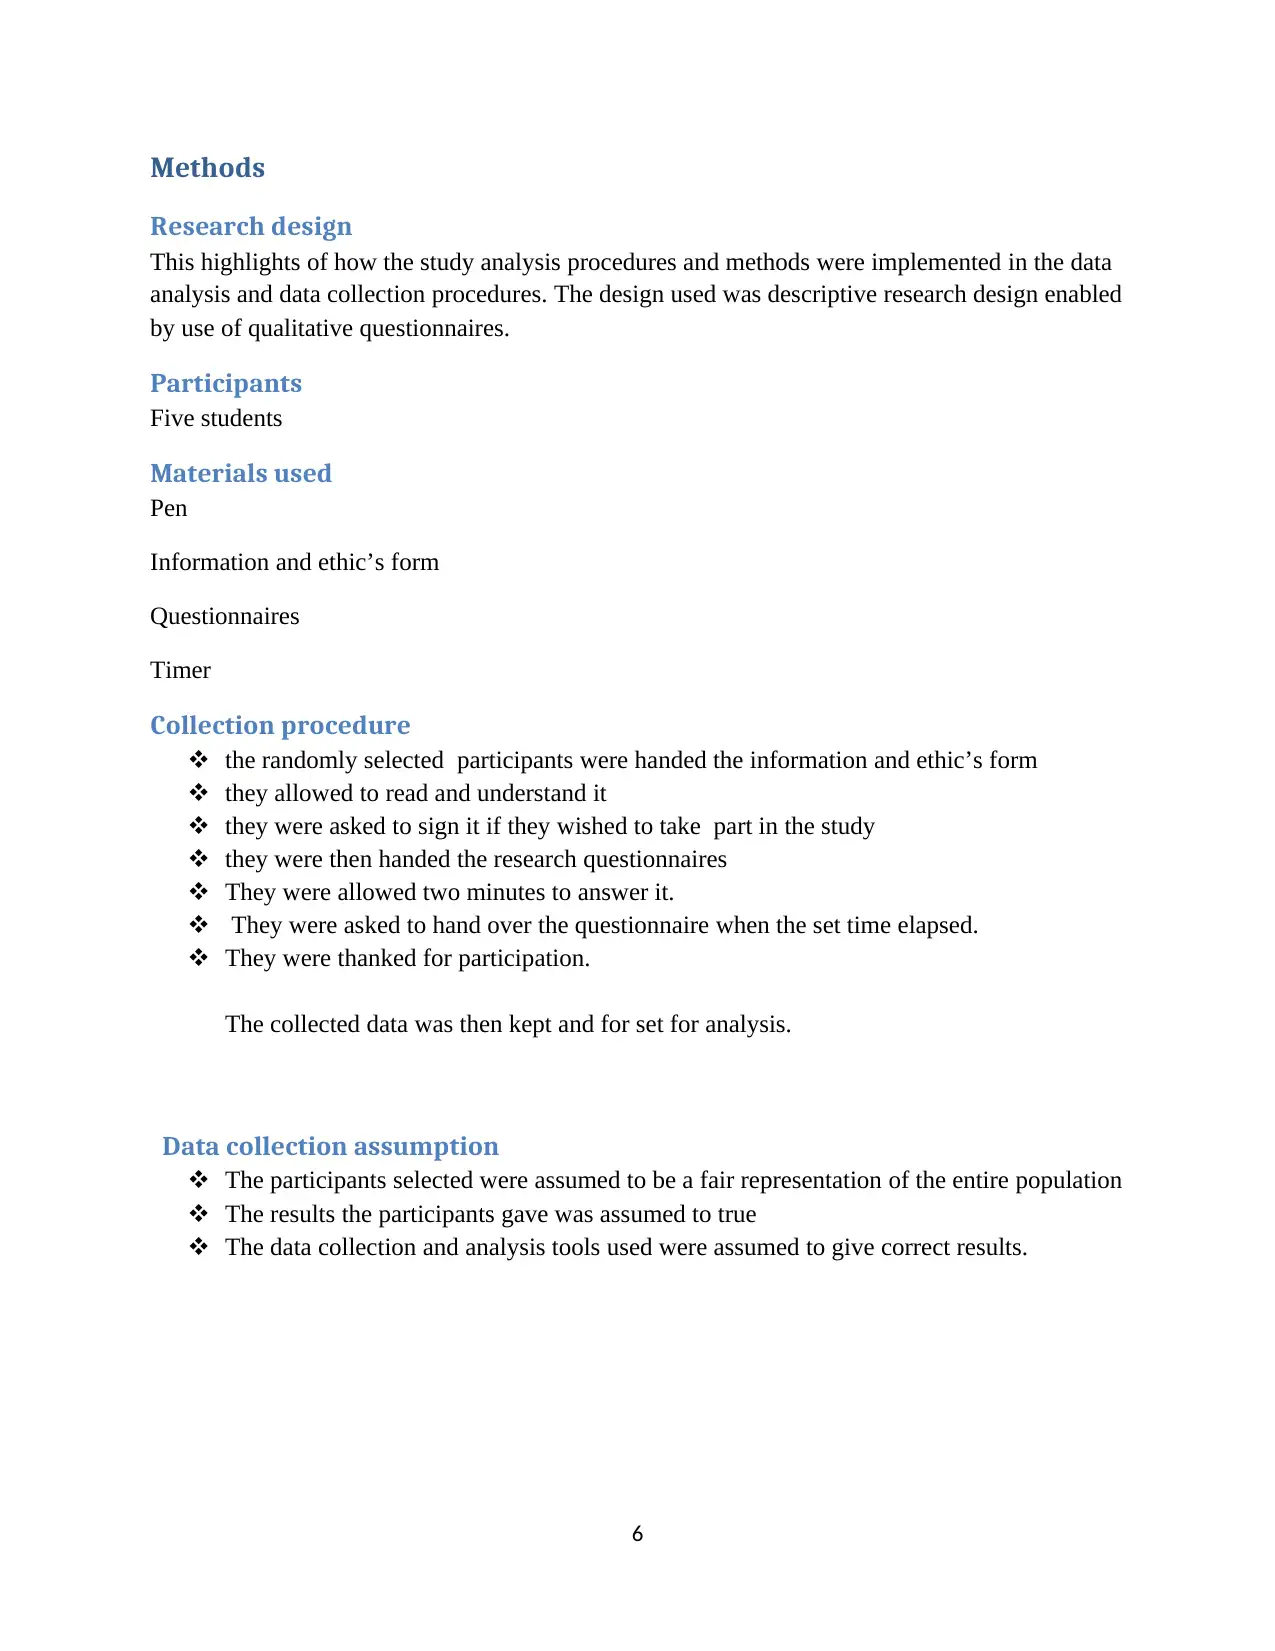
Research design
This highlights of how the study analysis procedures and methods were implemented in the data
analysis and data collection procedures. The design used was descriptive research design enabled
by use of qualitative questionnaires.
Participants
Five students
Materials used
Pen
Information and ethic’s form
Questionnaires
Timer
Collection procedure
the randomly selected participants were handed the information and ethic’s form
they allowed to read and understand it
they were asked to sign it if they wished to take part in the study
they were then handed the research questionnaires
They were allowed two minutes to answer it.
They were asked to hand over the questionnaire when the set time elapsed.
They were thanked for participation.
The collected data was then kept and for set for analysis.
Data collection assumption
The participants selected were assumed to be a fair representation of the entire population
The results the participants gave was assumed to true
The data collection and analysis tools used were assumed to give correct results.
6
⊘ This is a preview!⊘
Do you want full access?
Subscribe today to unlock all pages.
Trusted by 1+ million students worldwide
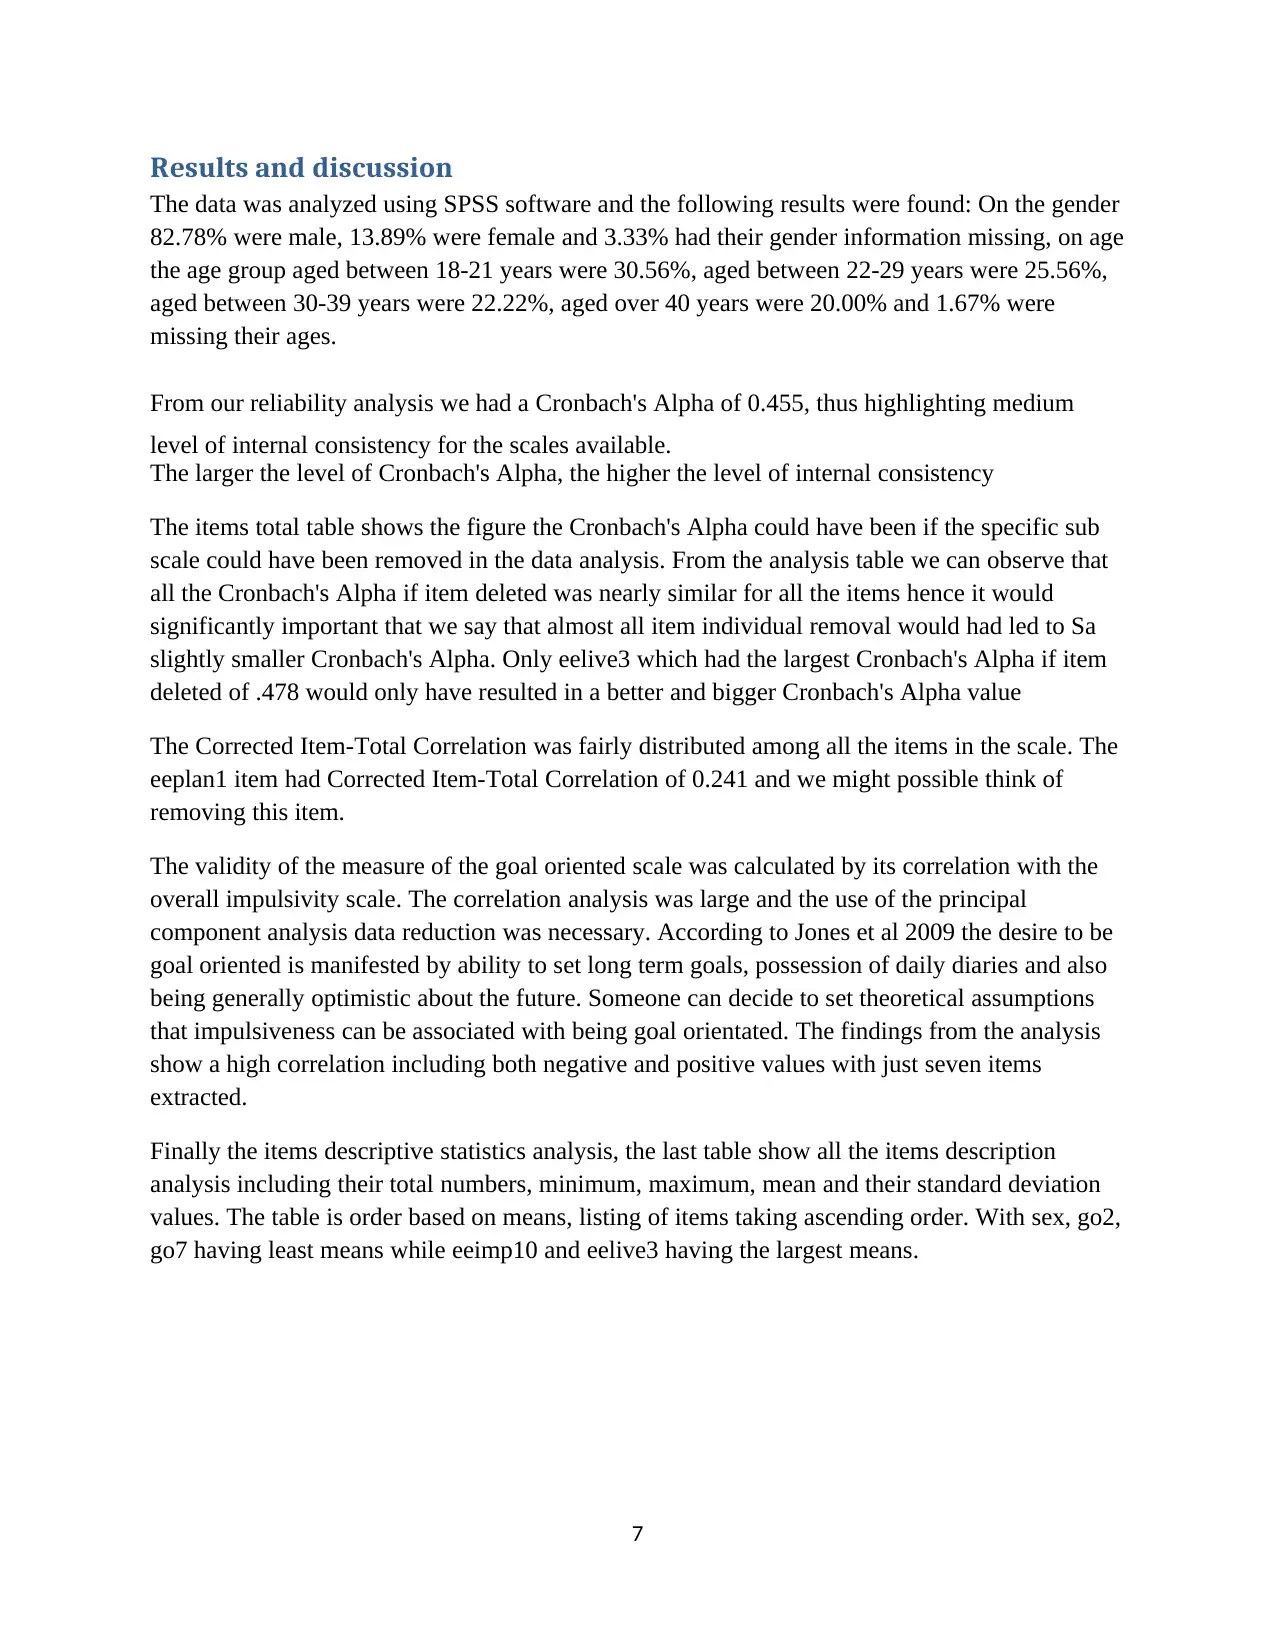
Results and discussion
The data was analyzed using SPSS software and the following results were found: On the gender
82.78% were male, 13.89% were female and 3.33% had their gender information missing, on age
the age group aged between 18-21 years were 30.56%, aged between 22-29 years were 25.56%,
aged between 30-39 years were 22.22%, aged over 40 years were 20.00% and 1.67% were
missing their ages.
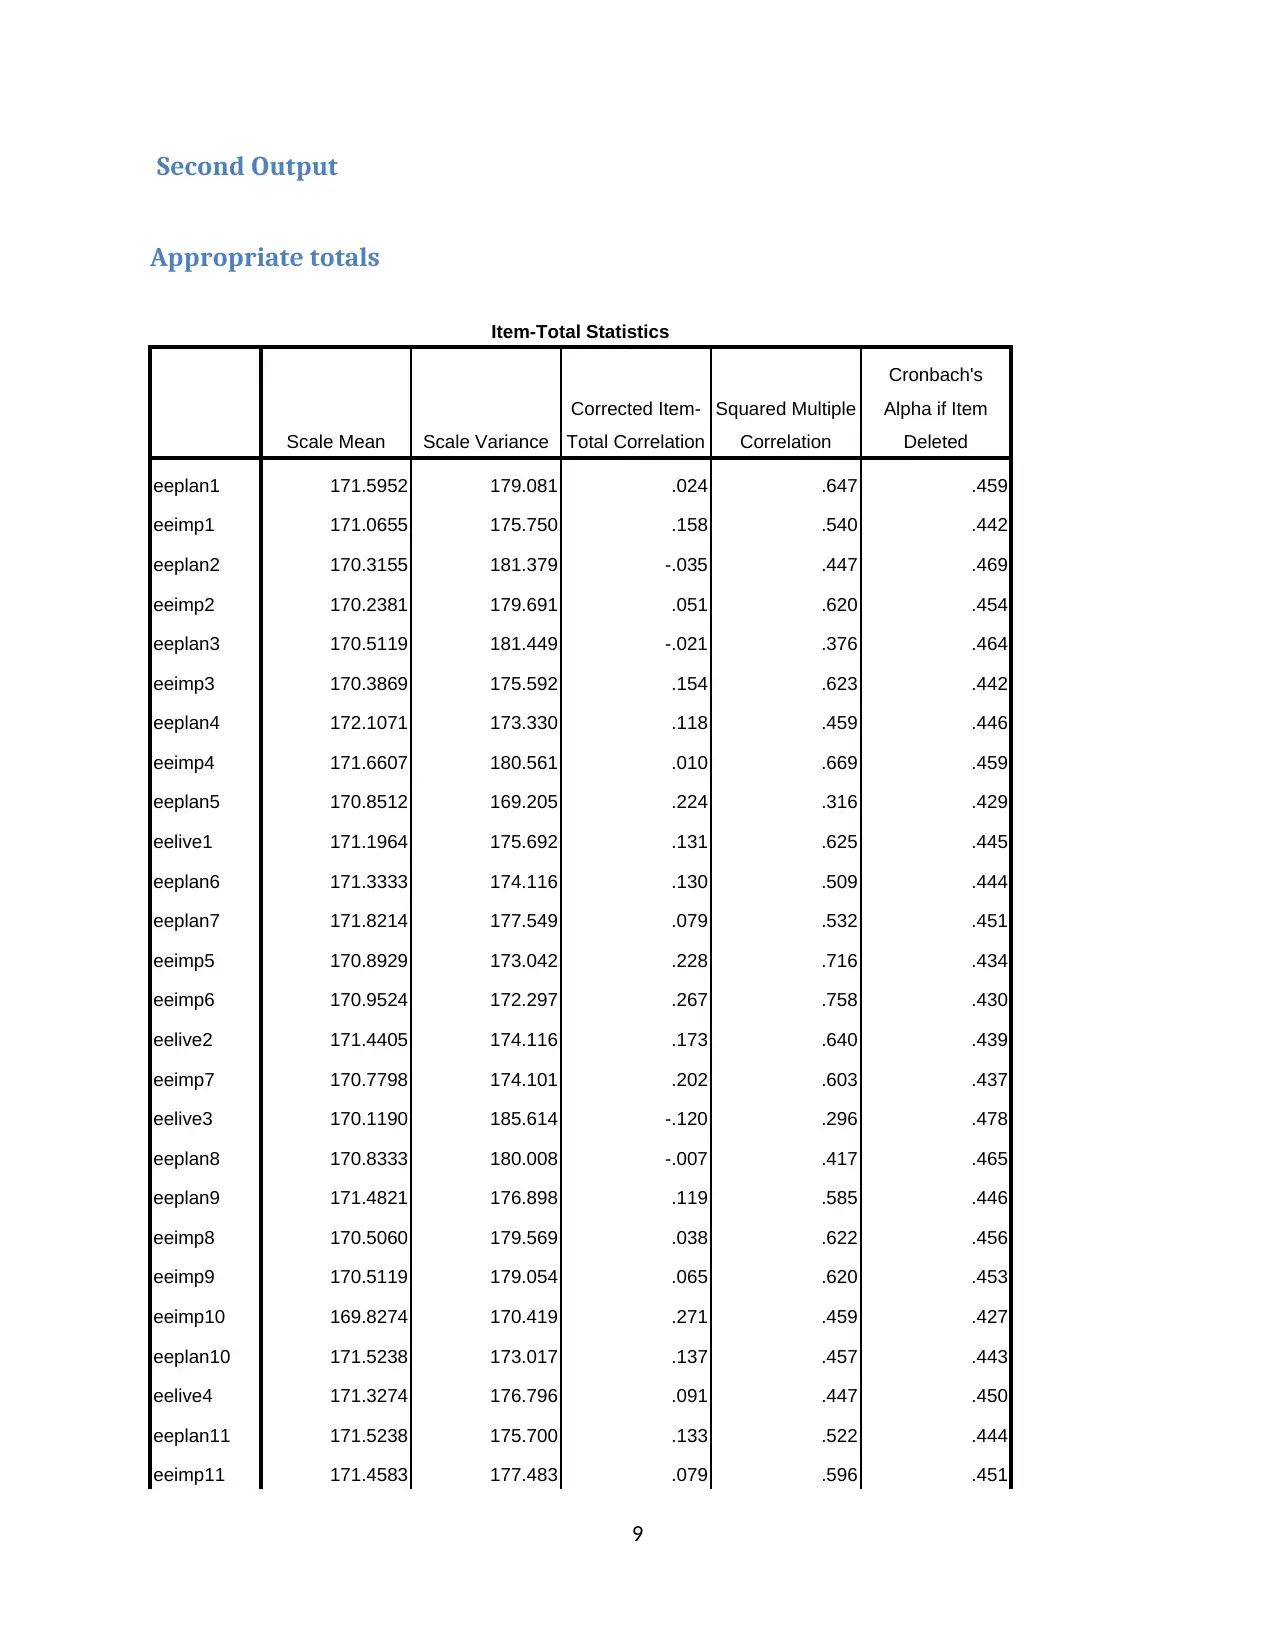
From our reliability analysis we had a Cronbach's Alpha of 0.455, thus highlighting medium
level of internal consistency for the scales available.
The larger the level of Cronbach's Alpha, the higher the level of internal consistency
The items total table shows the figure the Cronbach's Alpha could have been if the specific sub
scale could have been removed in the data analysis. From the analysis table we can observe that
all the Cronbach's Alpha if item deleted was nearly similar for all the items hence it would
significantly important that we say that almost all item individual removal would had led to Sa
slightly smaller Cronbach's Alpha. Only eelive3 which had the largest Cronbach's Alpha if item
deleted of .478 would only have resulted in a better and bigger Cronbach's Alpha value
The Corrected Item-Total Correlation was fairly distributed among all the items in the scale. The
eeplan1 item had Corrected Item-Total Correlation of 0.241 and we might possible think of
removing this item.
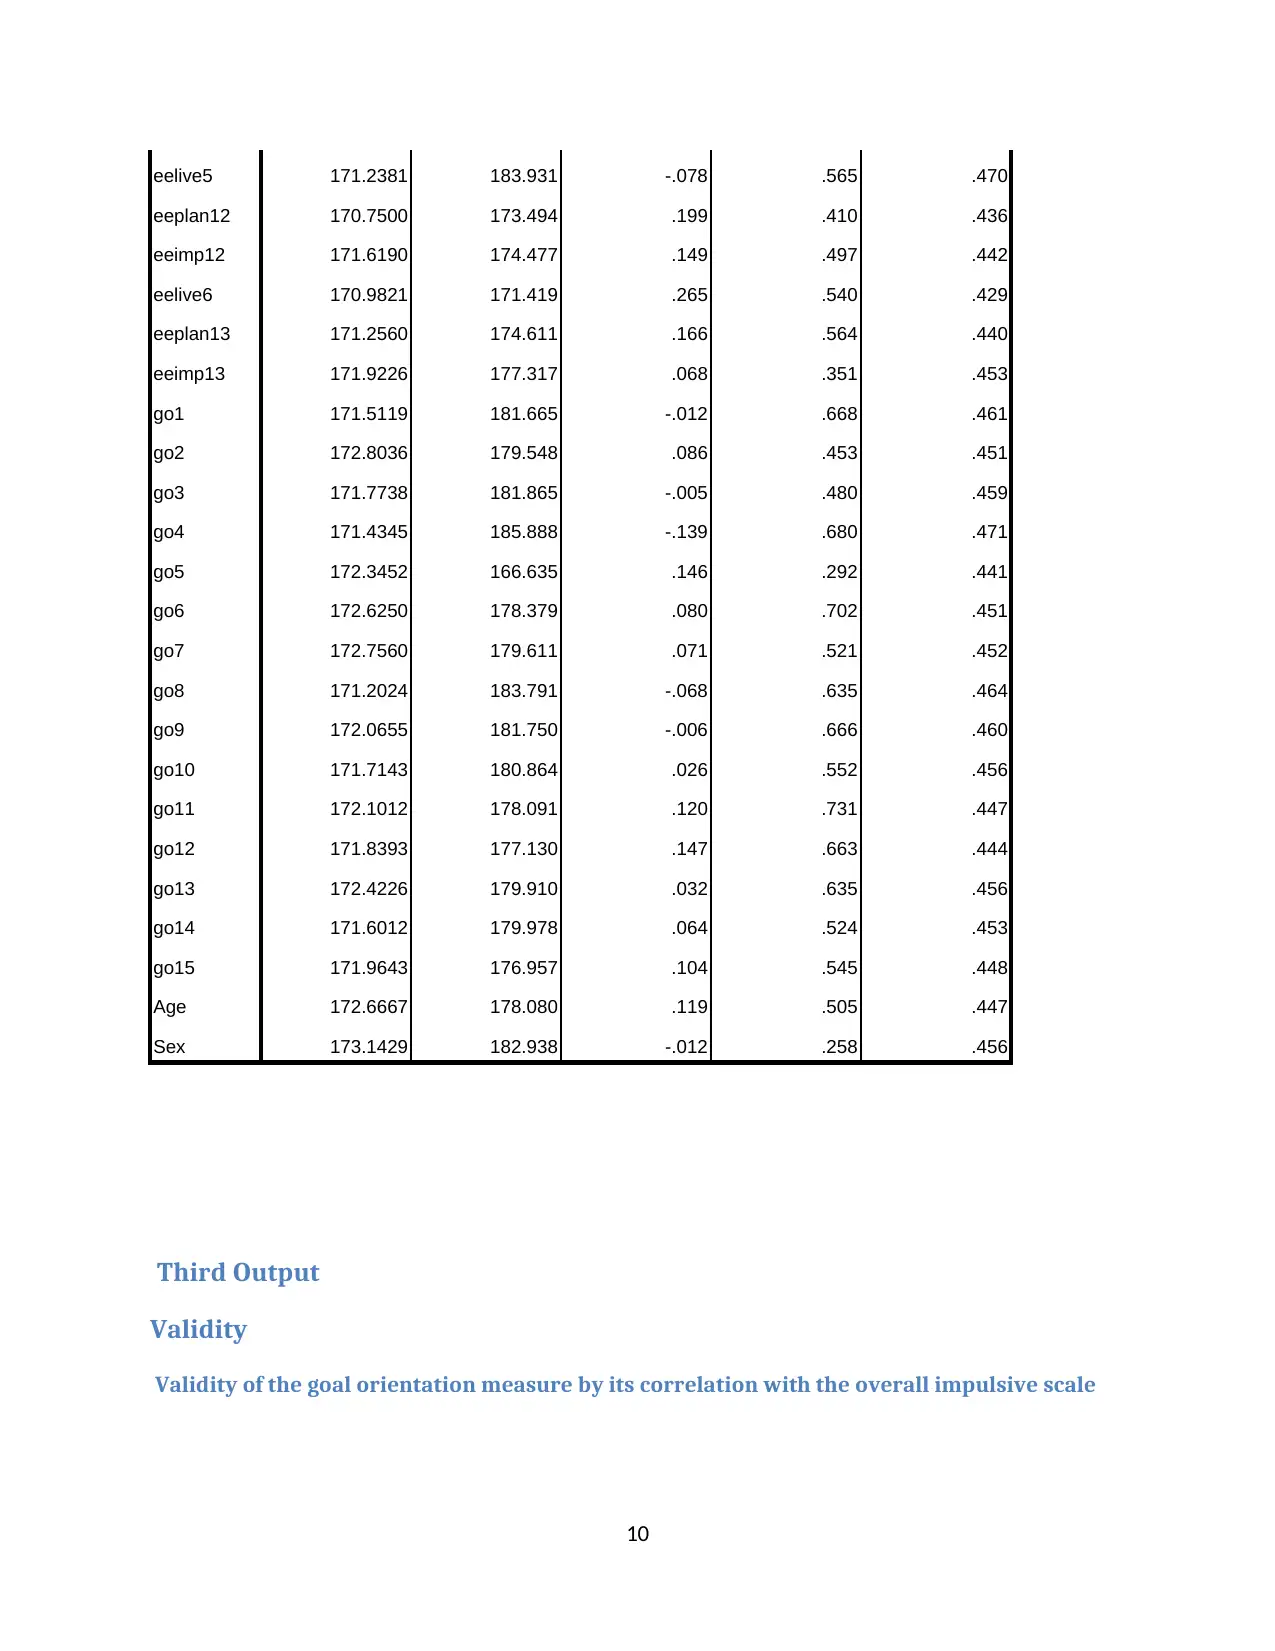
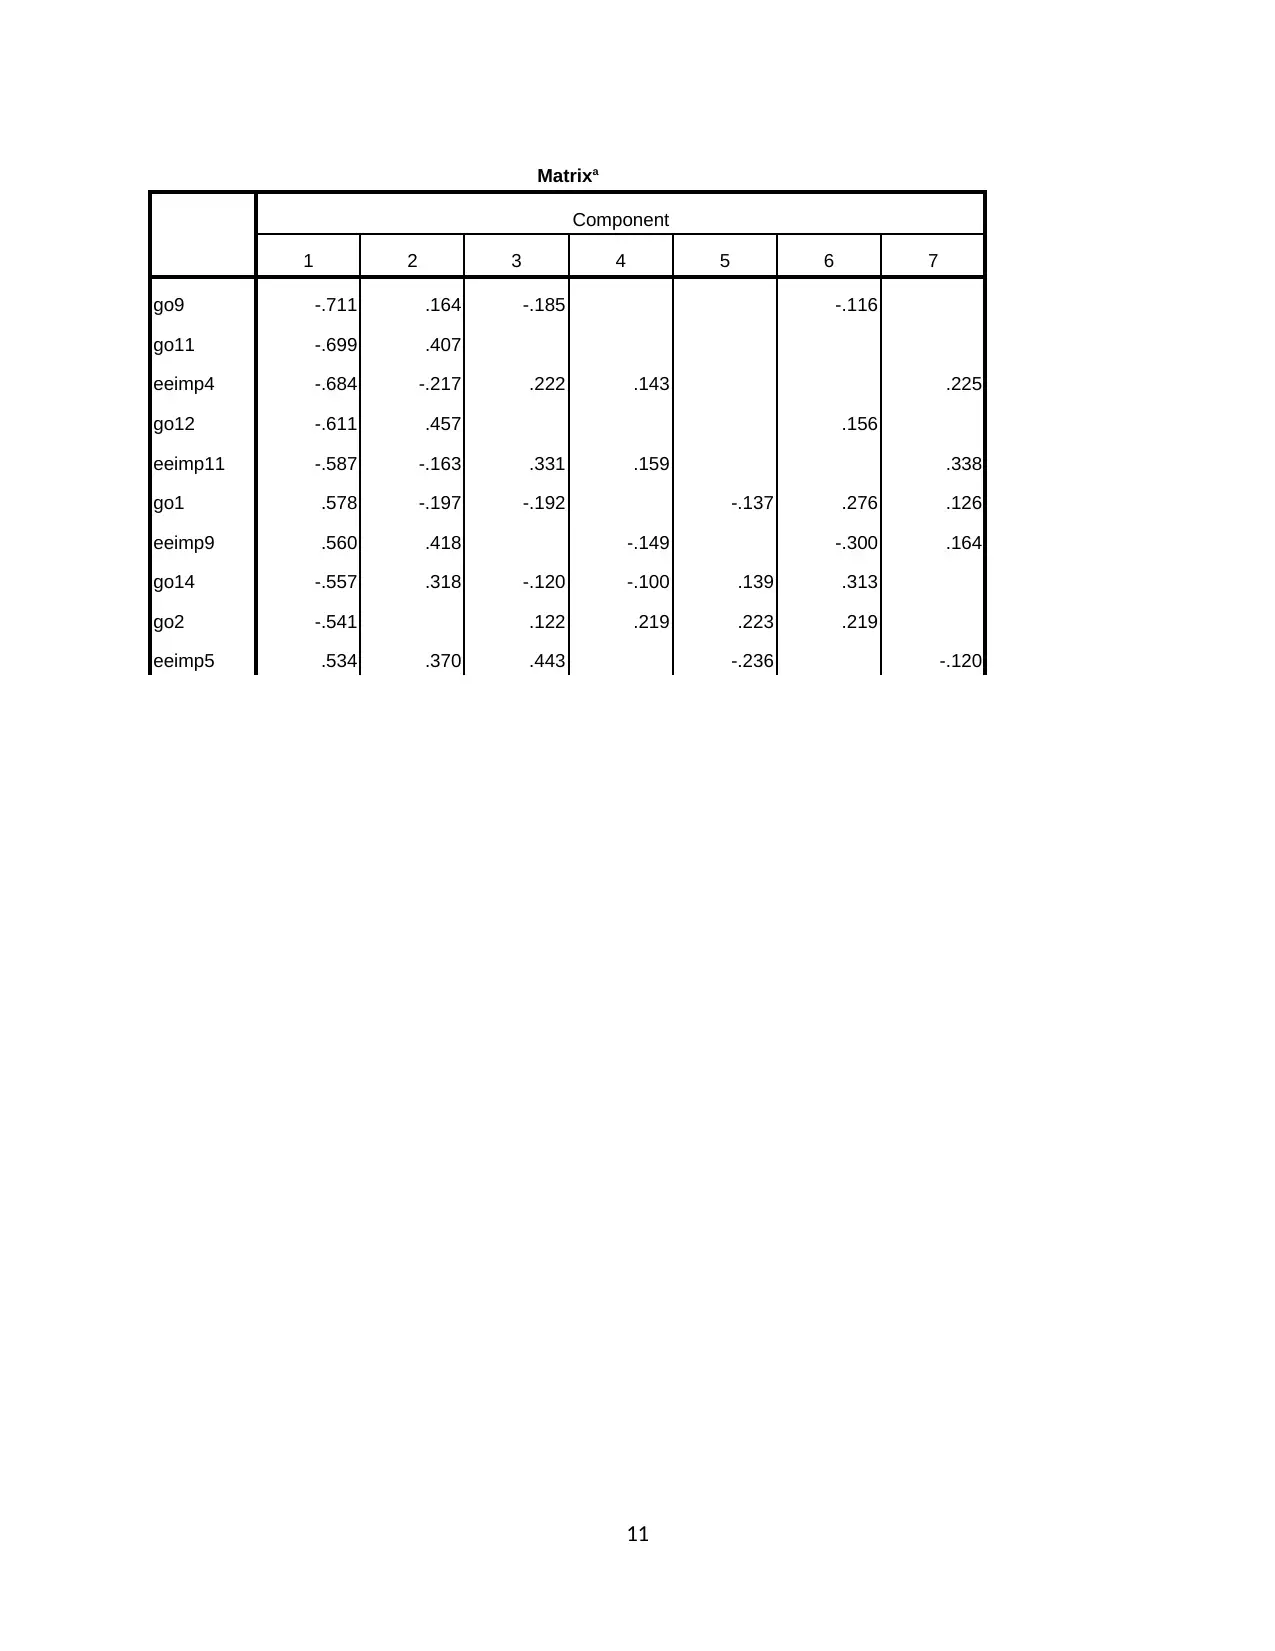
The validity of the measure of the goal oriented scale was calculated by its correlation with the
overall impulsivity scale. The correlation analysis was large and the use of the principal
component analysis data reduction was necessary. According to Jones et al 2009 the desire to be
goal oriented is manifested by ability to set long term goals, possession of daily diaries and also
being generally optimistic about the future. Someone can decide to set theoretical assumptions
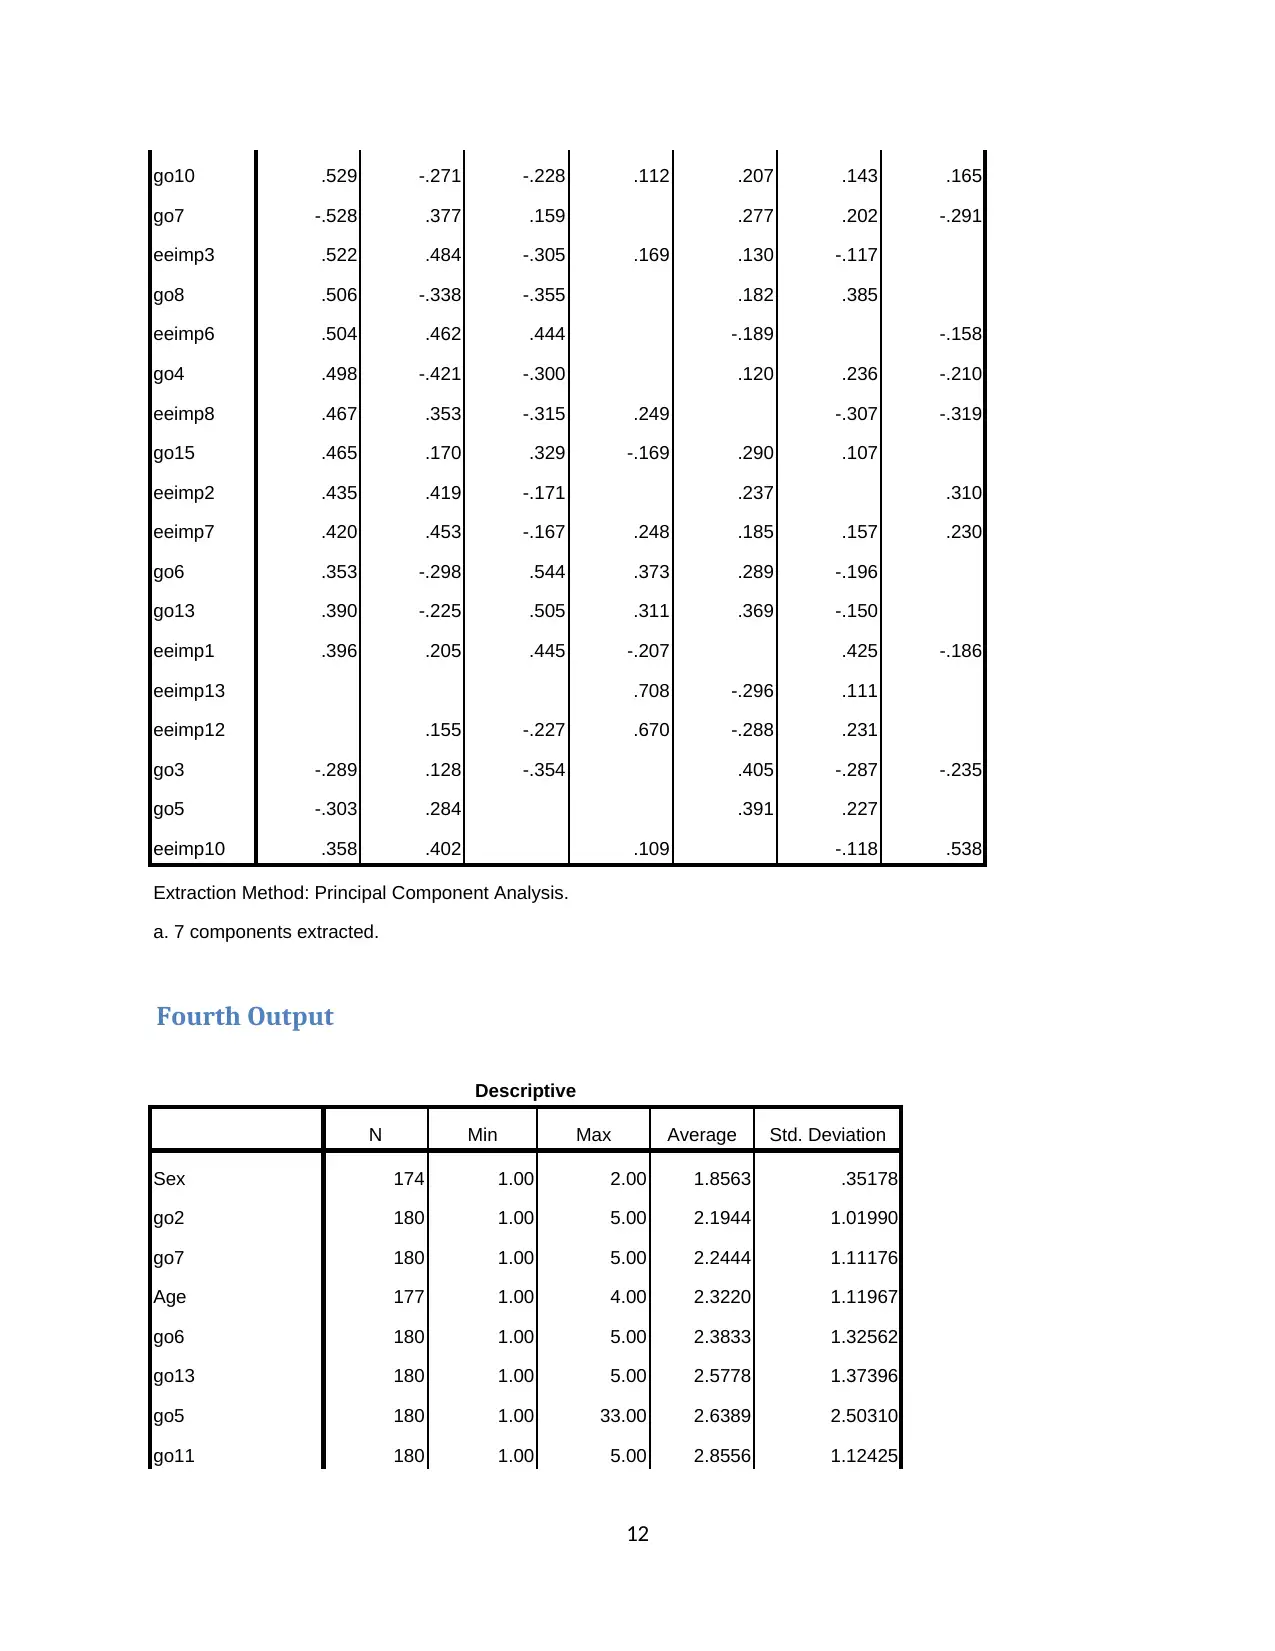
that impulsiveness can be associated with being goal orientated. The findings from the analysis
show a high correlation including both negative and positive values with just seven items
extracted.
Finally the items descriptive statistics analysis, the last table show all the items description
analysis including their total numbers, minimum, maximum, mean and their standard deviation
values. The table is order based on means, listing of items taking ascending order. With sex, go2,
go7 having least means while eeimp10 and eelive3 having the largest means.
7
The data was analyzed using SPSS software and the following results were found: On the gender
82.78% were male, 13.89% were female and 3.33% had their gender information missing, on age
the age group aged between 18-21 years were 30.56%, aged between 22-29 years were 25.56%,
aged between 30-39 years were 22.22%, aged over 40 years were 20.00% and 1.67% were
missing their ages.
From our reliability analysis we had a Cronbach's Alpha of 0.455, thus highlighting medium
level of internal consistency for the scales available.
The larger the level of Cronbach's Alpha, the higher the level of internal consistency
The items total table shows the figure the Cronbach's Alpha could have been if the specific sub
scale could have been removed in the data analysis. From the analysis table we can observe that
all the Cronbach's Alpha if item deleted was nearly similar for all the items hence it would
significantly important that we say that almost all item individual removal would had led to Sa
slightly smaller Cronbach's Alpha. Only eelive3 which had the largest Cronbach's Alpha if item
deleted of .478 would only have resulted in a better and bigger Cronbach's Alpha value
The Corrected Item-Total Correlation was fairly distributed among all the items in the scale. The
eeplan1 item had Corrected Item-Total Correlation of 0.241 and we might possible think of
removing this item.
The validity of the measure of the goal oriented scale was calculated by its correlation with the
overall impulsivity scale. The correlation analysis was large and the use of the principal
component analysis data reduction was necessary. According to Jones et al 2009 the desire to be
goal oriented is manifested by ability to set long term goals, possession of daily diaries and also
being generally optimistic about the future. Someone can decide to set theoretical assumptions
that impulsiveness can be associated with being goal orientated. The findings from the analysis
show a high correlation including both negative and positive values with just seven items
extracted.
Finally the items descriptive statistics analysis, the last table show all the items description
analysis including their total numbers, minimum, maximum, mean and their standard deviation
values. The table is order based on means, listing of items taking ascending order. With sex, go2,
go7 having least means while eeimp10 and eelive3 having the largest means.
7
Paraphrase This Document
Need a fresh take? Get an instant paraphrase of this document with our AI Paraphraser
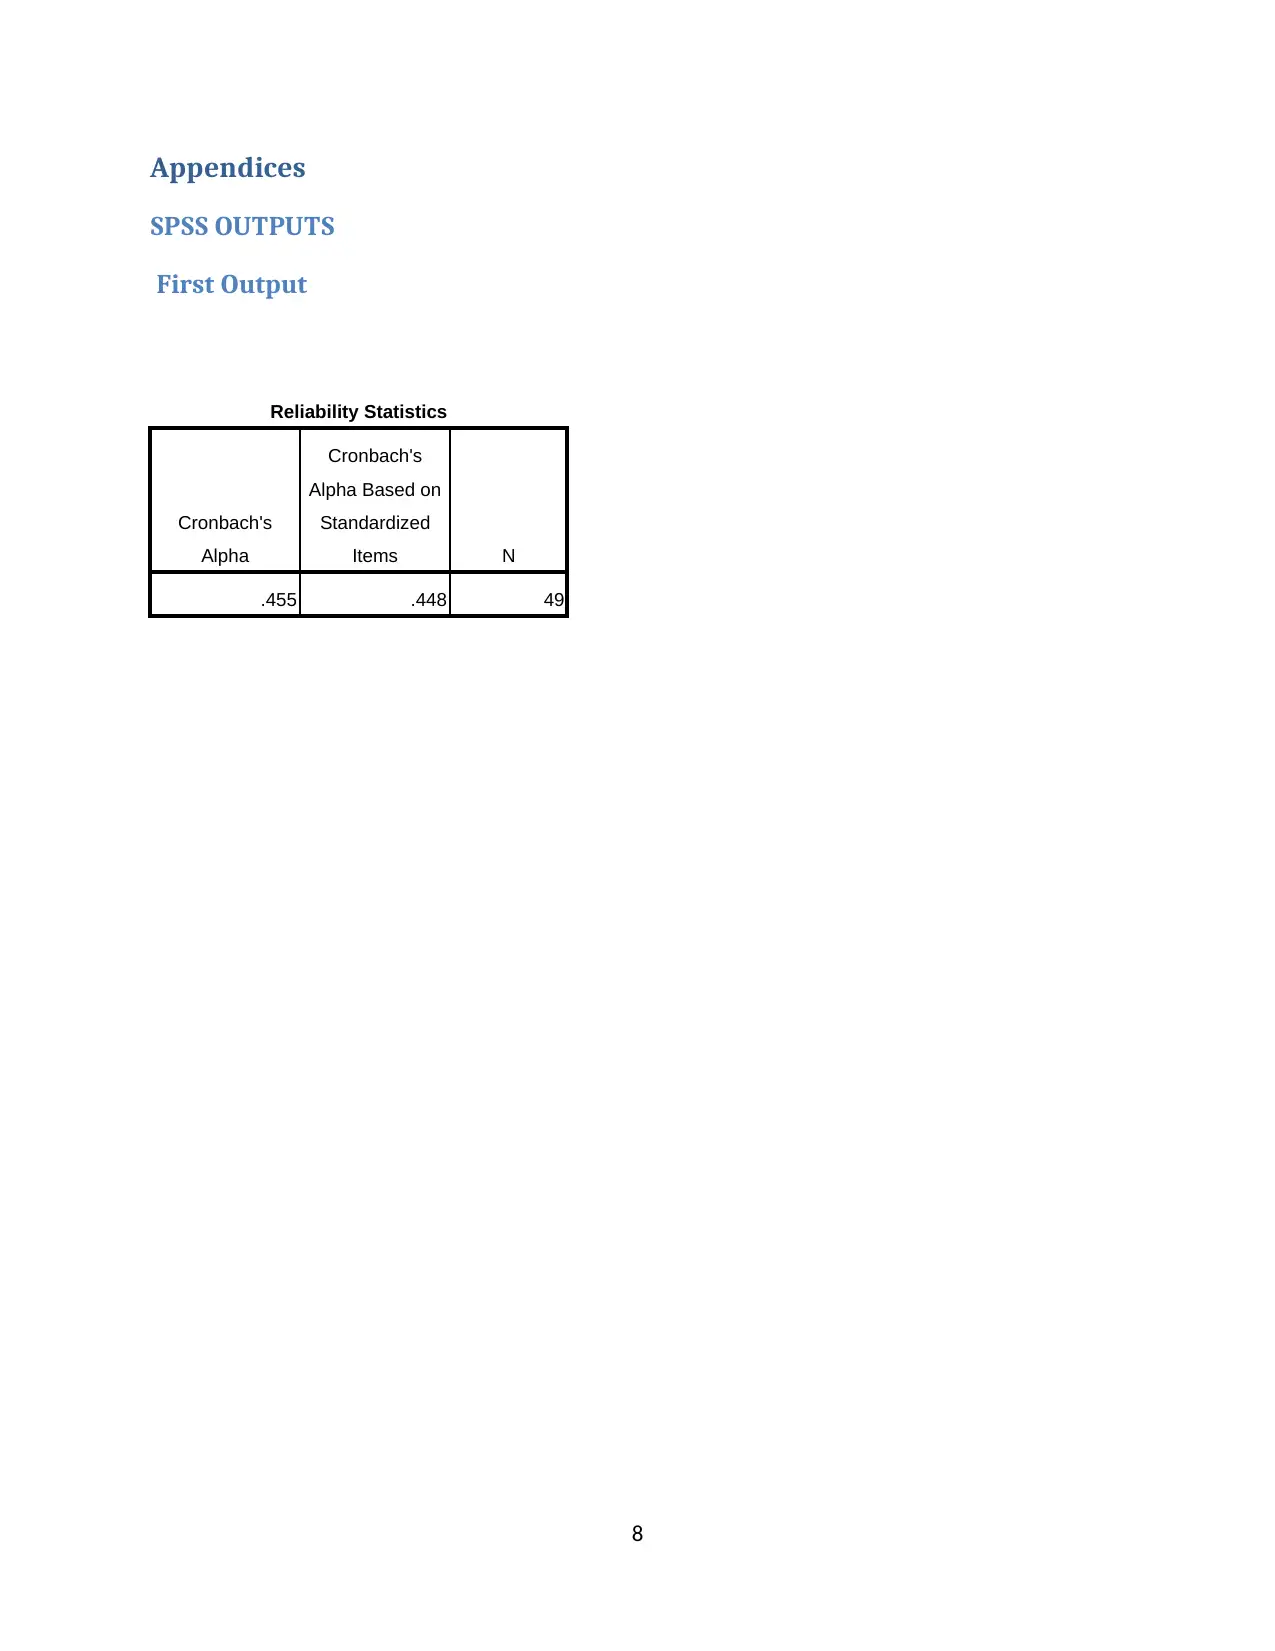
Appendices
SPSS OUTPUTS
First Output
Reliability Statistics
Cronbach's
Alpha
Cronbach's
Alpha Based on
Standardized
Items N
.455 .448 49
8
SPSS OUTPUTS
First Output
Reliability Statistics
Cronbach's
Alpha
Cronbach's
Alpha Based on
Standardized
Items N
.455 .448 49
8
Second Output
Appropriate totals
Item-Total Statistics
Scale Mean Scale Variance
Corrected Item-
Total Correlation
Squared Multiple
Correlation
Cronbach's
Alpha if Item
Deleted
eeplan1 171.5952 179.081 .024 .647 .459
eeimp1 171.0655 175.750 .158 .540 .442
eeplan2 170.3155 181.379 -.035 .447 .469
eeimp2 170.2381 179.691 .051 .620 .454
eeplan3 170.5119 181.449 -.021 .376 .464
eeimp3 170.3869 175.592 .154 .623 .442
eeplan4 172.1071 173.330 .118 .459 .446
eeimp4 171.6607 180.561 .010 .669 .459
eeplan5 170.8512 169.205 .224 .316 .429
eelive1 171.1964 175.692 .131 .625 .445
eeplan6 171.3333 174.116 .130 .509 .444
eeplan7 171.8214 177.549 .079 .532 .451
eeimp5 170.8929 173.042 .228 .716 .434
eeimp6 170.9524 172.297 .267 .758 .430
eelive2 171.4405 174.116 .173 .640 .439
eeimp7 170.7798 174.101 .202 .603 .437
eelive3 170.1190 185.614 -.120 .296 .478
eeplan8 170.8333 180.008 -.007 .417 .465
eeplan9 171.4821 176.898 .119 .585 .446
eeimp8 170.5060 179.569 .038 .622 .456
eeimp9 170.5119 179.054 .065 .620 .453
eeimp10 169.8274 170.419 .271 .459 .427
eeplan10 171.5238 173.017 .137 .457 .443
eelive4 171.3274 176.796 .091 .447 .450
eeplan11 171.5238 175.700 .133 .522 .444
eeimp11 171.4583 177.483 .079 .596 .451
9
⊘ This is a preview!⊘
Do you want full access?
Subscribe today to unlock all pages.
Trusted by 1+ million students worldwide
eelive5 171.2381 183.931 -.078 .565 .470
eeplan12 170.7500 173.494 .199 .410 .436
eeimp12 171.6190 174.477 .149 .497 .442
eelive6 170.9821 171.419 .265 .540 .429
eeplan13 171.2560 174.611 .166 .564 .440
eeimp13 171.9226 177.317 .068 .351 .453
go1 171.5119 181.665 -.012 .668 .461
go2 172.8036 179.548 .086 .453 .451
go3 171.7738 181.865 -.005 .480 .459
go4 171.4345 185.888 -.139 .680 .471
go5 172.3452 166.635 .146 .292 .441
go6 172.6250 178.379 .080 .702 .451
go7 172.7560 179.611 .071 .521 .452
go8 171.2024 183.791 -.068 .635 .464
go9 172.0655 181.750 -.006 .666 .460
go10 171.7143 180.864 .026 .552 .456
go11 172.1012 178.091 .120 .731 .447
go12 171.8393 177.130 .147 .663 .444
go13 172.4226 179.910 .032 .635 .456
go14 171.6012 179.978 .064 .524 .453
go15 171.9643 176.957 .104 .545 .448
Age 172.6667 178.080 .119 .505 .447
Sex 173.1429 182.938 -.012 .258 .456
Third Output
Validity
Validity of the goal orientation measure by its correlation with the overall impulsive scale
10
Paraphrase This Document
Need a fresh take? Get an instant paraphrase of this document with our AI Paraphraser
Matrixa
Component
1 2 3 4 5 6 7
go9 -.711 .164 -.185 -.116
go11 -.699 .407
eeimp4 -.684 -.217 .222 .143 .225
go12 -.611 .457 .156
eeimp11 -.587 -.163 .331 .159 .338
go1 .578 -.197 -.192 -.137 .276 .126
eeimp9 .560 .418 -.149 -.300 .164
go14 -.557 .318 -.120 -.100 .139 .313
go2 -.541 .122 .219 .223 .219
eeimp5 .534 .370 .443 -.236 -.120
11
go10 .529 -.271 -.228 .112 .207 .143 .165
go7 -.528 .377 .159 .277 .202 -.291
eeimp3 .522 .484 -.305 .169 .130 -.117
go8 .506 -.338 -.355 .182 .385
eeimp6 .504 .462 .444 -.189 -.158
go4 .498 -.421 -.300 .120 .236 -.210
eeimp8 .467 .353 -.315 .249 -.307 -.319
go15 .465 .170 .329 -.169 .290 .107
eeimp2 .435 .419 -.171 .237 .310
eeimp7 .420 .453 -.167 .248 .185 .157 .230
go6 .353 -.298 .544 .373 .289 -.196
go13 .390 -.225 .505 .311 .369 -.150
eeimp1 .396 .205 .445 -.207 .425 -.186
eeimp13 .708 -.296 .111
eeimp12 .155 -.227 .670 -.288 .231
go3 -.289 .128 -.354 .405 -.287 -.235
go5 -.303 .284 .391 .227
eeimp10 .358 .402 .109 -.118 .538
Extraction Method: Principal Component Analysis.
a. 7 components extracted.
Fourth Output
Descriptive
N Min Max Average Std. Deviation
Sex 174 1.00 2.00 1.8563 .35178
go2 180 1.00 5.00 2.1944 1.01990
go7 180 1.00 5.00 2.2444 1.11176
Age 177 1.00 4.00 2.3220 1.11967
go6 180 1.00 5.00 2.3833 1.32562
go13 180 1.00 5.00 2.5778 1.37396
go5 180 1.00 33.00 2.6389 2.50310
go11 180 1.00 5.00 2.8556 1.12425
12
⊘ This is a preview!⊘
Do you want full access?
Subscribe today to unlock all pages.
Trusted by 1+ million students worldwide
1 out of 14


Your All-in-One AI-Powered Toolkit for Academic Success.
+13062052269
info@desklib.com
Available 24*7 on WhatsApp / Email
![[object Object]](/_next/static/media/star-bottom.7253800d.svg)
Unlock your academic potential
Copyright © 2020–2026 A2Z Services. All Rights Reserved. Developed and managed by ZUCOL.