Strategic Management: Financial Ratio Analysis of Car Companies
VerifiedAdded on  2022/12/05
|11
|1582
|232
Report
AI Summary
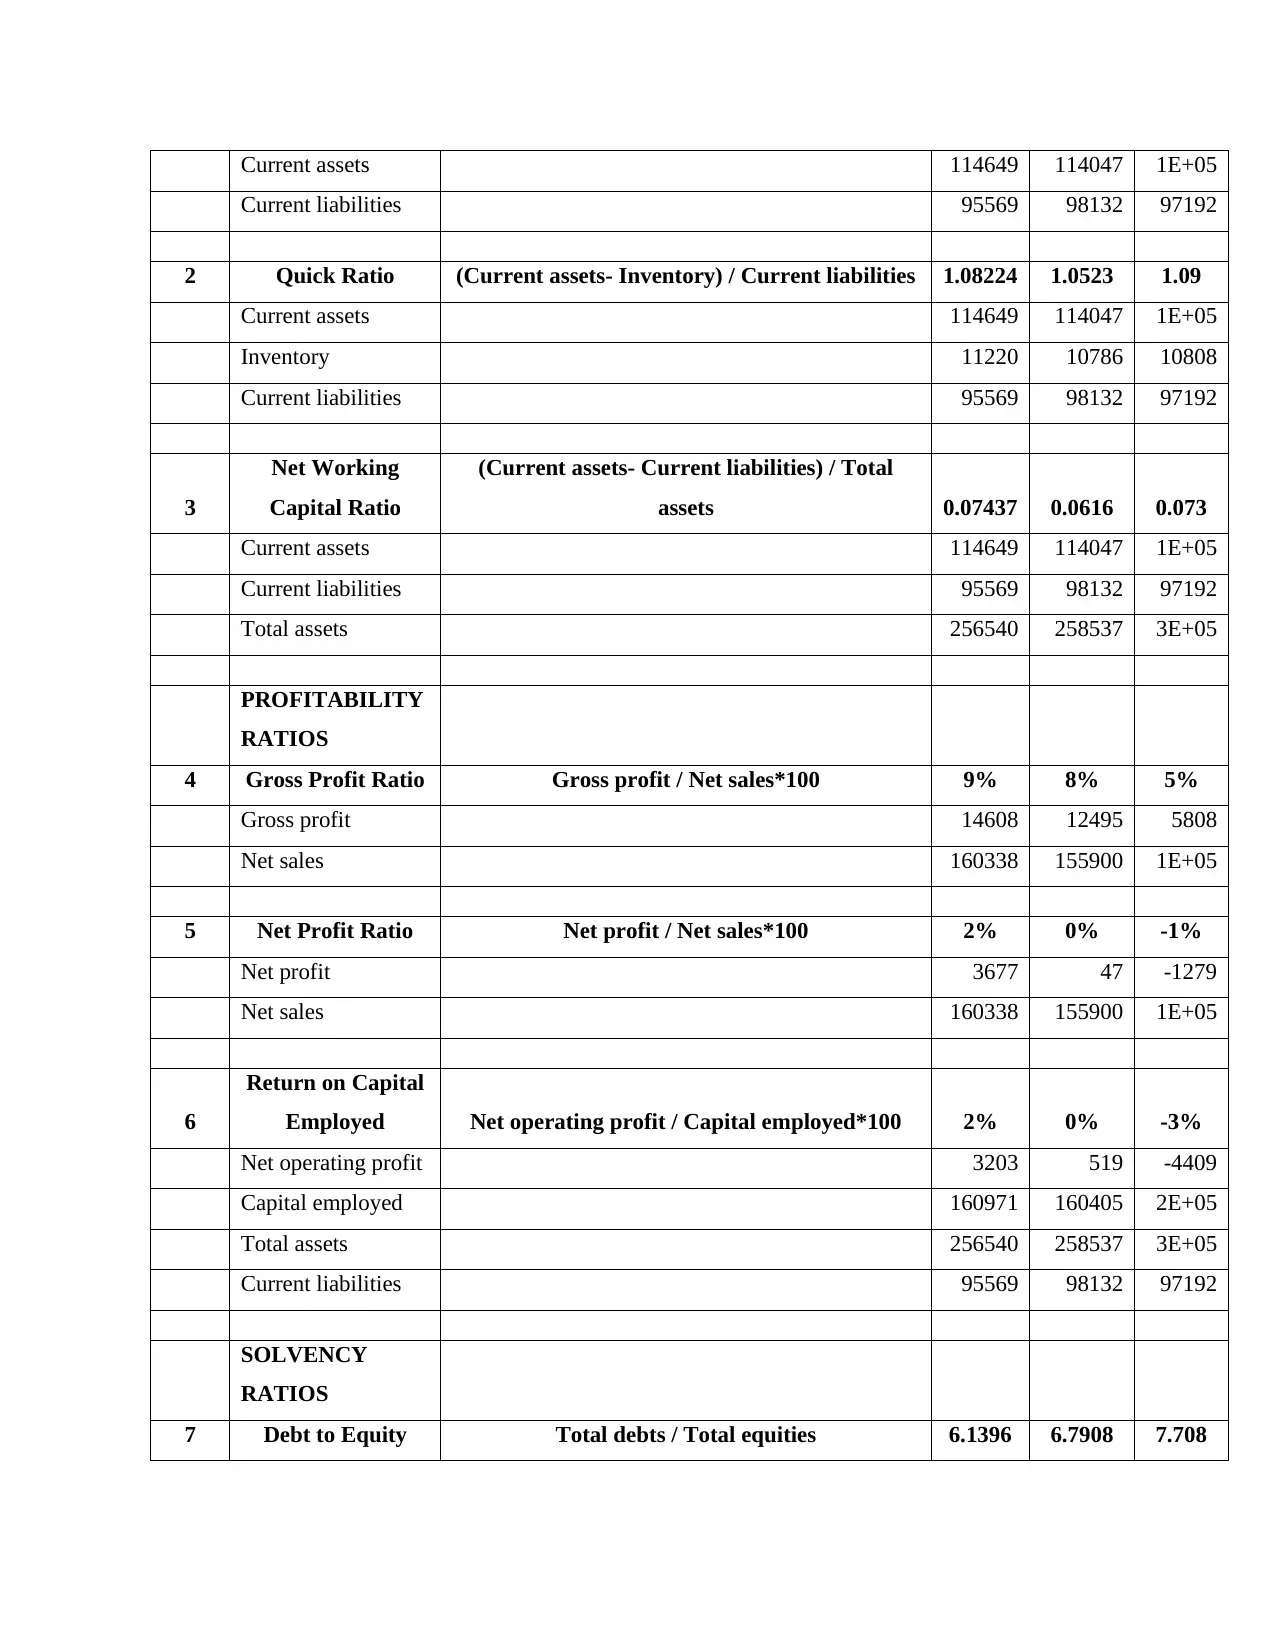
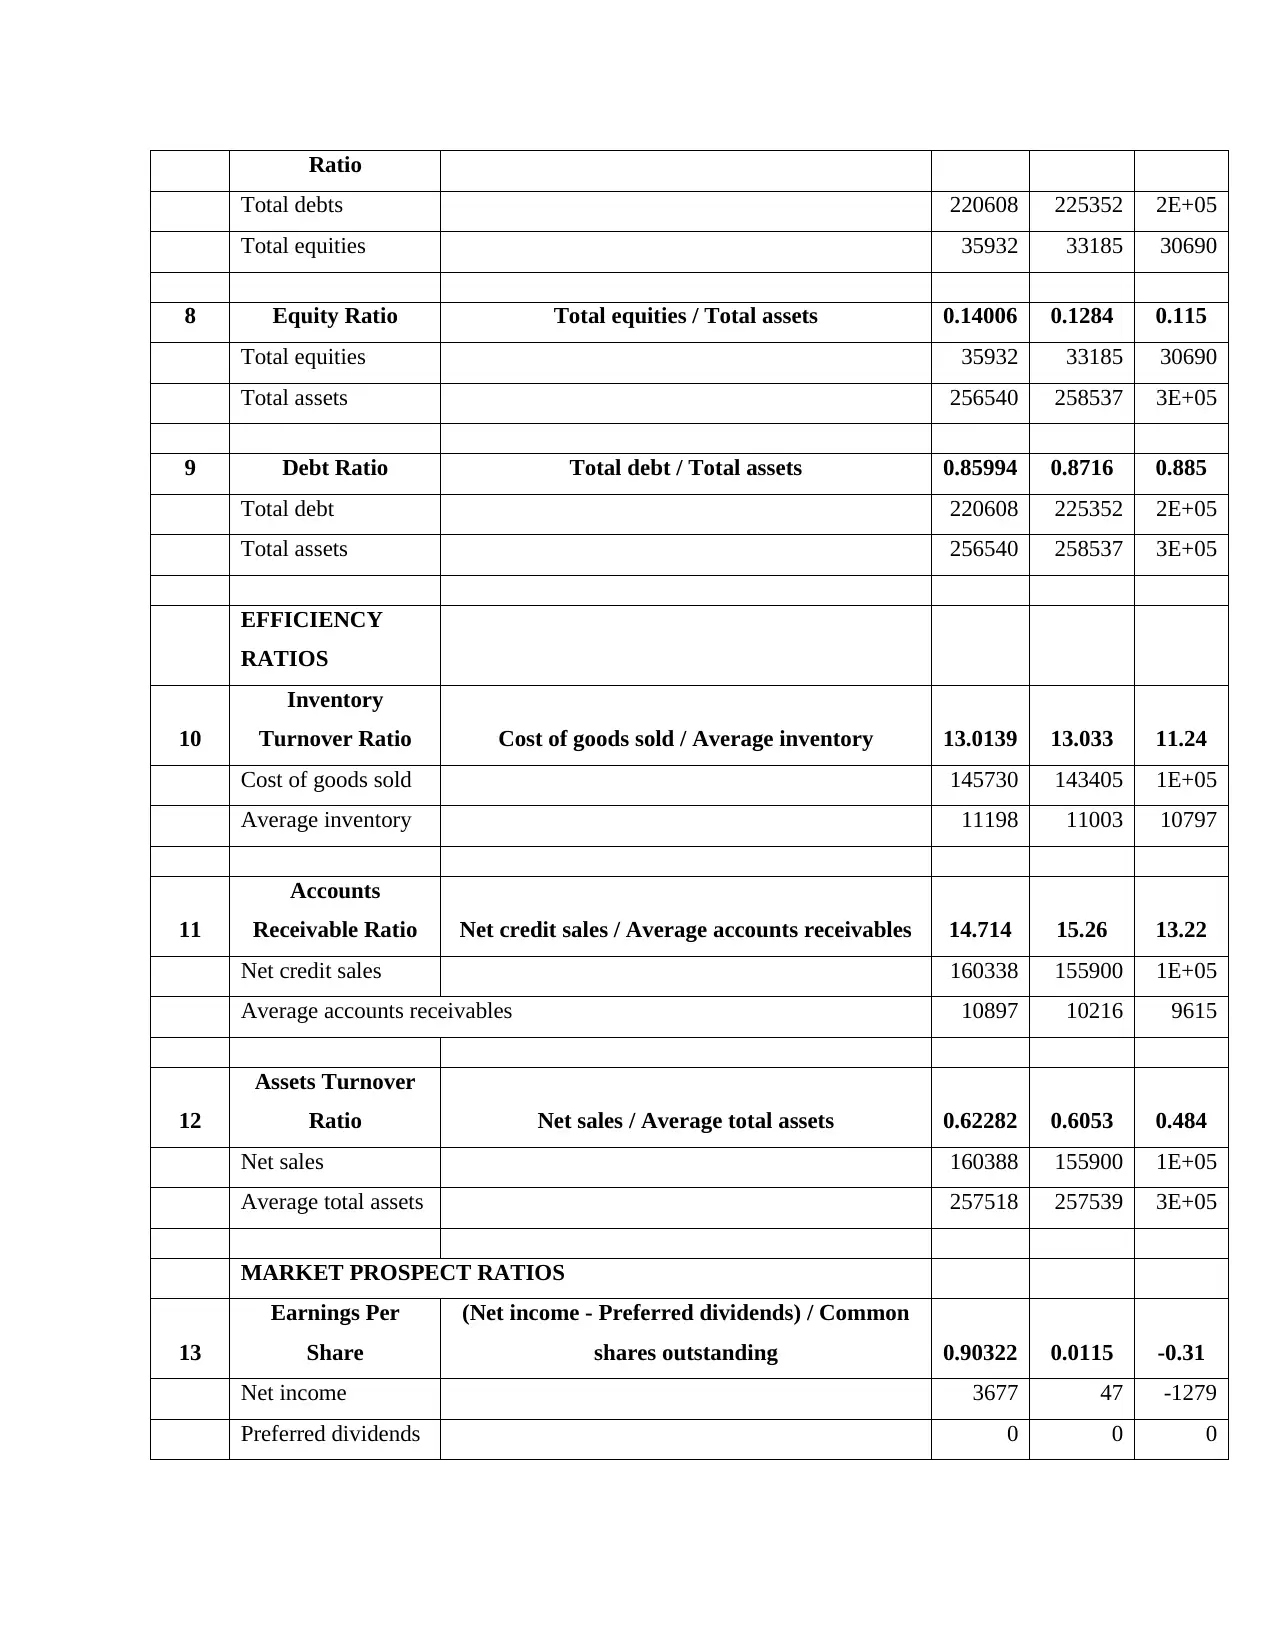
This report presents a comprehensive financial analysis comparing Gogo Motors and Swifty Motors, two fictional car companies. It begins with an introduction to ratio analysis and its importance in evaluating a company's financial health, covering liquidity, profitability, solvency, efficiency, and market prospect ratios. The main body of the report includes detailed calculations for each ratio, using financial data from 2018 to 2020. It offers interpretations of the results, highlighting the strengths and weaknesses of each company. Gogo Motors demonstrates stronger profitability, while Swifty Motors shows better efficiency in certain areas. The analysis concludes with investment suggestions, recommending Gogo Motors as a more profitable venture for potential investors due to its higher earnings per share. The report emphasizes the significance of ratio analysis in facilitating informed investment decisions and comparing business performance. The report utilizes the provided financial data to demonstrate quantitative numeracy skills, as required by the assignment brief.

STRATEGIC
MANAGEMENT
MANAGEMENT
Paraphrase This Document
Need a fresh take? Get an instant paraphrase of this document with our AI Paraphraser

TABLE OF CONTENTS
INTRODUCTION.....................................................................................................................................3
MAIN BODY.............................................................................................................................................3
Ratio Analysis.........................................................................................................................................3
Interpretation...........................................................................................................................................6
Suggestion...............................................................................................................................................6
CONCLUSION..........................................................................................................................................7
REFERENCES..........................................................................................................................................7

INTRODUCTION
Ratio analysis helps in facilitating comparison between two businesses regarding their
profitability, liquidity and efficiency position. This project shall be analyzing the financial
statements of two fictional companies one is Gogo Motors and the other is Swifty Motors. The
ratio analysis shall be showing the performance of both the businesses and based on that the
suggestions shall be provided to the potential investors of the business.
MAIN BODY
Ratio Analysis
a) Gogo Motors
GOGO MOTORS
S.N
O RATIOS FORMULA CALCULATIONS
2018 2019 2020
LIQUIDITY RATIOS
1 Current Ratio Current assets / Current liabilities
0.91556
1
0.88324
6
1.01268
9
Current assets 75293 74992 80924
Current liabilities 82237 84905 79910
2 Quick Ratio
(Current assets- Inventory) / Current
liabilities
0.79619
9 0.76078
0.88460
8
Current assets 75293 74992 80924
Inventory 9816 10398 10235
Current liabilities 82237 84905 79910
3
Net Working
Capital Ratio
(Current assets- Current liabilities) /
Total assets
-
0.03054
-
0.04347
0.00431
1
Current assets 75293 74992 80924
Current liabilities 82237 84905 79910
Total assets 227339 228037 235194
⊘ This is a preview!⊘
Do you want full access?
Subscribe today to unlock all pages.

Trusted by 1+ million students worldwide

PROFITABILITY RATIOS
4
Gross Profit
Ratio Gross profit / Net sales*100 10% 10% 12%
Gross profit 14095 13972 15172
Net sales 147049 137237 122485
5 Net Profit Ratio Net profit / Net sales*100 5% 5% 5%
Net profit 8014 6732 6427
Net sales 147049 137237 122485
6
Return on
Capital
Employed
Net operating profit / Capital
employed*100 3% 4% 4%
Net operating profit 4445 5481 6634
Capital employed 145102 143132 155284
Total assets 227339 228037 235194
Current liabilities 82237 84905 79910
SOLVENCY RATIOS
7
Debt to Equity
Ratio Total debts / Total equities
4.85020
6
4.45647
5
4.22305
1
Total debts 188479 186245 190164
Total equities 38860 41792 45030
8 Equity Ratio Total equities / Total assets
0.17093
4
0.18326
9
0.19145
9
Total equities 38860 41792 45030
Total assets 227339 228037 235194
9 Debt Ratio Total debt / Total assets
0.82906
6
0.81673
1
0.80854
1
Total debt 188479 186245 190164
Total assets 227339 228037 235194
EFFICIENCY RATIOS
4
Gross Profit
Ratio Gross profit / Net sales*100 10% 10% 12%
Gross profit 14095 13972 15172
Net sales 147049 137237 122485
5 Net Profit Ratio Net profit / Net sales*100 5% 5% 5%
Net profit 8014 6732 6427
Net sales 147049 137237 122485
6
Return on
Capital
Employed
Net operating profit / Capital
employed*100 3% 4% 4%
Net operating profit 4445 5481 6634
Capital employed 145102 143132 155284
Total assets 227339 228037 235194
Current liabilities 82237 84905 79910
SOLVENCY RATIOS
7
Debt to Equity
Ratio Total debts / Total equities
4.85020
6
4.45647
5
4.22305
1
Total debts 188479 186245 190164
Total equities 38860 41792 45030
8 Equity Ratio Total equities / Total assets
0.17093
4
0.18326
9
0.19145
9
Total equities 38860 41792 45030
Total assets 227339 228037 235194
9 Debt Ratio Total debt / Total assets
0.82906
6
0.81673
1
0.80854
1
Total debt 188479 186245 190164
Total assets 227339 228037 235194
EFFICIENCY RATIOS
Paraphrase This Document
Need a fresh take? Get an instant paraphrase of this document with our AI Paraphraser

10
Inventory
Turnover Ratio Cost of goods sold / Average inventory
12.9844
2 12.196
10.4020
7
Cost of goods sold 132954 123265 107313
Average inventory 10239.5 10107 10316.5
11
Accounts
Receivable
Ratio
Net credit sales / Average accounts
receivables
4.73709
8
4.10907
7
3.62156
6
Net credit sales 147049 137237 122485
Average accounts receivables 31042 33398.5 33821
12
Assets Turnover
Ratio Net sales / Average total assets
0.66867
7
0.60274
1
0.52882
9
Net sales 147049 137237 122485
Average total assets
219910.
5 227688
231615.
5
MARKET PROSPECT RATIOS
13
Earnings Per
Share
(Net income - Preferred dividends) /
Common shares outstanding
5.72428
6
4.80857
1
4.59071
4
Net income 8014 6732 6427
Preferred dividends 0 0 0
Common shares outstanding 1400 1400 1400
b) Swifty Motors
SWIFTY MOTORS
S.NO RATIOS FORMULA CALCULATIONS
2018 2019 2020
LIQUIDITY
RATIOS
1 Current Ratio Current assets / Current liabilities 1.19965 1.1622 1.201

Current assets 114649 114047 1E+05
Current liabilities 95569 98132 97192
2 Quick Ratio (Current assets- Inventory) / Current liabilities 1.08224 1.0523 1.09
Current assets 114649 114047 1E+05
Inventory 11220 10786 10808
Current liabilities 95569 98132 97192
3
Net Working
Capital Ratio
(Current assets- Current liabilities) / Total
assets 0.07437 0.0616 0.073
Current assets 114649 114047 1E+05
Current liabilities 95569 98132 97192
Total assets 256540 258537 3E+05
PROFITABILITY
RATIOS
4 Gross Profit Ratio Gross profit / Net sales*100 9% 8% 5%
Gross profit 14608 12495 5808
Net sales 160338 155900 1E+05
5 Net Profit Ratio Net profit / Net sales*100 2% 0% -1%
Net profit 3677 47 -1279
Net sales 160338 155900 1E+05
6
Return on Capital
Employed Net operating profit / Capital employed*100 2% 0% -3%
Net operating profit 3203 519 -4409
Capital employed 160971 160405 2E+05
Total assets 256540 258537 3E+05
Current liabilities 95569 98132 97192
SOLVENCY
RATIOS
7 Debt to Equity Total debts / Total equities 6.1396 6.7908 7.708
Current liabilities 95569 98132 97192
2 Quick Ratio (Current assets- Inventory) / Current liabilities 1.08224 1.0523 1.09
Current assets 114649 114047 1E+05
Inventory 11220 10786 10808
Current liabilities 95569 98132 97192
3
Net Working
Capital Ratio
(Current assets- Current liabilities) / Total
assets 0.07437 0.0616 0.073
Current assets 114649 114047 1E+05
Current liabilities 95569 98132 97192
Total assets 256540 258537 3E+05
PROFITABILITY
RATIOS
4 Gross Profit Ratio Gross profit / Net sales*100 9% 8% 5%
Gross profit 14608 12495 5808
Net sales 160338 155900 1E+05
5 Net Profit Ratio Net profit / Net sales*100 2% 0% -1%
Net profit 3677 47 -1279
Net sales 160338 155900 1E+05
6
Return on Capital
Employed Net operating profit / Capital employed*100 2% 0% -3%
Net operating profit 3203 519 -4409
Capital employed 160971 160405 2E+05
Total assets 256540 258537 3E+05
Current liabilities 95569 98132 97192
SOLVENCY
RATIOS
7 Debt to Equity Total debts / Total equities 6.1396 6.7908 7.708
⊘ This is a preview!⊘
Do you want full access?
Subscribe today to unlock all pages.

Trusted by 1+ million students worldwide

Ratio
Total debts 220608 225352 2E+05
Total equities 35932 33185 30690
8 Equity Ratio Total equities / Total assets 0.14006 0.1284 0.115
Total equities 35932 33185 30690
Total assets 256540 258537 3E+05
9 Debt Ratio Total debt / Total assets 0.85994 0.8716 0.885
Total debt 220608 225352 2E+05
Total assets 256540 258537 3E+05
EFFICIENCY
RATIOS
10
Inventory
Turnover Ratio Cost of goods sold / Average inventory 13.0139 13.033 11.24
Cost of goods sold 145730 143405 1E+05
Average inventory 11198 11003 10797
11
Accounts
Receivable Ratio Net credit sales / Average accounts receivables 14.714 15.26 13.22
Net credit sales 160338 155900 1E+05
Average accounts receivables 10897 10216 9615
12
Assets Turnover
Ratio Net sales / Average total assets 0.62282 0.6053 0.484
Net sales 160388 155900 1E+05
Average total assets 257518 257539 3E+05
MARKET PROSPECT RATIOS
13
Earnings Per
Share
(Net income - Preferred dividends) / Common
shares outstanding 0.90322 0.0115 -0.31
Net income 3677 47 -1279
Preferred dividends 0 0 0
Paraphrase This Document
Need a fresh take? Get an instant paraphrase of this document with our AI Paraphraser

Common shares outstanding 4071 4082 4096
Interpretation
Liquidity Ratios:- The liquidity ratios of the company shows the ability to meet the short term
liabilities and obligations of the business (Financial Ratio Analysis, 2021). This is done by
ascertaining the availability of current assets of the company that are easily convertible to cash.
The three of current, quick and net working capital ratios show the liquidity position of the
business. The above table depicts that Swifty Motors is having comparatively better position as
its current assets are higher than current liabilities but the Gogo Motors is experiencing a tighter
liquidity position (Zolfani, Yazdani and Zavadskas, 2018).
Profitability Ratios:- The profitability ratios of the company shows the percentage of earnings
over the revenues that are generated within the period. The higher is the profitability for the
business the better are the chances for growth and sustainability of the business. From the above
ratio analysis that is made it can be ascertained that the profitability position of Gogo Motors is
higher and consistent in nature as compared to the Swifty Motors who has also generated
negative returns in some periods (Zavadskas and et.al., 2018).
Solvency ratios:- The solvency ratio of the company shows the capital structure that is opted by
the business in terms of the debt equity ratio. It can be evidently noticed in both the companies
whose financial statements are being compared, that they are using similar capital structure
where majority of the funds are obtained from the debt capital imposing fixed financial charges
on the business.
Efficiency Ratios:- The efficiency ratio considers the efficiency with which the assets and
resources in the organization are used to generate the organizational performance for the
company (Walmsley and et.al., 2018). The ratio analysis shows that Swifty Motors is
comparatively more efficiency in managing its receivables and other assets of the business.
Market Prospects Ratios:- The market prospect ratio shows the benefit that is extended to the
shareholders in terms of the dividend (Zolfani and Chatterjee, 2019). The comparison of earnings

per share of Gogo Motors and Swifty Motors shows that better returns are available to the equity
shareholders of Gogo Motors. This is because the profitability of the business is higher.
Suggestion
It would be suggested that pertaining to the investment advice and in order to generate
better above average returns the client must go for investing in the Gogo Motors as it is more
profitable business venture and has earnings available for the equity shareholders of the business.
It has better earnings per share which can be converted to dividends in the short run which is
beneficial for the investor.
CONCLUSION
It can be summarized that ratio analysis is important and facilitates comparison among
the businesses which makes the choices of the investor easy and feasible. It assists in making
well informed decisions.
⊘ This is a preview!⊘
Do you want full access?
Subscribe today to unlock all pages.

Trusted by 1+ million students worldwide

REFERENCES
Zolfani, S. H., Yazdani, M. and Zavadskas, E. K., 2018. An extended stepwise weight
assessment ratio analysis (SWARA) method for improving criteria prioritization process. Soft
Computing. 22(22). pp.7399-7405.
Zavadskas, E.K. and et.al., 2018. A novel multicriteria approach–rough step-wise weight
assessment ratio analysis method (R-SWARA) and its application in logistics. Studies in
Informatics and Control. 27(1). pp.97-106.
Walmsley, T.G. and et.al., 2018. Energy Ratio analysis and accounting for renewable and non-
renewable electricity generation: A review. Renewable and Sustainable Energy Reviews. 98.
pp.328-345.
Zolfani, S. H. and Chatterjee, P., 2019. Comparative evaluation of sustainable design based on
Step-Wise Weight Assessment Ratio Analysis (SWARA) and Best Worst Method (BWM)
methods: a perspective on household furnishing materials. Symmetry. 11(1). p.74.
Online
Paraphrase This Document
Need a fresh take? Get an instant paraphrase of this document with our AI Paraphraser

Financial Ratio Analysis. 2021. [Online] Available through: <
https://www.myaccountingcourse.com/financial-ratios/>
1 out of 11
Related Documents

Your All-in-One AI-Powered Toolkit for Academic Success.
 +13062052269
info@desklib.com
Available 24*7 on WhatsApp / Email
Unlock your academic potential
Copyright © 2020–2025 A2Z Services. All Rights Reserved. Developed and managed by ZUCOL.