HFR603 Hotel Finance & Revenue: Financial Analysis of Golf Clubs
VerifiedAdded on 2023/06/15
|13
|3574
|378
Case Study
AI Summary
This case study provides a comparative financial analysis of Oatlands Golf Club and Wollongong Golf Club, focusing on key financial ratios to assess their liquidity, solvency, and profitability. The analysis includes current ratio, quick ratio, accounts receivable turnover, debt-to-equity ratio, interest coverage, return on assets, and return on equity. The study reveals that Wollongong Golf Club demonstrates a stronger financial position with increasing trends in liquidity and profitability ratios compared to Oatlands Golf Club. The document is available on Desklib, a platform offering study tools and resources for students.
Running head: HOTEL FINANCE AND REVENUE
Hotel Finance and Revenue
Name of Student:
Name of University:
Author’s Note:
Hotel Finance and Revenue
Name of Student:
Name of University:
Author’s Note:
Paraphrase This Document
Need a fresh take? Get an instant paraphrase of this document with our AI Paraphraser
1HOTEL FINANCE AND REVENUE
Table of Contents
Introduction......................................................................................................................................2
Oatlands Golf Club..........................................................................................................................3
Ratio Analysis..............................................................................................................................3
Wollongong Golf Club Limited.......................................................................................................5
Ratio Analysis..............................................................................................................................6
Conclusion.......................................................................................................................................8
2HOTEL FINANCE AND REVENUE
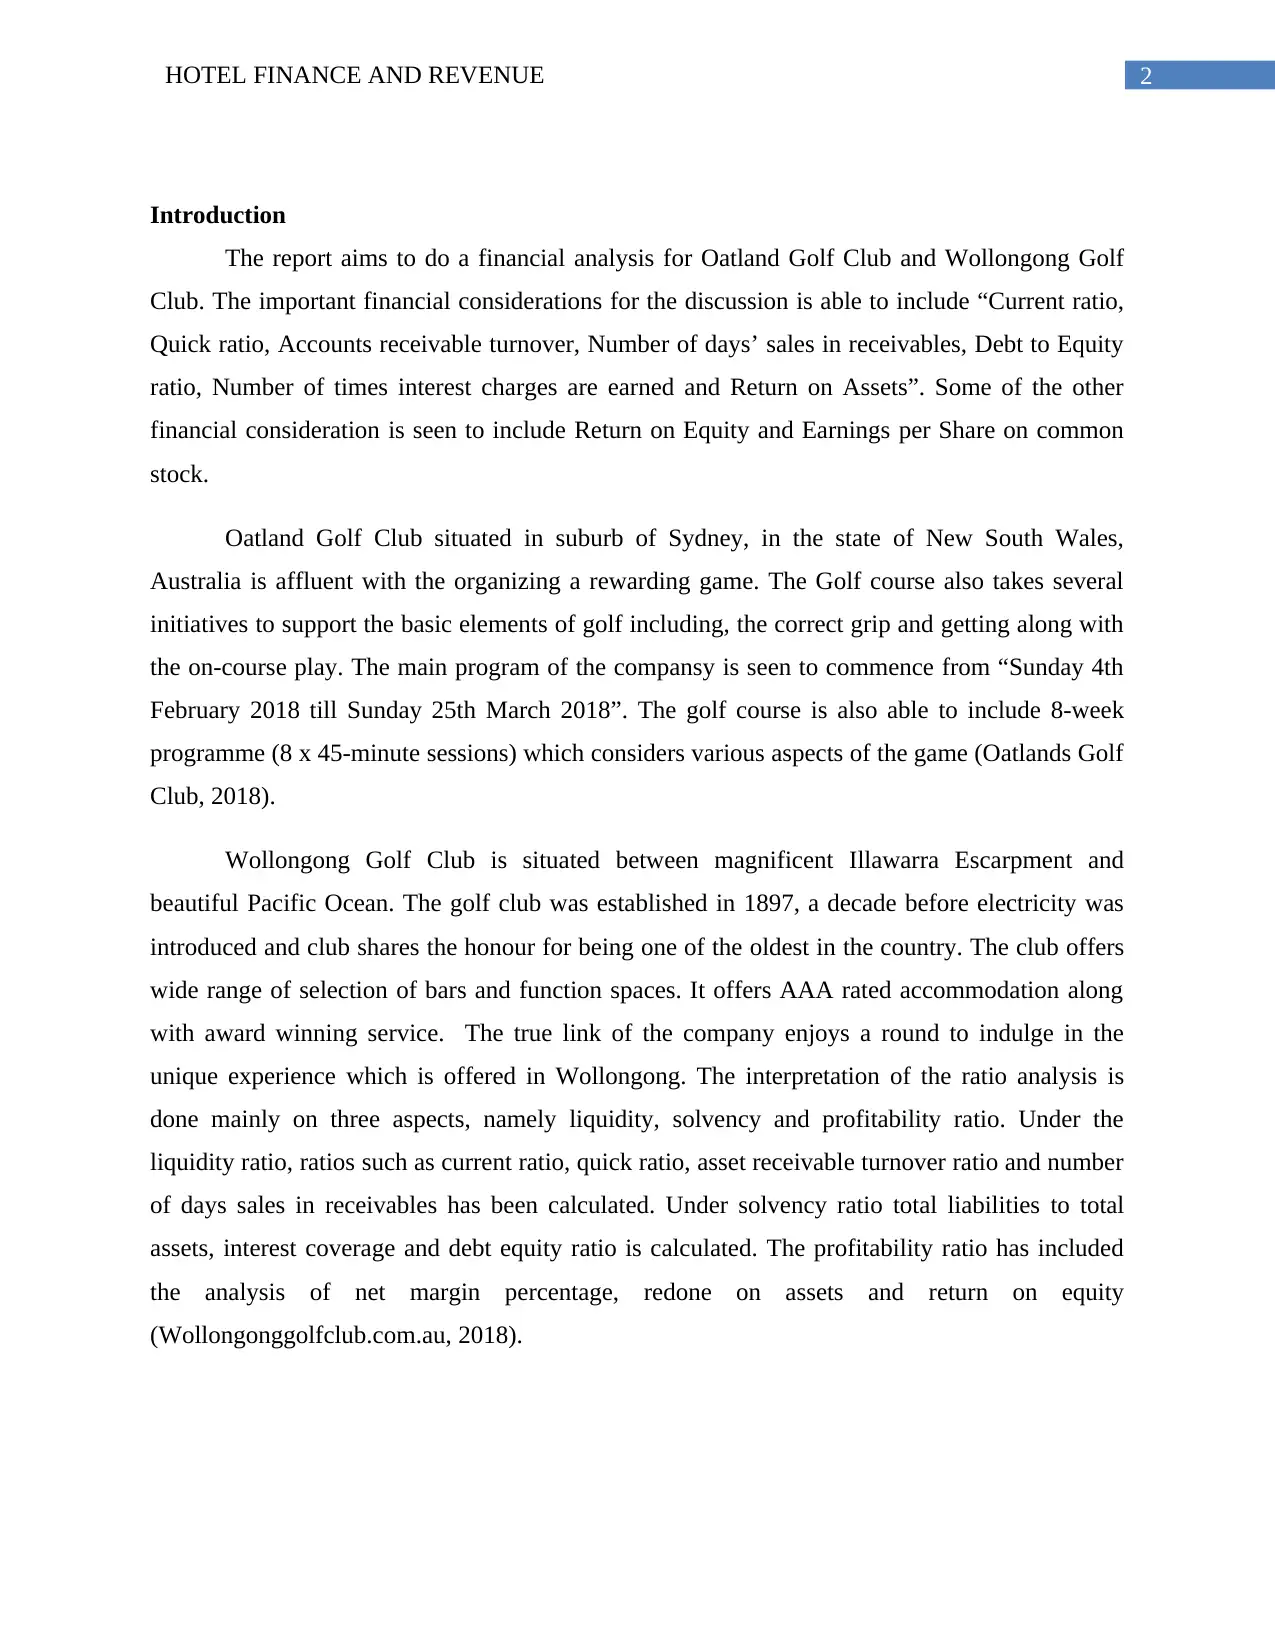
Introduction
The report aims to do a financial analysis for Oatland Golf Club and Wollongong Golf
Club. The important financial considerations for the discussion is able to include “Current ratio,
Quick ratio, Accounts receivable turnover, Number of days’ sales in receivables, Debt to Equity
ratio, Number of times interest charges are earned and Return on Assets”. Some of the other
financial consideration is seen to include Return on Equity and Earnings per Share on common
stock.
Oatland Golf Club situated in suburb of Sydney, in the state of New South Wales,
Australia is affluent with the organizing a rewarding game. The Golf course also takes several
initiatives to support the basic elements of golf including, the correct grip and getting along with
the on-course play. The main program of the compansy is seen to commence from “Sunday 4th
February 2018 till Sunday 25th March 2018”. The golf course is also able to include 8-week
programme (8 x 45-minute sessions) which considers various aspects of the game (Oatlands Golf
Club, 2018).
Wollongong Golf Club is situated between magnificent Illawarra Escarpment and
beautiful Pacific Ocean. The golf club was established in 1897, a decade before electricity was
introduced and club shares the honour for being one of the oldest in the country. The club offers
wide range of selection of bars and function spaces. It offers AAA rated accommodation along
with award winning service. The true link of the company enjoys a round to indulge in the
unique experience which is offered in Wollongong. The interpretation of the ratio analysis is
done mainly on three aspects, namely liquidity, solvency and profitability ratio. Under the
liquidity ratio, ratios such as current ratio, quick ratio, asset receivable turnover ratio and number
of days sales in receivables has been calculated. Under solvency ratio total liabilities to total
assets, interest coverage and debt equity ratio is calculated. The profitability ratio has included
the analysis of net margin percentage, redone on assets and return on equity
(Wollongonggolfclub.com.au, 2018).
⊘ This is a preview!⊘
Do you want full access?
Subscribe today to unlock all pages.
Trusted by 1+ million students worldwide
3HOTEL FINANCE AND REVENUE
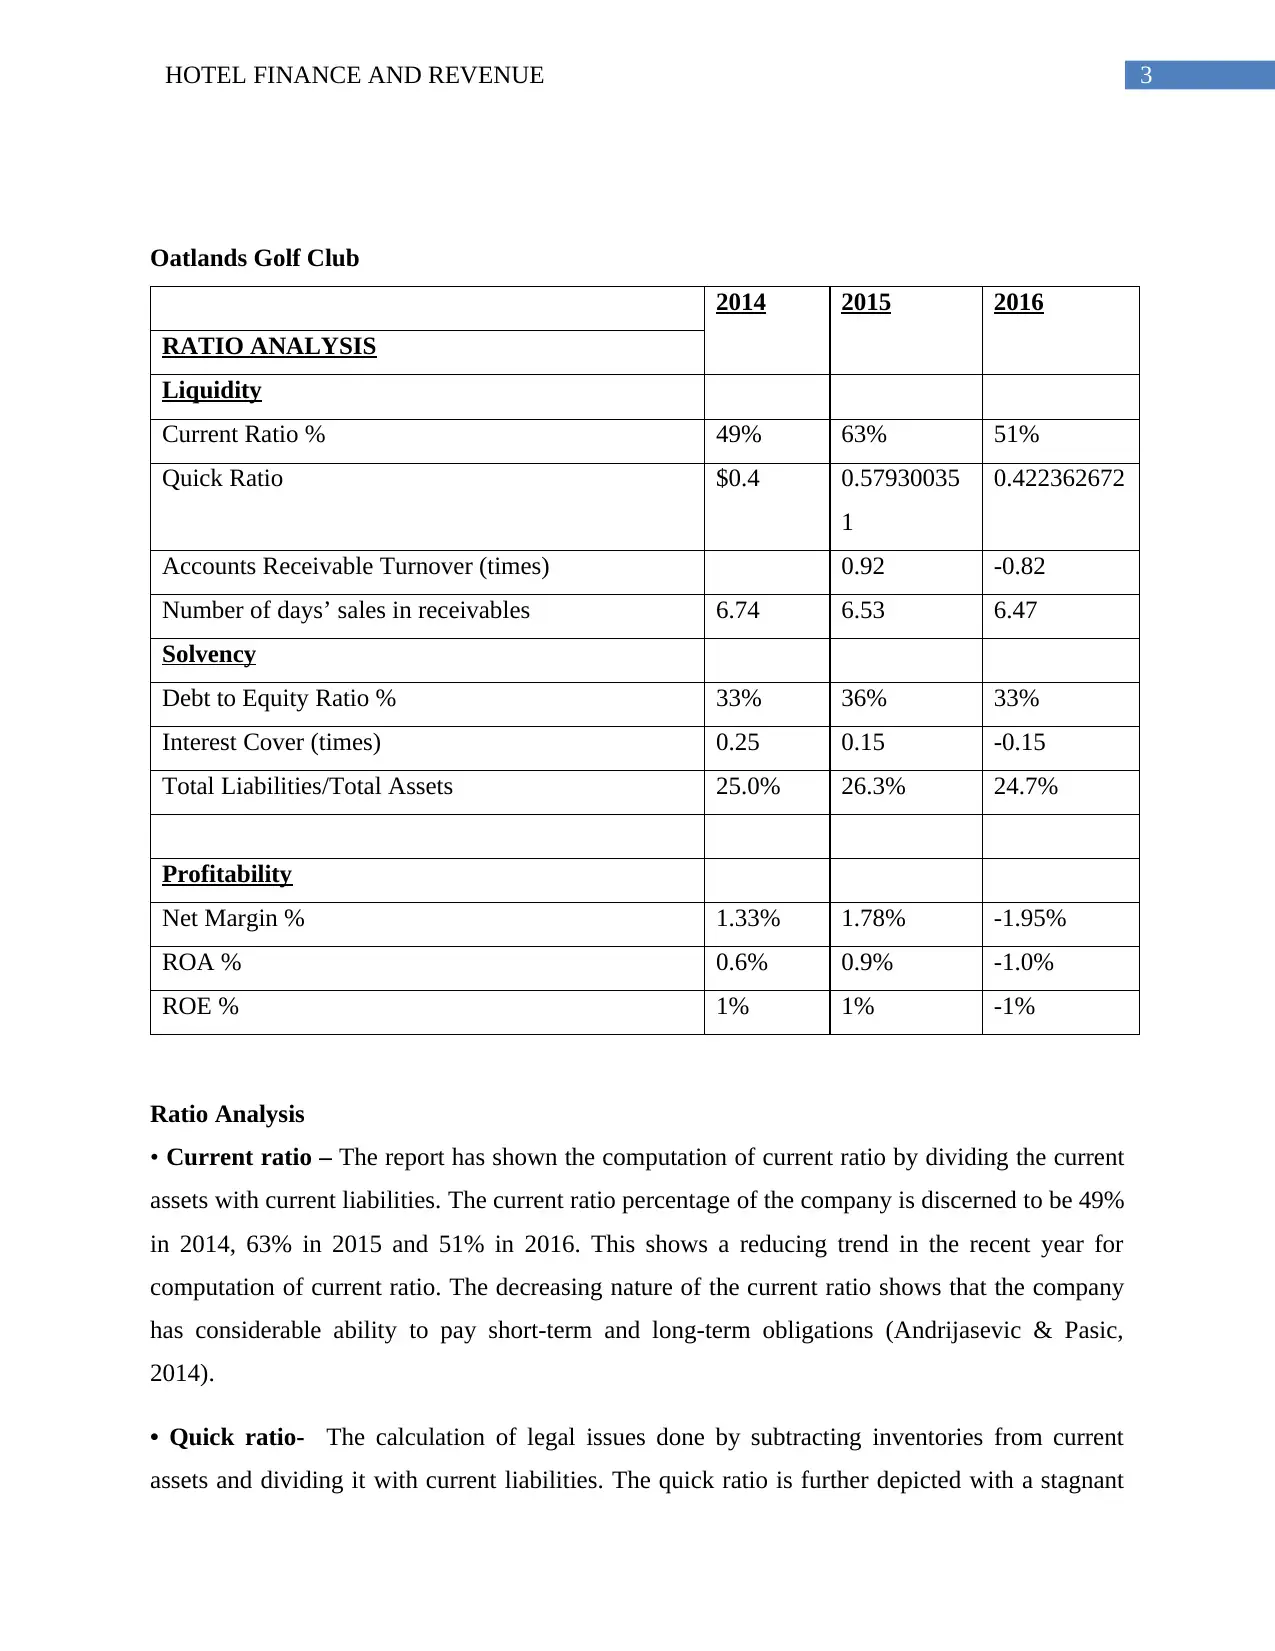
Oatlands Golf Club
2014 2015 2016
RATIO ANALYSIS
Liquidity
Current Ratio % 49% 63% 51%
Quick Ratio $0.4 0.57930035
1
0.422362672
Accounts Receivable Turnover (times) 0.92 -0.82
Number of days’ sales in receivables 6.74 6.53 6.47
Solvency
Debt to Equity Ratio % 33% 36% 33%
Interest Cover (times) 0.25 0.15 -0.15
Total Liabilities/Total Assets 25.0% 26.3% 24.7%
Profitability
Net Margin % 1.33% 1.78% -1.95%
ROA % 0.6% 0.9% -1.0%
ROE % 1% 1% -1%
Ratio Analysis
• Current ratio – The report has shown the computation of current ratio by dividing the current
assets with current liabilities. The current ratio percentage of the company is discerned to be 49%
in 2014, 63% in 2015 and 51% in 2016. This shows a reducing trend in the recent year for
computation of current ratio. The decreasing nature of the current ratio shows that the company
has considerable ability to pay short-term and long-term obligations (Andrijasevic & Pasic,
2014).
• Quick ratio- The calculation of legal issues done by subtracting inventories from current
assets and dividing it with current liabilities. The quick ratio is further depicted with a stagnant
Paraphrase This Document
Need a fresh take? Get an instant paraphrase of this document with our AI Paraphraser
4HOTEL FINANCE AND REVENUE
trend of 0.42 in 2014, 0.58 in 2015 and 0.42 in 2016. Short-term liquidity has not depicted any
significant increase in performance in 2016. The decrease in the value of both quick ratio and
current ratio is evident with the evaluation of the movement in the values of annual report which
clearly shows that from 2014 to 2015 there was an increase in current assets by 40%, from 2015-
16 the current assets got reduced by 20% (Evans & Mathur, 2014).
• Accounts receivable turnover- This ratio has been used to measure the effectiveness of the
firm in collecting debts and extending credit. Receivables turnover ratio has stated that in 2015,
the company was able to efficiently utilize its assets and this is reflected with Accounts
Receivable turnover ratio of 0.92 times. However, due to significant increase in the collection
period in 2016, the ratio was discerned as -0.82. The calculation of receivables turnover ratio is
done by dividing the net credit sales value by average accounts receivable. The main
consideration of the calculation is done on annual basis (Lakshmi, Martin, & Venkatesan, 2016).
• Number of days’ sales in receivables- The computation of DSR is seen with dividing the
Accounts Receivable by average sales per day. The company has shown a decreasing and then
increasing trend of number of days sales in receivable. This is evident with 6.74 days in 2014,
6.5 days in 2015 and 6.4 days in 2016. The decreasing trend of number of days since in
receivables over time clearly shows that the company that the company is selling its product to
customers on credit and taking significantly less time to collect money (Adedeji, 2014).
• Debt to Equity ratio- The depiction of debt-to equity ratio is seen to be done with diving the
total long-term borrowings by total capital. A deeper understanding of the debt equity ratio for
Oatlands Golf Club has able to show that the company has significantly able to reduce its debt
equity ratio which is a positive sign. The lowering value of the debt equity ratio indicates that
that there is a less relation of proportion of shareholders' equity and debt used to finance a
company's assets. The lowering value of debt equity ratio is evident with 0.33 in 2014, 0.35 in
2015 and 0.32 in 2016 (Islam, 2014).
• Number of times interest charges are earned- The consideration for this ratio clearly shows
how easily company is able to pay interest expenses on the outstanding debt. The consideration
of Interest Cover (times) is seen with a decreasing trend. This is evident with 0.25 in 2014, 0.15
5HOTEL FINANCE AND REVENUE
in 2015 and -0.15 in 2016. Due to a significantly low interest charges on in 2016, the golf club is
burdened by debt expense over the time (Shah & Jan, 2014).
• Return on Assets- Return on assets acts as the main indicator to illustrate the profit of the
company in terms of total assets. In the given case, it is calculated by dividing the total earnings
by total assets. Henceforth, it is not able to generate enough net income by total assets. As per
the analysis of Oatlands Golf Course, the return on asset has first increased from 0.6% to 0.9% in
2015. However, the profit in terms of assets has reduced in 2016, which is evident with a return
on asset ratio of -1% in 2016 (Grohmann, Kouwenberg, & Menkhoff, 2015).
• Return on Equity- This is discerned as the amount of net income in terms of percentage of
shareholders equity. ROE is discerned as corporation’s profitability by revealing based on the
amount of profit company generates from the invested amount by the shareholders. The
evaluation of this ratio is done by dividing net income by shareholders equity. Based on the
given scenario Oatlands Golf Club has first depicted a stagnant and then a decreasing return on
equity. This is evident with ROE of 1% in 2014 and 2015, followed with a decrease of 1% in
2016. The decreasing trend of ROA clearly suggests that company is not able to generate
sufficient profit from the amount of investment made by the shareholder (Zainudin & Hashim,
2016).
Wollongong Golf Club Limited
2013 2014 2015
RATIO ANALYSIS
Liquidity
Current Ratio % 96% 88% 149%
Quick Ratio 0.91388644
6
0.86913109
1
1.47001855
5
Accounts Receivable Turnover (times) -0.62 1.00
Number of days’ sales in receivables 7.65 7.53 6.86
Solvency
⊘ This is a preview!⊘
Do you want full access?
Subscribe today to unlock all pages.
Trusted by 1+ million students worldwide
6HOTEL FINANCE AND REVENUE
Debt to Equity Ratio % 12% 9% 5%
Interest Cover (times) -0.23 -0.39 0.20
Total Liabilities/Total Assets 101.9% 108.2% 69.8%
Profitability
Net Margin % -4.79% -2.88% 3.63%
ROA % -15.9% -13.6% 20.4%
ROE % -2% -1% 2%
Ratio Analysis
• Current ratio – Wollongong Golf Club Limited is comparatively in a much better position in
terms of current ratio than Oatlands Golf Club. It has sufficient current assets such as cash,
accounts receivables, inventories and prepaid expenses to bear the short-term and long-term
obligations. This is seen to be evident with a current ratio of 0.96 and 2013, 0.88 and 2014 and
1.48 and 2015. The increasing trend of current ratio clearly suggests that Wollongong Golf Club
Limited will be able to meet all short-term capital requirement (Rakićević, Milošević, Petrović,
& Radojević, 2016).
• Quick ratio- Similar to the current ratio, the quick ratio of the company is depicted with an
increasing trend. This is evident with a quick ratio of 0.91 and 2013, 0.87 in 2014 and 1.47 in
2015. The increasing nature of the quick ratio shows that Wollongong Golf Club Limited is
experiencing a solid top line growth thereby converting the receivables into cash to meet the
financial obligations. Based on such increasing growth rate of acid test ratio can be said that the
golf club has a faster inventory turnover and cash conversion cycles (Richardson, Lanis, &
Taylor, 2015).
• Accounts receivable turnover- The interpretations as per Accounts Receivable turnover is
also increasing in nature. This is evident with Accounts Receivable of -0.62 in 2014 which
increased to 1 in 2016. The linear growth in this ratio shows that the golf club is efficient enough
in collecting debts and extending credit (Xu et al., 2014).
Paraphrase This Document
Need a fresh take? Get an instant paraphrase of this document with our AI Paraphraser
7HOTEL FINANCE AND REVENUE
• Number of days’ sales in receivables-In this area also the company has made a significant
improvement. Wollongong Golf Club, has reduced time taken to collect the money from
customers after providing them the services on credit. The growth in Number of days’ sales in
receivables is evident with 7.65 days in 2014 which further reduced down to 7.53 days in 2015
and 6 .86 days in 2016 (Omar, Koya, Sanusi, & Shafie, 2014).
• Debt to Equity ratio- The debt equity ratio is expressed in terms of percentage and reducing
trend of percentage over the years clearly states that the company is able to make a significant
progress in reducing the reliance of shareholders' equity and debt for financing the assets of the
company. In 2014, the debt-to-equity ratio of Wollongong Golf Club was 12%, which reduced to
9% in 2015 and 2016 it got reduced by 5%. This has been depicted with the reducing trend of
long-term debt over the years, which is evident with long-term debt of $ 623972 in 2014, $
327415 in 2015 and $ 40851 in 2016 (Normah et al., 2014).
• Number of times interest charges are earned- The time taken to pay the interest amount on
the outstanding debt has been considered with the increasing trend. This is evident with interest
coverage ratio of -0.23 in 2014, -0.39 in 2015 and 0.20 in 2016 (Adewuyi, 2016).
• Return on Assets- The illustrations as per this ratio clearly suggests that the company is able to
generate enough net income in terms of total assets. The return on assets have increased from -
15.9% in 2014 to -13.6% in 2015 and the significant rise in the growth was evident with 20.4%
in 2016. This clearly shows that Wollongong Golf Club is in a stable position to generate income
from the available assets (Hoberg & Maksimovic, 2015).
• Return on Equity- The interpretations of this seen with corporation’s profitability by revealing
based on the amount of profit company generates from the invested amount by the shareholders.
The company’s profitability based on the invested amount by the shareholders is depicted to
increase from -2% in 2014, -1% in 2015 and 2% in 2016 (Schoenmaker & Wierts, 2015).
8HOTEL FINANCE AND REVENUE
Conclusion
The discussion on ratio analysis is able to suggest that Wollongong Golf Club is in a
significantly better position despite of certain downtowns in 2014 and 2015. However, the
improvement in areas such as cash and cash equivalents, reduced short-term borrowing and
current maturities have significantly contributed to a better current ratio, quick ratio, accounts
receivables ratio and number of days’ sales in receivables in 2016. The interpretations as per
solvency ratio has also shown that the company’s debt to equity ratio is in a significantly better
position over the years. Henceforth, despite of certain downtowns in 2014 and 2015, it has been
able to recover its position by improving on overall financial management. The significant
improvement is seen with reducing the overall operating expenses over the years. Oatlands Golf
Club on the other hand, has been considered with the improving trend in 2014 and 2015 and a
reducing trend in 2016. The lowering value of the debt equity ratio indicates that that there is a
less relation of proportion of shareholders' equity and debt used to finance a company's assets.
The lowering value of debt equity ratio is evident with 0.33 in 2014, 0.35 in 2015 and 0.32 in
2016. In addition to this, Oatlands Golf Club is not able to generate enough net income by total
assets. As per the analysis of Oatlands Golf Course, the return on asset has first increased from
0.6% to 0.9% in 2015. However, the profit in terms of assets has reduced in 2016, which is
evident with a return on asset ratio of -1% in 2016. Wollongong Golf Club has sufficient current
assets such as cash, accounts receivables, inventories and prepaid expenses to bear the short-term
and long-term obligations. This is seen to be evident with a current ratio of 0.96 and 2013, 0.88
and 2014 and 1.48 and 2015. The increasing trend of current ratio clearly suggests that
Wollongong Golf Club Limited will be able to meet all short-term capital requirement.
Moreover, the interpretations as per Accounts Receivable turnover is also increasing in nature.
This is evident with Accounts Receivable of -0.62 in 2014 which increased to 1 in 2016. The
linear growth in this ratio shows that the golf club is efficient enough in collecting debts and
extending credit. The increasing nature of the quick ratio shows that Wollongong Golf Club
Limited is experiencing a solid top line growth thereby converting the receivables into cash to
meet the financial obligations. Based on such increasing growth rate of acid test ratio can be said
that the golf club has a faster inventory turnover and cash conversion cycles. These evaluations
clearly depict that Wollongong Golf Club is in a much better position than Oatlands Golf Club.
⊘ This is a preview!⊘
Do you want full access?
Subscribe today to unlock all pages.
Trusted by 1+ million students worldwide

9HOTEL FINANCE AND REVENUE
Paraphrase This Document
Need a fresh take? Get an instant paraphrase of this document with our AI Paraphraser
10HOTEL FINANCE AND REVENUE
References
Adedeji, E. A. (2014). A Tool for Measuring Organization Performance using Ratio Analysis.
Research Journal of Finance and Accounting, 5(19), 16–22.
Adewuyi, A. W. (2016). Ratio Analysis of Tesco Plc Financial Performance between 2010 and
2014 in Comparison to Both Sainsbury and Morrisons. Open Journal of Accounting,
5(July), 45–56. https://doi.org/10.4236/ojacct.2016.53006
Andrijasevic, M., & Pasic, V. (2014). a Blueprint of Ratio Analysis As Information Basis of
Corporation Financial Management. Problems of Management in the 21st Century, 9(2),
117–123. Retrieved from
http://ezproxy.library.capella.edu/login?url=http://search.ebscohost.com/login.aspx?
direct=true&db=bth&AN=99552651&site=ehost-live&scope=site
Evans, J. R., & Mathur, A. (2014). Retailing and the period leading up to the Great Recession: a
model and a 25-year financial ratio analysis of US retailing. International Review of Retail,
Distribution and Consumer Research, 24(1), 30–58.
https://doi.org/10.1080/09593969.2013.801360
"Get Started" & "Get Started Plus" - An introduction to the game of golf - Oatlands Golf Club.
(2018). Oatlands Golf Club. Retrieved 13 February 2018, from
https://www.oatlandsgolf.com.au/cms/golf/get-started-ogc/
Grohmann, A., Kouwenberg, R., & Menkhoff, L. (2015). Childhood roots of financial literacy.
Journal of Economic Psychology, 51, 114–133. https://doi.org/10.1016/j.joep.2015.09.002
Hoberg, G., & Maksimovic, V. (2015). Redefining financial constraints: A text-based analysis.
In Review of Financial Studies (Vol. 28, pp. 1312–1352). https://doi.org/10.1093/rfs/hhu089
Islam, M. A. (2014). An Analysis of the Financial Performance of National Bank Limited Using
Financial Ratio. Journal of Behavioural Economics, Finance, Entrepreneurship, Accounting
and Transport, 2(5), 121–129. https://doi.org/10.12691/jbe-2-5-3
Lakshmi, T. M., Martin, A., & Venkatesan, V. P. (2016). A Genetic Bankrupt Ratio Analysis
Tool Using a Genetic Algorithm to Identify Influencing Financial Ratios. IEEE
11HOTEL FINANCE AND REVENUE
Transactions on Evolutionary Computation, 20(1), 38–51.
https://doi.org/10.1109/TEVC.2015.2424313
Normah, O., Zuraidah, M. S., Amirah, J., & Intan Salwani, M. (2014). Predicting financial
stress and earning management using ratio analysis. Advances in Natural and Applied
Sciences, 8(8), 183–189. Retrieved from www.aensiweb.com/ANAS
Omar, N., Koya, R. K., Sanusi, Z. M., & Shafie, N. A. (2014). Financial Statement Fraud: A
Case Examination Using Beneish Model and Ratio Analysis. International Journal of
Trade, Economics and Finance, 5(2), 184–186. https://doi.org/10.7763/IJTEF.2014.V5.367
Our History. (2018). Wollongonggolfclub.com.au. Retrieved 13 February 2018, from
http://www.wollongonggolfclub.com.au/about-us/our-history
Rakićević, A., Milošević, P., Petrović, B., & Radojević, D. G. (2016). DuPont financial ratio
analysis using logical aggregation. In Advances in Intelligent Systems and Computing (Vol.
357, pp. 727–739). https://doi.org/10.1007/978-3-319-18416-6_57
Richardson, G., Lanis, R., & Taylor, G. (2015). Financial distress, outside directors and
corporate tax aggressiveness spanning the global financial crisis: An empirical analysis.
Journal of Banking and Finance, 52, 112–129.
https://doi.org/10.1016/j.jbankfin.2014.11.013
Schoenmaker, D., & Wierts, P. (2015). Regulating the financial cycle: An integrated approach
with a leverage ratio. Economics Letters, 136, 70–72.
https://doi.org/10.1016/j.econlet.2015.08.020
Shah, S. Q., & Jan, R. (2014). Analysis of Financial Performance of Private Banks in Pakistan.
Procedia - Social and Behavioral Sciences, 109, 1021–1025.
https://doi.org/10.1016/j.sbspro.2013.12.583
Xu, W., Xiao, Z., Dang, X., Yang, D. L., & Yang, X. L. (2014). Financial ratio selection for
business failure prediction using soft set theory. Knowledge-Based Systems, 63, 59–67.
https://doi.org/10.1016/j.knosys.2014.03.007
Zainudin, E. F., & Hashim, H. A. (2016). Detecting fraudulent financial reporting using
⊘ This is a preview!⊘
Do you want full access?
Subscribe today to unlock all pages.
Trusted by 1+ million students worldwide
1 out of 13
Related Documents


Your All-in-One AI-Powered Toolkit for Academic Success.
+13062052269
info@desklib.com
Available 24*7 on WhatsApp / Email
![[object Object]](/_next/static/media/star-bottom.7253800d.svg)
Unlock your academic potential
Copyright © 2020–2026 A2Z Services. All Rights Reserved. Developed and managed by ZUCOL.