University Project: Goodman Fielder Transportation Linear Programming
VerifiedAdded on 2023/06/03
|16
|3479
|225
Project
AI Summary
This project analyzes Goodman Fielder's bread distribution network in New Zealand using linear programming to minimize transportation costs. The study addresses three research questions: assessing the company's capacity to meet demand, identifying production capacity increases if needed, and determining optimal bread transportation from bakeries to demand centers. The project includes an executive summary, introduction to cost management, and a detailed overview of Goodman Fielder's background, including its operations and market position. It then constructs a linear programming model, defining data inputs (demand forecasts, production capacities, transportation costs and distances), an objective function to minimize costs, and constraints related to demand, production, transportation capacity, order size, and non-negative truckloads. The project aims to provide a practical solution to optimize the company's supply chain and improve its profitability.
Running head: GOODMAN FIELDER TRANSPORTATION LINEAR PRORGAMING PROBLEM 1
Goodman Fielder Transportation Linear
Programing Problem
Name
University
Date
Goodman Fielder Transportation Linear
Programing Problem
Name
University
Date
Paraphrase This Document
Need a fresh take? Get an instant paraphrase of this document with our AI Paraphraser
Goodman Fielder Transportation Linear Programming 2
I. Research Questions
Transportation costs form a significant part of the total operational costs of a
manufacturer. Finding an optimum solution to the case company is a food manufacturing
company which specializes on loafs, groceries, daily products and oils among others. The
company operates four bakeries that supply loaf to the Northern Island of New Zealand. The goal
of the current analysis is to demonstrate how linear programming can be used to minimize the
transportation costs for bread supplied to the Island. To do this, the analysis shall seek to answer
the following questions:
RQ1: Does the company have the baking capacity to meet the annual demand for its breads in
New Zealand’s Northern Island?
RQ2: If not, how should the company increase its production capacity to meet the demand?
RQ3: If yes, what amount of bread should be transported from each bakery to each demand
center to minimize the transportation costs?
II. Executive Summary
This report presents an application of linear programming to a practical problem. The
case company, Goodman Fielder, is a pastries and groceries wholesale. The company supplies its
customers in Northern Island of New Zealand from four bakeries. The linear programming
model aimed to find an optimal transportation solution that minimizes costs. The solution
obtained will allow the company to meet its demand in the most cost effective way.
III. Introduction
In today’s increasingly globalized and competitive business environment, cost
management is an important determiner of corporate profitability and sustainability. Cost
management involves a variety of approaches and strategies designed to lower the total costs
incurred in the production of goods and services (Bhimani, 2018). To achieve this, measures
must be taken to reduce the costs incurred at each stage in the supply chain. Some of the
common supply chain management approaches to minimizing costs include lean manufacturing,
scheduling, and inventory management (Oluwagbemiga, Olugbenga, & Zaccheaus, 2014). This
Goodman Fielder Transportation Linear Programming 3
report explores one of the most robust and commonly used approaches to minimizing
distribution costs, transportation costs and operational costs in general.
Transportation account for a significant cost of doing business for most contemporary
businesses. This is particularly important for companies that source bulk inputs from or supply
bulky goods to distant locations. For such businesses, there is a significant potential for cost cuts
through optimization of the transport network (Jackson, 2015). This case study explores the
potential benefits of applying linear programming techniques to minimize bread transportation
costs for Goodman Fielder NZ.
Goodman Fielder NZ is a subsidiary of the Singapore and Hong Kong owned food
processor and wholesaler Goodman Fielder. The company specializes in pastries including loafs
and groceries. In New Zealand, the company operates 13 bakeries which supply the country. Six
of these bakeries are located in the Northern Island. The six bakeries are located at different parts
of the Island and supply the entire Island (Goodman Fielder NZ, 2018). The demand of bread is
typically highest in urban centers; in this case 12 cities in the Island (Ibisworld, 2017). The
current analysis sought to explore how the company can optimize its transportation network to
reduce costs. This will improve the company’s profitability, sustainability and the company’s
competitive advantage in the increasingly competitive market.
IV. Industry Background
The New Zealand baking industry recorded $503 million in sales for the 2017 financial
year. In the last five years, the industry has recorded a decline in the market size at an average -
1.5%. The industry comprises of more than 1240 business. A majority of these business are small
scale bakeries including local hot bread shops and family run bakeries (Deloite, 2018). Such
businesses mostly bake and sell their products to end consumers at the same premises. However,
there is a glowing trend where customers increasingly prefer pre-packaged bread (pastries).
Typically, pre-packaged breads are manufactured by the few large plant bakers who distribute
them to supermarkets and other types of shops who then retail them to the end consumer
(Australia and New Zealand Banking Group, 2001). Goodman Fielder is a large scale baker.
⊘ This is a preview!⊘
Do you want full access?
Subscribe today to unlock all pages.
Trusted by 1+ million students worldwide
Goodman Fielder Transportation Linear Programming 4
V. Goodman Fielder Background
Goodman Fielder is a Singapore and Hong Kong owned food processer and wholesaler.
The company specializes in the production of based products including loaves, cakes and other
pastries, dairy products, oils and other foodstuffs. Unlike smaller bakeries who mostly sell all of
their products themselves, Goodman Fielder is a wholesaler. The company sells its products to
retailers who then sell to the ultimate consumers (NZ Ministry of Business, Innovation and
Employment, 2013).
The company’s business model has a few advantages and disadvantages. First, due to its
large scale capacity, the company enjoys the benefits of economies of scale. However, given its
supply chain, the final price of the bread includes the retailer’s premium (Duan, 2010). As such,
if all production costs are constant, the company’s loaves would sell at higher price than those
produced by small scale producers who do not sell via a middle man. The company can
compensate on this by exploiting its capacities to minimize other production costs. This will
allow competitive pricing and, hence, enhance profitability and competitive advantage.
As mentioned previously, the company operates six production plants in the Northern
Island (Goodman Fielder NZ, 2018). Figure 1 below show the locations of the plants. The Puhoi
Valley Cheese and Earnst Adams Palmerston North plants specialize in other products other than
bread. Consequently, only the other four production plants are considered as bread bakeries in
this analysis.
Paraphrase This Document
Need a fresh take? Get an instant paraphrase of this document with our AI Paraphraser
Goodman Fielder Transportation Linear Programming 5
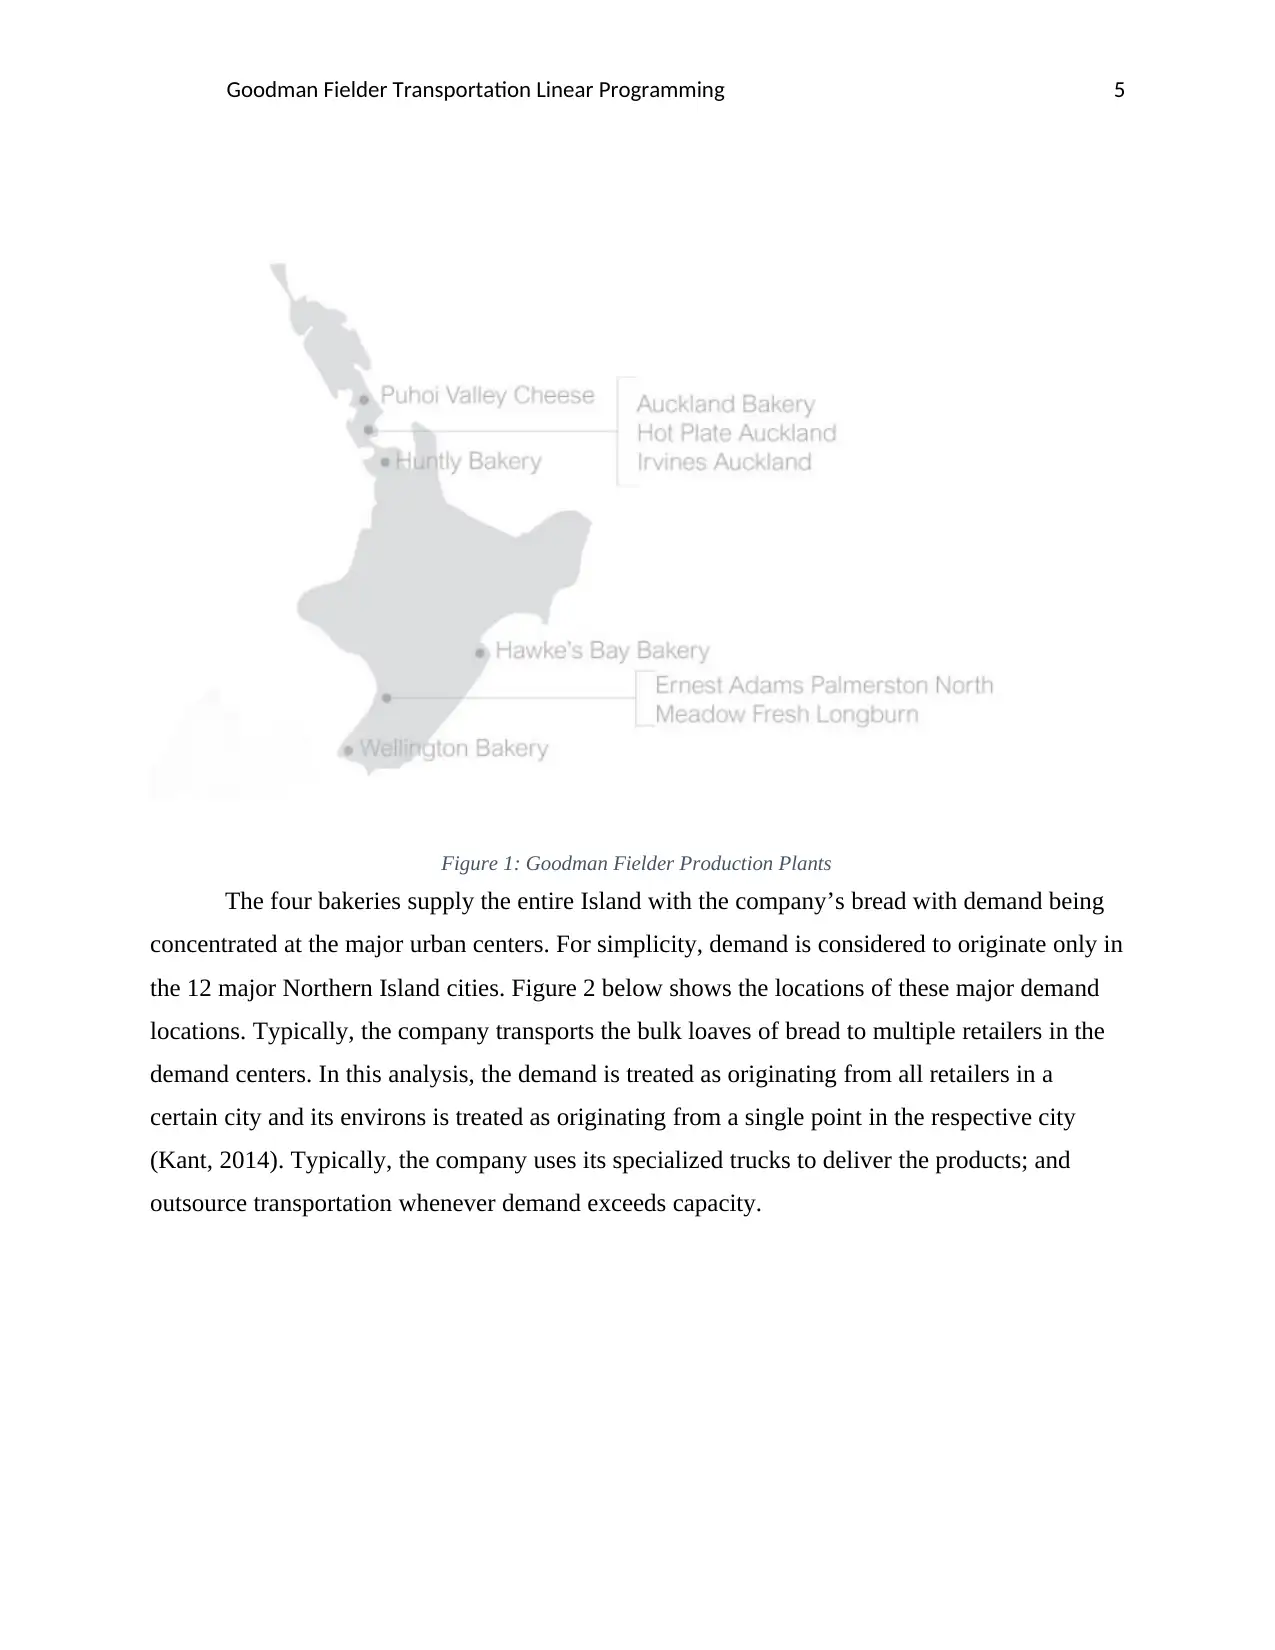
Figure 1: Goodman Fielder Production Plants
The four bakeries supply the entire Island with the company’s bread with demand being
concentrated at the major urban centers. For simplicity, demand is considered to originate only in
the 12 major Northern Island cities. Figure 2 below shows the locations of these major demand
locations. Typically, the company transports the bulk loaves of bread to multiple retailers in the
demand centers. In this analysis, the demand is treated as originating from all retailers in a
certain city and its environs is treated as originating from a single point in the respective city
(Kant, 2014). Typically, the company uses its specialized trucks to deliver the products; and
outsource transportation whenever demand exceeds capacity.
Goodman Fielder Transportation Linear Programming 6
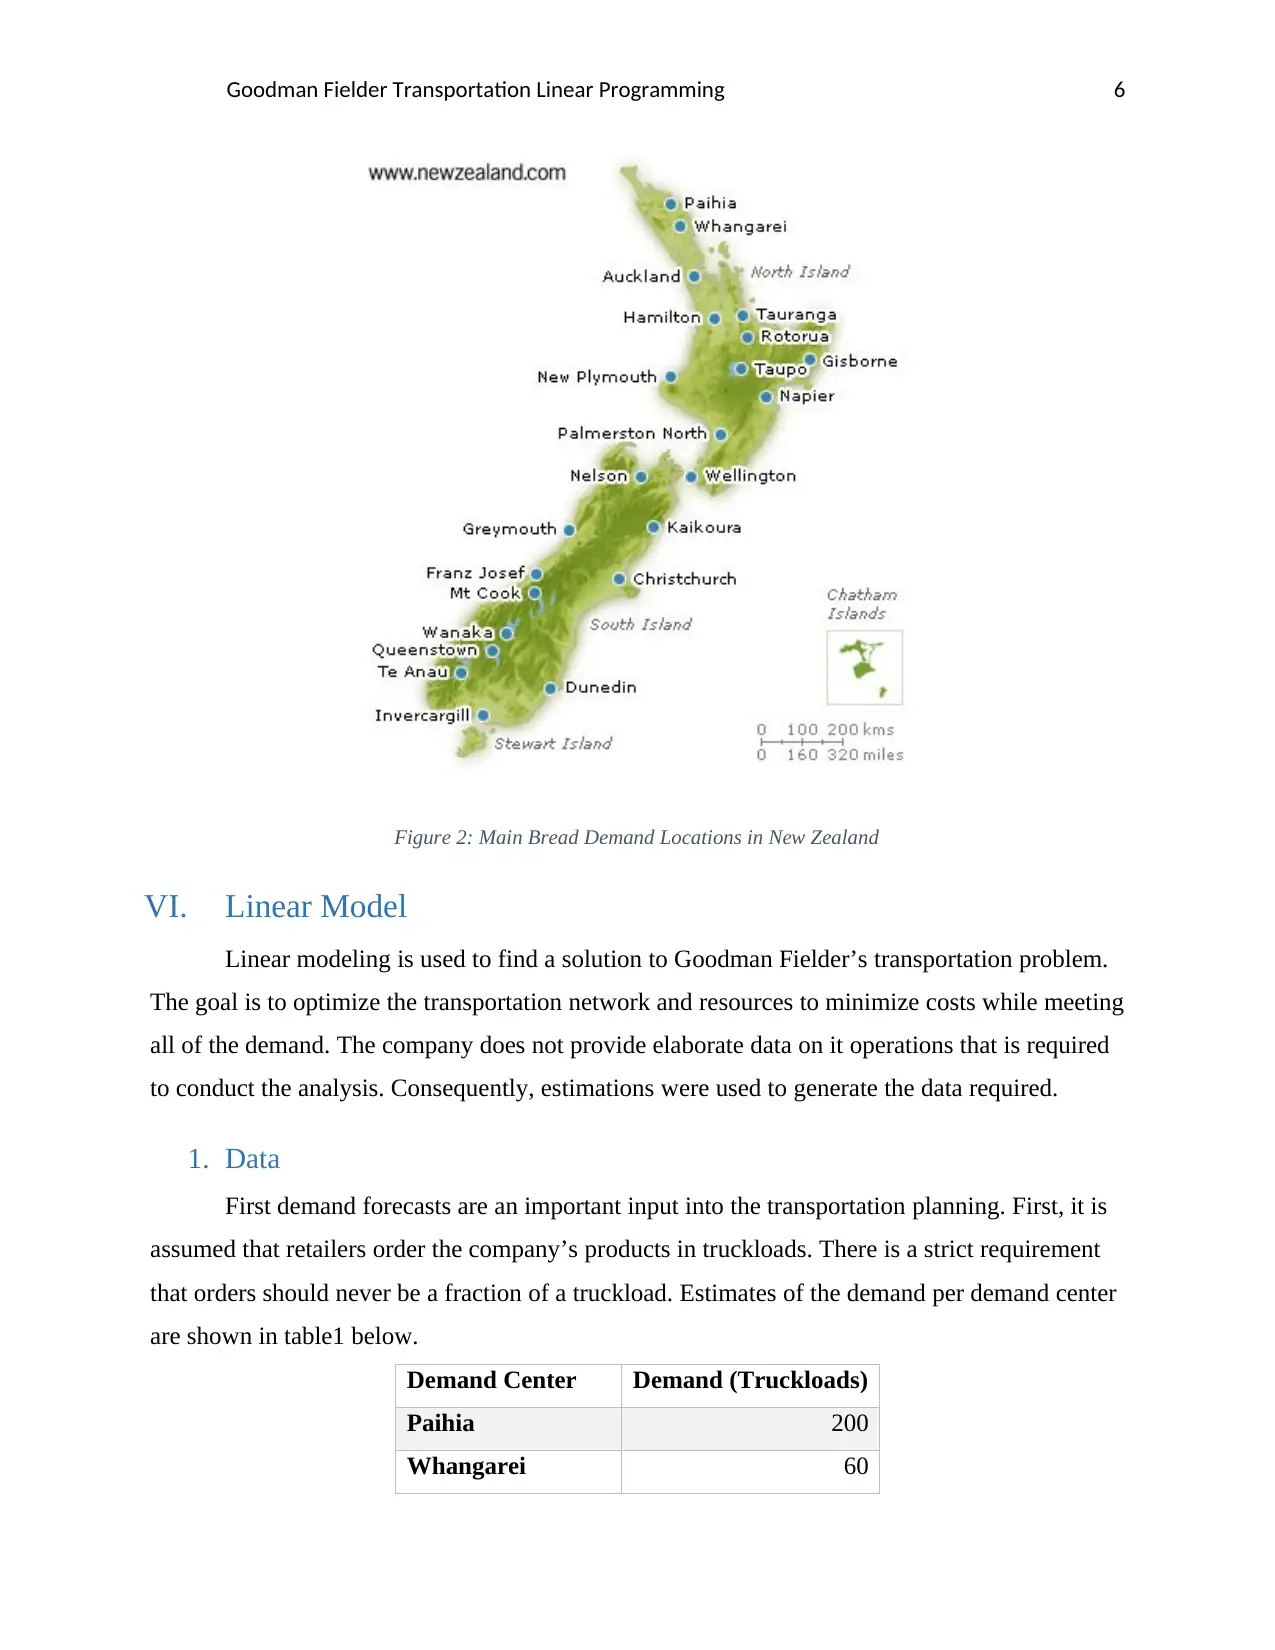
Figure 2: Main Bread Demand Locations in New Zealand
VI. Linear Model
Linear modeling is used to find a solution to Goodman Fielder’s transportation problem.
The goal is to optimize the transportation network and resources to minimize costs while meeting
all of the demand. The company does not provide elaborate data on it operations that is required
to conduct the analysis. Consequently, estimations were used to generate the data required.
1. Data
First demand forecasts are an important input into the transportation planning. First, it is
assumed that retailers order the company’s products in truckloads. There is a strict requirement
that orders should never be a fraction of a truckload. Estimates of the demand per demand center
are shown in table1 below.
Demand Center Demand (Truckloads)
Paihia 200
Whangarei 60
⊘ This is a preview!⊘
Do you want full access?
Subscribe today to unlock all pages.
Trusted by 1+ million students worldwide
Goodman Fielder Transportation Linear Programming 7
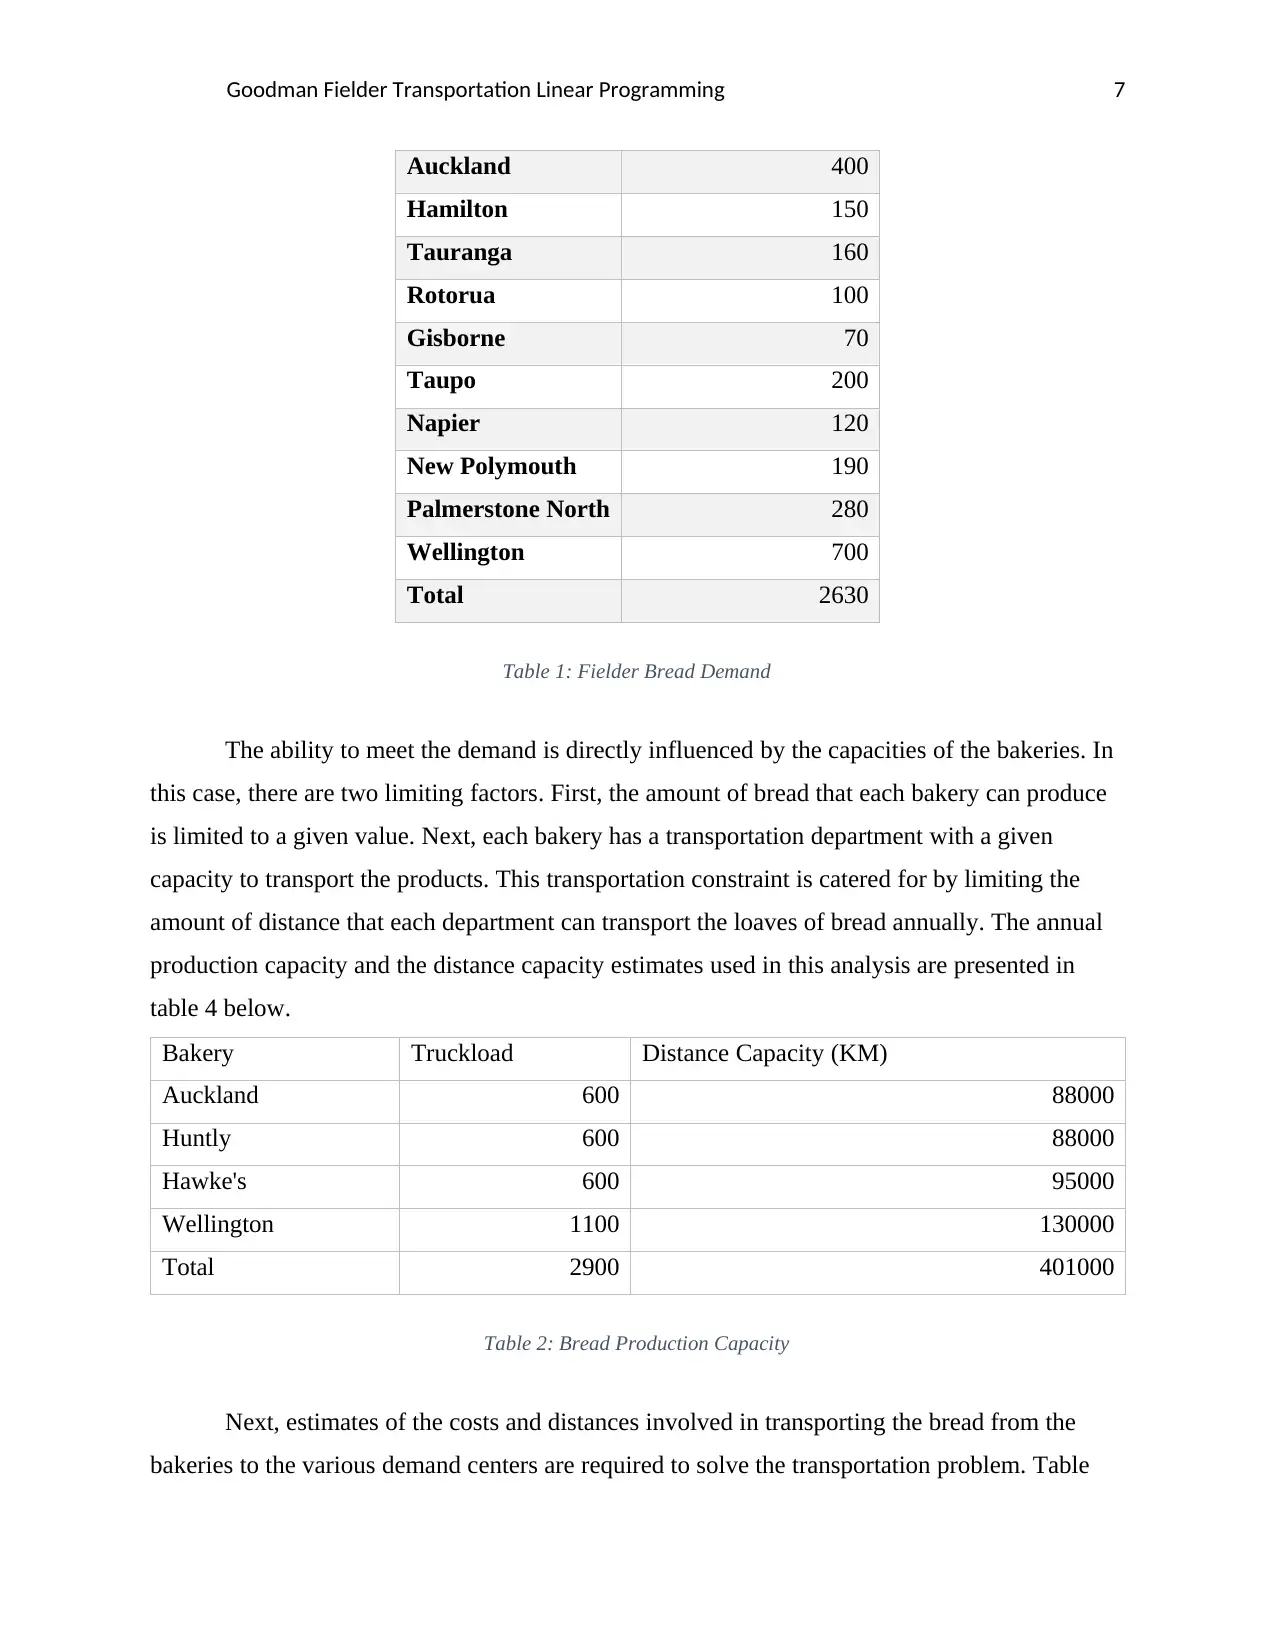
Auckland 400
Hamilton 150
Tauranga 160
Rotorua 100
Gisborne 70
Taupo 200
Napier 120
New Polymouth 190
Palmerstone North 280
Wellington 700
Total 2630
Table 1: Fielder Bread Demand
The ability to meet the demand is directly influenced by the capacities of the bakeries. In
this case, there are two limiting factors. First, the amount of bread that each bakery can produce
is limited to a given value. Next, each bakery has a transportation department with a given
capacity to transport the products. This transportation constraint is catered for by limiting the
amount of distance that each department can transport the loaves of bread annually. The annual
production capacity and the distance capacity estimates used in this analysis are presented in
table 4 below.
Bakery Truckload Distance Capacity (KM)
Auckland 600 88000
Huntly 600 88000
Hawke's 600 95000
Wellington 1100 130000
Total 2900 401000
Table 2: Bread Production Capacity
Next, estimates of the costs and distances involved in transporting the bread from the
bakeries to the various demand centers are required to solve the transportation problem. Table
Paraphrase This Document
Need a fresh take? Get an instant paraphrase of this document with our AI Paraphraser
Goodman Fielder Transportation Linear Programming 8
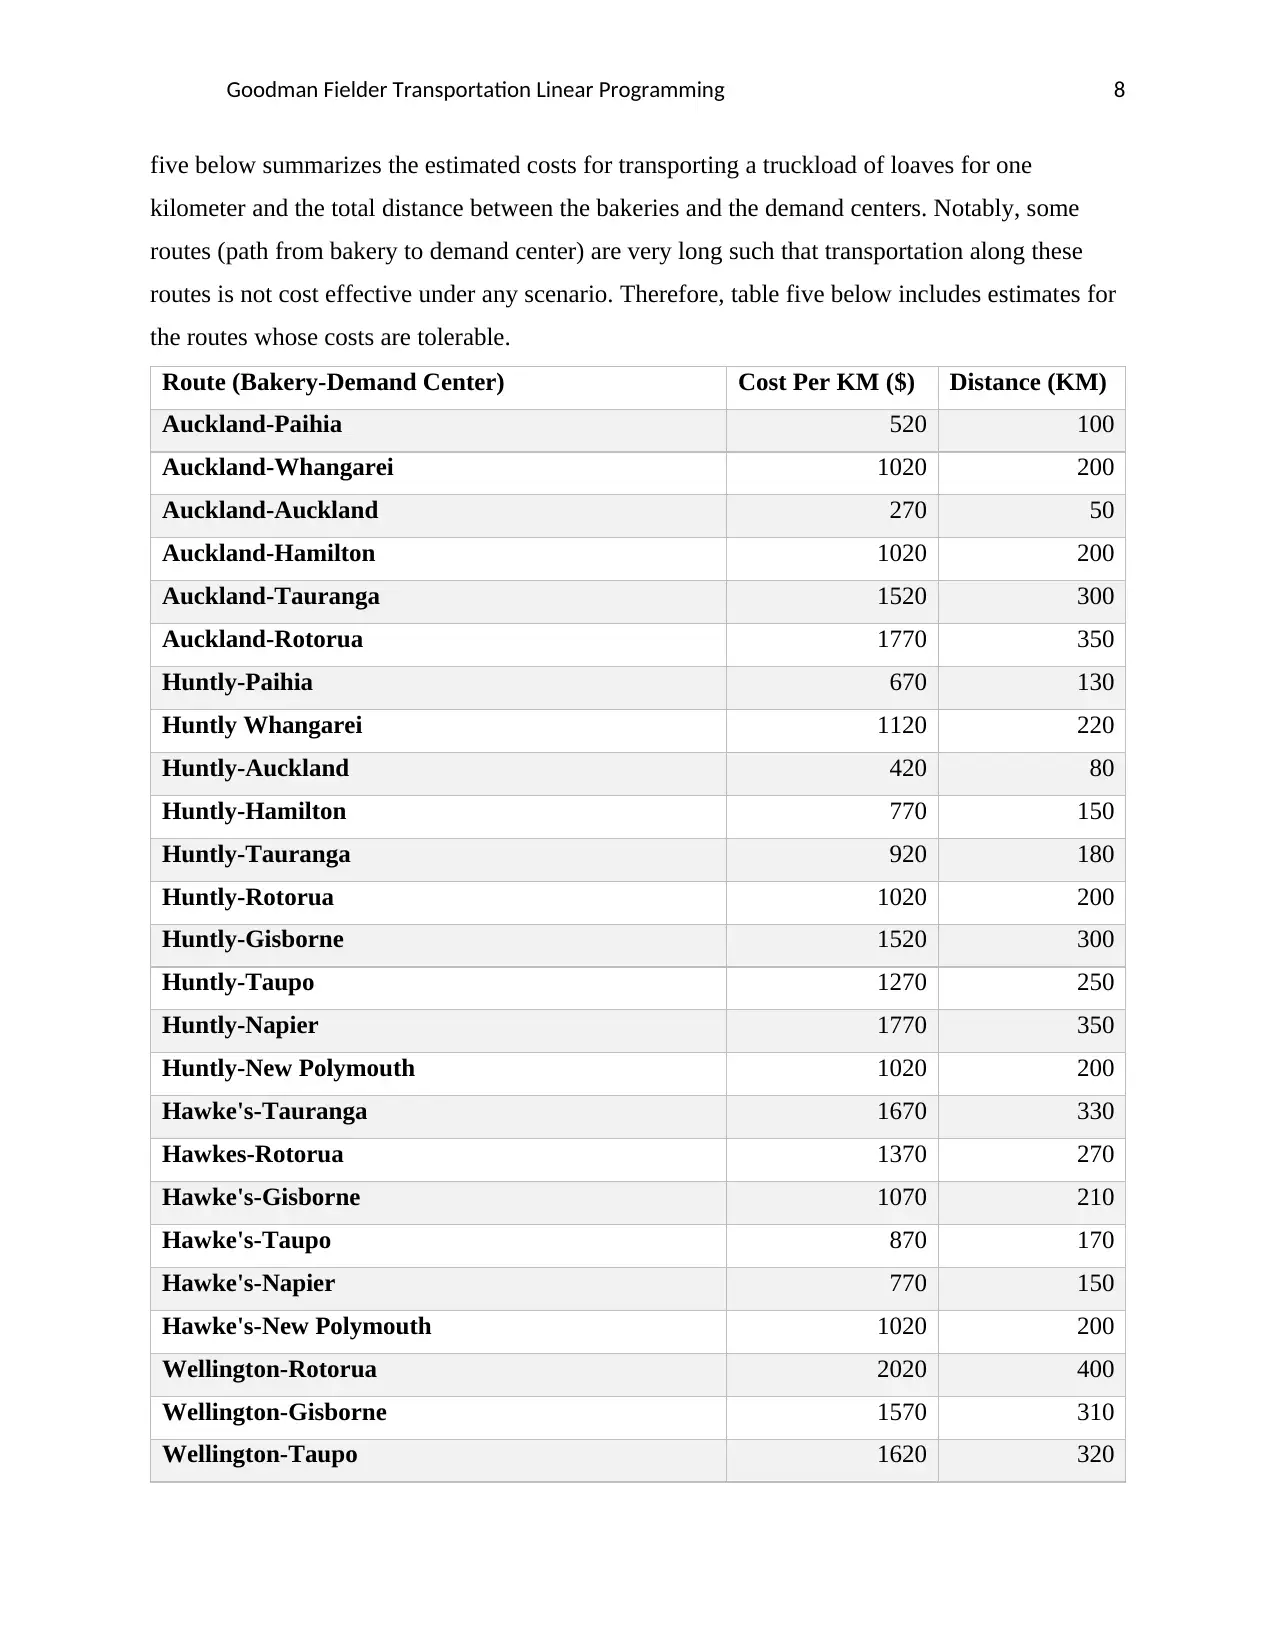
five below summarizes the estimated costs for transporting a truckload of loaves for one
kilometer and the total distance between the bakeries and the demand centers. Notably, some
routes (path from bakery to demand center) are very long such that transportation along these
routes is not cost effective under any scenario. Therefore, table five below includes estimates for
the routes whose costs are tolerable.
Route (Bakery-Demand Center) Cost Per KM ($) Distance (KM)
Auckland-Paihia 520 100
Auckland-Whangarei 1020 200
Auckland-Auckland 270 50
Auckland-Hamilton 1020 200
Auckland-Tauranga 1520 300
Auckland-Rotorua 1770 350
Huntly-Paihia 670 130
Huntly Whangarei 1120 220
Huntly-Auckland 420 80
Huntly-Hamilton 770 150
Huntly-Tauranga 920 180
Huntly-Rotorua 1020 200
Huntly-Gisborne 1520 300
Huntly-Taupo 1270 250
Huntly-Napier 1770 350
Huntly-New Polymouth 1020 200
Hawke's-Tauranga 1670 330
Hawkes-Rotorua 1370 270
Hawke's-Gisborne 1070 210
Hawke's-Taupo 870 170
Hawke's-Napier 770 150
Hawke's-New Polymouth 1020 200
Wellington-Rotorua 2020 400
Wellington-Gisborne 1570 310
Wellington-Taupo 1620 320
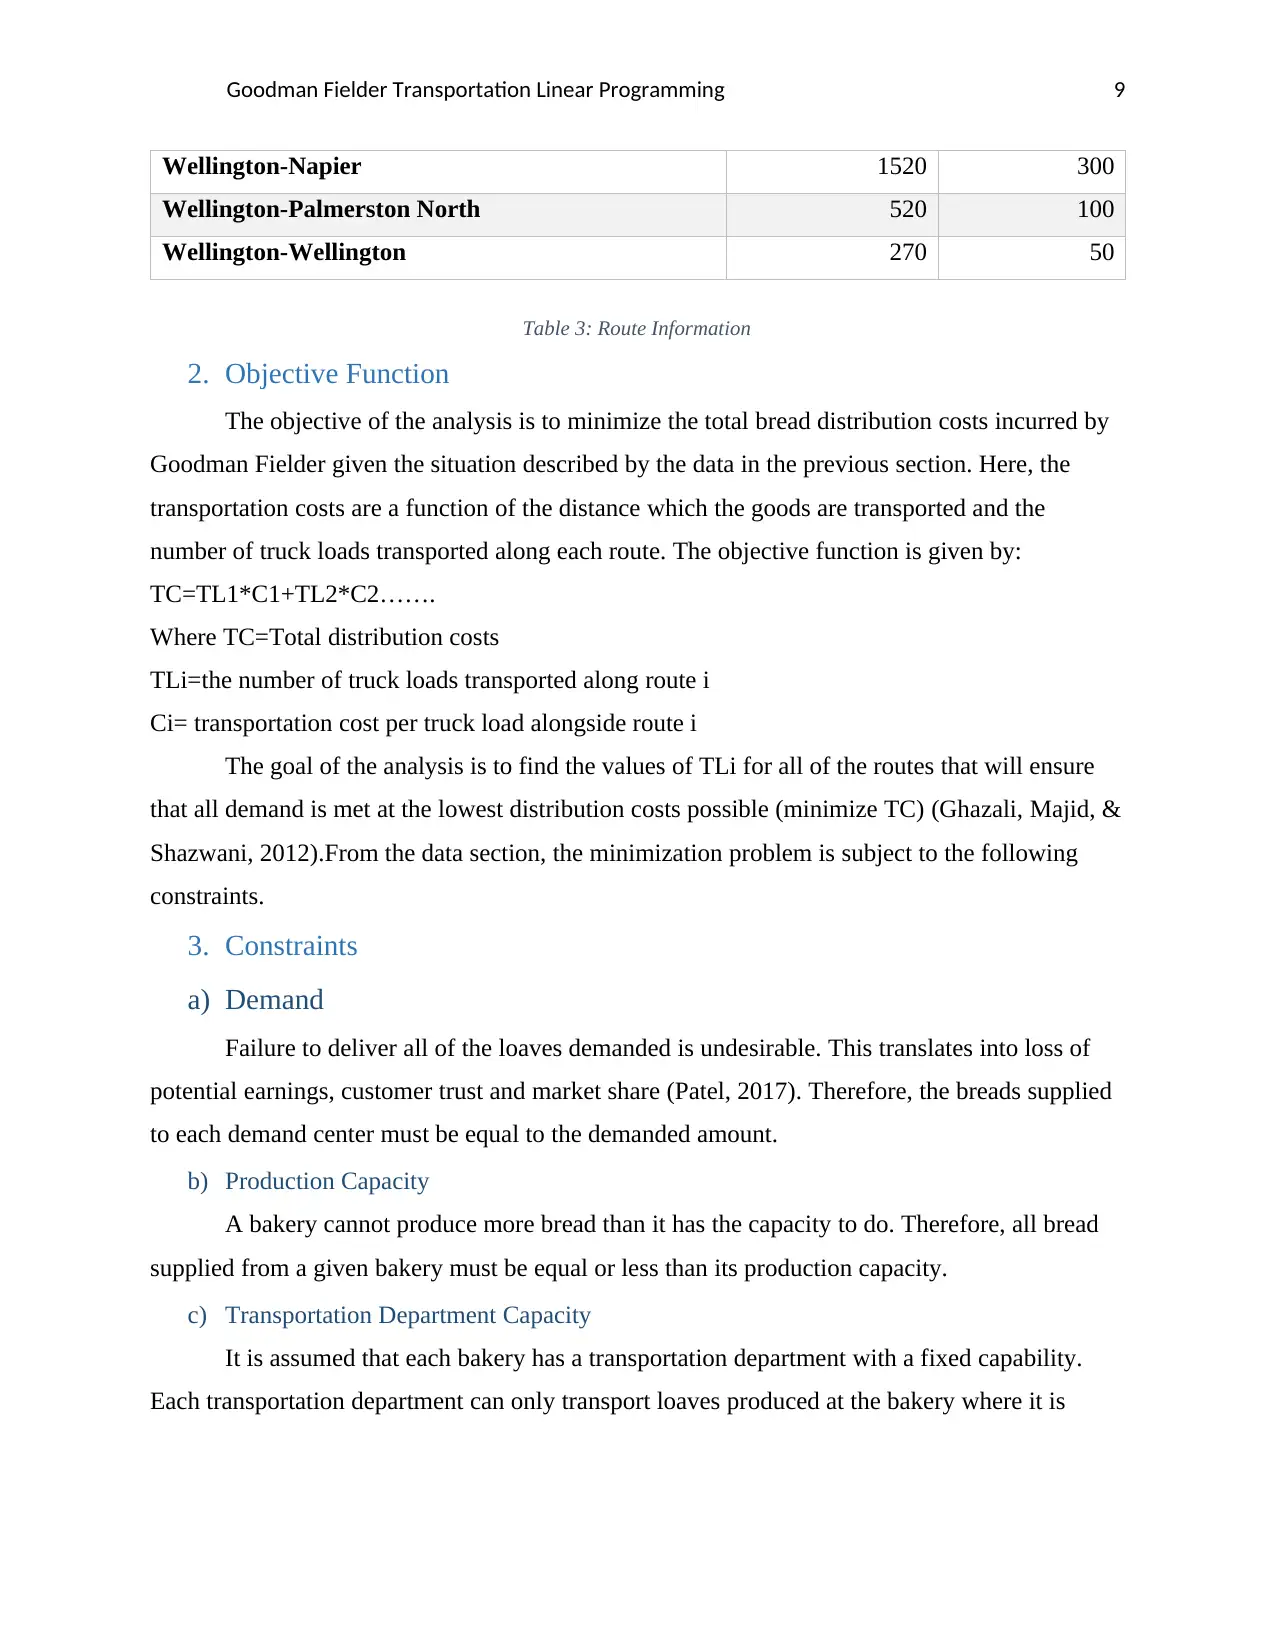
Goodman Fielder Transportation Linear Programming 9
Wellington-Napier 1520 300
Wellington-Palmerston North 520 100
Wellington-Wellington 270 50
Table 3: Route Information
2. Objective Function
The objective of the analysis is to minimize the total bread distribution costs incurred by
Goodman Fielder given the situation described by the data in the previous section. Here, the
transportation costs are a function of the distance which the goods are transported and the
number of truck loads transported along each route. The objective function is given by:
TC=TL1*C1+TL2*C2…….
Where TC=Total distribution costs
TLi=the number of truck loads transported along route i
Ci= transportation cost per truck load alongside route i
The goal of the analysis is to find the values of TLi for all of the routes that will ensure
that all demand is met at the lowest distribution costs possible (minimize TC) (Ghazali, Majid, &
Shazwani, 2012).From the data section, the minimization problem is subject to the following
constraints.
3. Constraints
a) Demand
Failure to deliver all of the loaves demanded is undesirable. This translates into loss of
potential earnings, customer trust and market share (Patel, 2017). Therefore, the breads supplied
to each demand center must be equal to the demanded amount.
b) Production Capacity
A bakery cannot produce more bread than it has the capacity to do. Therefore, all bread
supplied from a given bakery must be equal or less than its production capacity.
c) Transportation Department Capacity
It is assumed that each bakery has a transportation department with a fixed capability.
Each transportation department can only transport loaves produced at the bakery where it is
⊘ This is a preview!⊘
Do you want full access?
Subscribe today to unlock all pages.
Trusted by 1+ million students worldwide
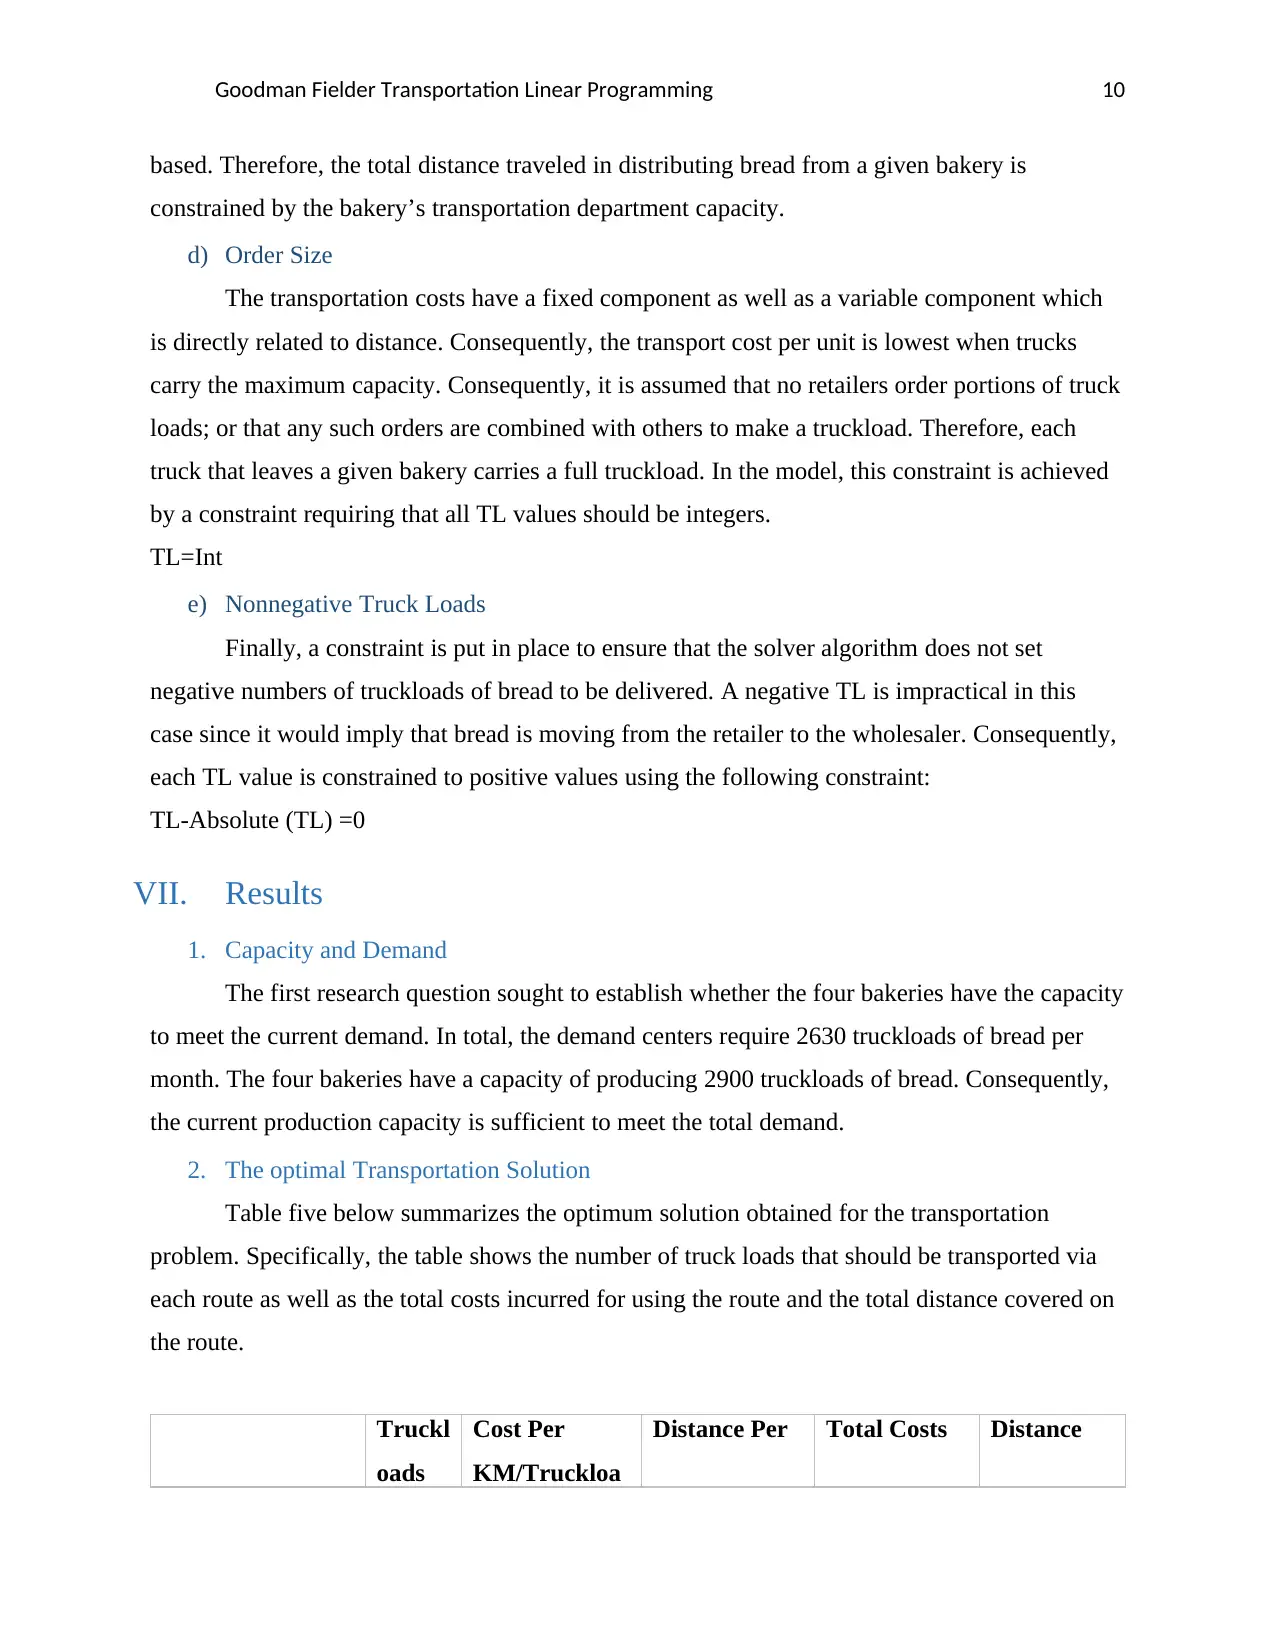
Goodman Fielder Transportation Linear Programming 10
based. Therefore, the total distance traveled in distributing bread from a given bakery is
constrained by the bakery’s transportation department capacity.
d) Order Size
The transportation costs have a fixed component as well as a variable component which
is directly related to distance. Consequently, the transport cost per unit is lowest when trucks
carry the maximum capacity. Consequently, it is assumed that no retailers order portions of truck
loads; or that any such orders are combined with others to make a truckload. Therefore, each
truck that leaves a given bakery carries a full truckload. In the model, this constraint is achieved
by a constraint requiring that all TL values should be integers.
TL=Int
e) Nonnegative Truck Loads
Finally, a constraint is put in place to ensure that the solver algorithm does not set
negative numbers of truckloads of bread to be delivered. A negative TL is impractical in this
case since it would imply that bread is moving from the retailer to the wholesaler. Consequently,
each TL value is constrained to positive values using the following constraint:
TL-Absolute (TL) =0
VII. Results
1. Capacity and Demand
The first research question sought to establish whether the four bakeries have the capacity
to meet the current demand. In total, the demand centers require 2630 truckloads of bread per
month. The four bakeries have a capacity of producing 2900 truckloads of bread. Consequently,
the current production capacity is sufficient to meet the total demand.
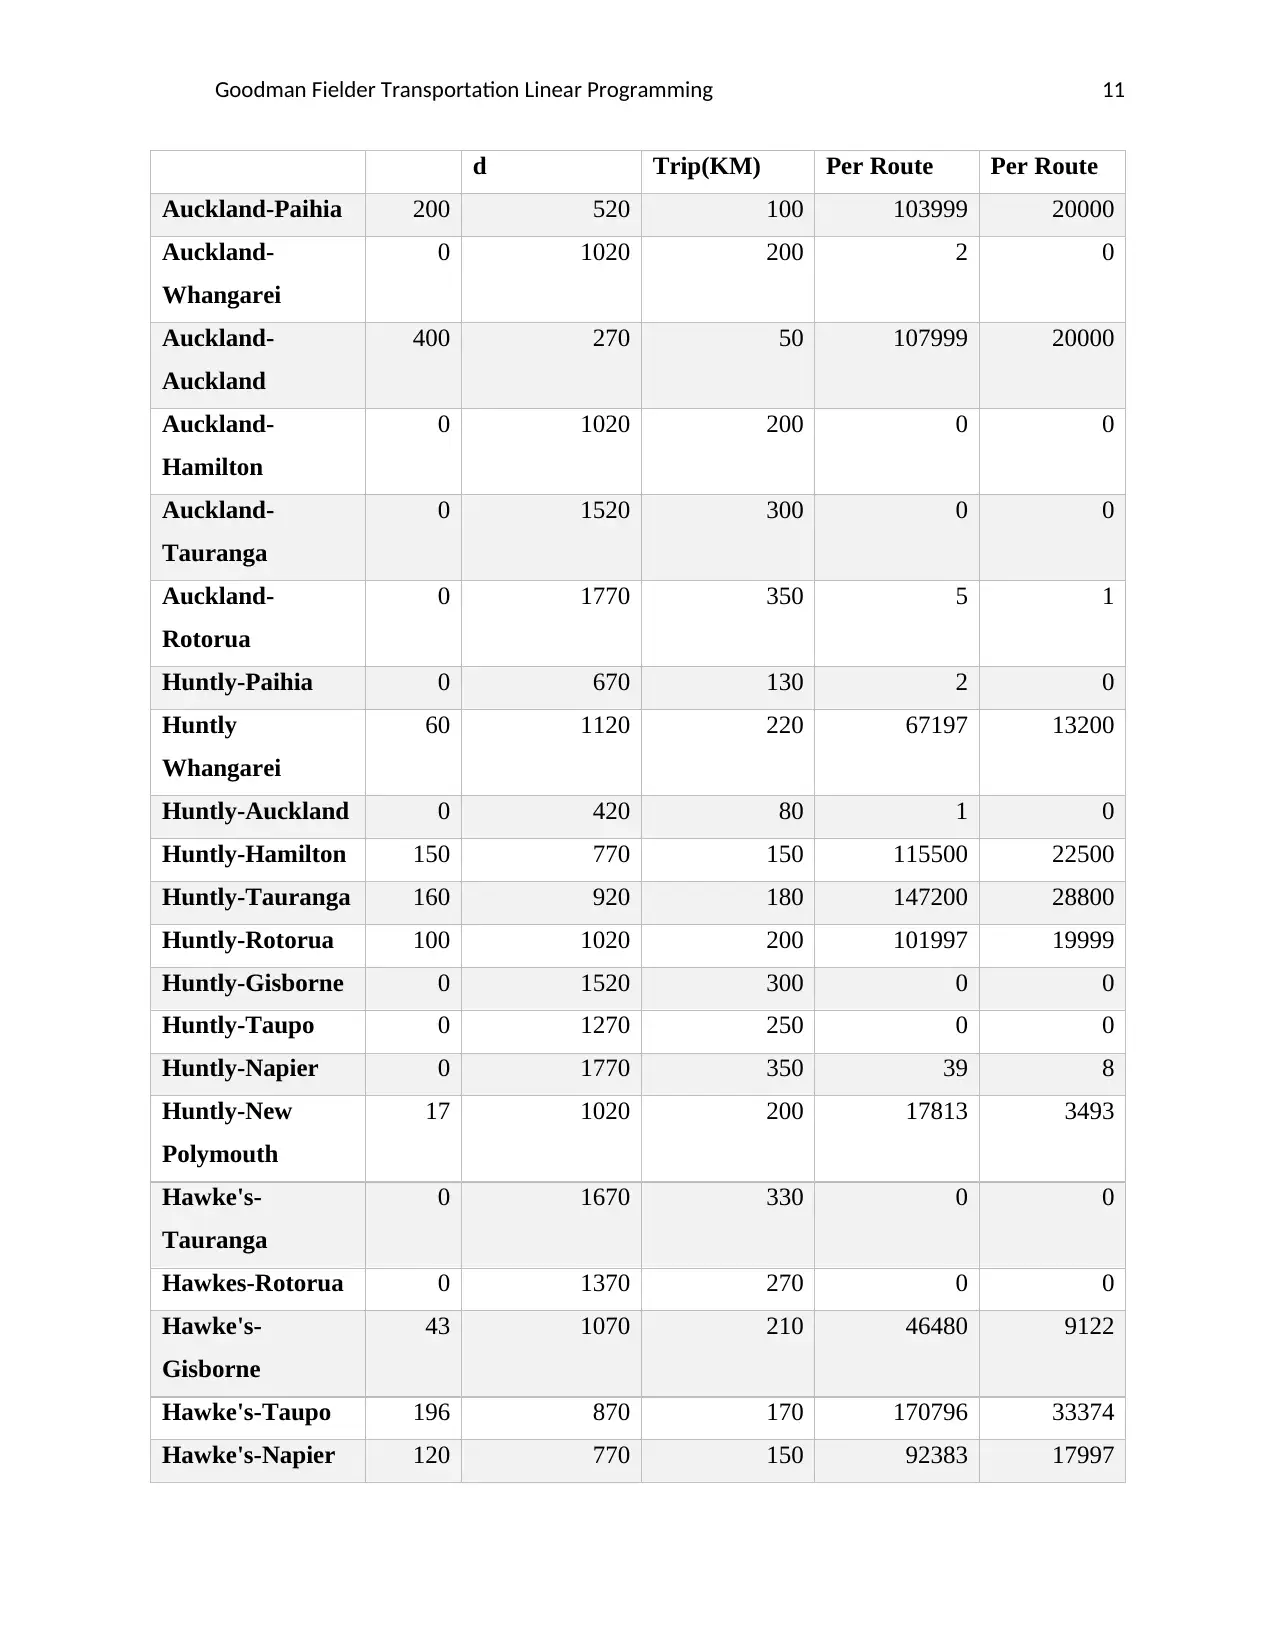
2. The optimal Transportation Solution
Table five below summarizes the optimum solution obtained for the transportation
problem. Specifically, the table shows the number of truck loads that should be transported via
each route as well as the total costs incurred for using the route and the total distance covered on
the route.
Truckl
oads
Cost Per
KM/Truckloa
Distance Per Total Costs Distance
based. Therefore, the total distance traveled in distributing bread from a given bakery is
constrained by the bakery’s transportation department capacity.
d) Order Size
The transportation costs have a fixed component as well as a variable component which
is directly related to distance. Consequently, the transport cost per unit is lowest when trucks
carry the maximum capacity. Consequently, it is assumed that no retailers order portions of truck
loads; or that any such orders are combined with others to make a truckload. Therefore, each
truck that leaves a given bakery carries a full truckload. In the model, this constraint is achieved
by a constraint requiring that all TL values should be integers.
TL=Int
e) Nonnegative Truck Loads
Finally, a constraint is put in place to ensure that the solver algorithm does not set
negative numbers of truckloads of bread to be delivered. A negative TL is impractical in this
case since it would imply that bread is moving from the retailer to the wholesaler. Consequently,
each TL value is constrained to positive values using the following constraint:
TL-Absolute (TL) =0
VII. Results
1. Capacity and Demand
The first research question sought to establish whether the four bakeries have the capacity
to meet the current demand. In total, the demand centers require 2630 truckloads of bread per
month. The four bakeries have a capacity of producing 2900 truckloads of bread. Consequently,
the current production capacity is sufficient to meet the total demand.
2. The optimal Transportation Solution
Table five below summarizes the optimum solution obtained for the transportation
problem. Specifically, the table shows the number of truck loads that should be transported via
each route as well as the total costs incurred for using the route and the total distance covered on
the route.
Truckl
oads
Cost Per
KM/Truckloa
Distance Per Total Costs Distance
Paraphrase This Document
Need a fresh take? Get an instant paraphrase of this document with our AI Paraphraser
Goodman Fielder Transportation Linear Programming 11
d Trip(KM) Per Route Per Route
Auckland-Paihia 200 520 100 103999 20000
Auckland-
Whangarei
0 1020 200 2 0
Auckland-
Auckland
400 270 50 107999 20000
Auckland-
Hamilton
0 1020 200 0 0
Auckland-
Tauranga
0 1520 300 0 0
Auckland-
Rotorua
0 1770 350 5 1
Huntly-Paihia 0 670 130 2 0
Huntly
Whangarei
60 1120 220 67197 13200
Huntly-Auckland 0 420 80 1 0
Huntly-Hamilton 150 770 150 115500 22500
Huntly-Tauranga 160 920 180 147200 28800
Huntly-Rotorua 100 1020 200 101997 19999
Huntly-Gisborne 0 1520 300 0 0
Huntly-Taupo 0 1270 250 0 0
Huntly-Napier 0 1770 350 39 8
Huntly-New
Polymouth
17 1020 200 17813 3493
Hawke's-
Tauranga
0 1670 330 0 0
Hawkes-Rotorua 0 1370 270 0 0
Hawke's-
Gisborne
43 1070 210 46480 9122
Hawke's-Taupo 196 870 170 170796 33374
Hawke's-Napier 120 770 150 92383 17997
Goodman Fielder Transportation Linear Programming 12
Hawke's-New
Polymouth
173 1020 200 175987 34507
Wellington-
Rotorua
0 2020 400 0 0
Wellington-
Gisborne
27 1570 310 41700 8234
Wellington-
Taupo
4 1620 320 5966 1178
Wellington-
Napier
0 1520 300 1 0
Wellington-
Palmerston
North
280 520 100 145600 28000
Wellington-
Wellington
700 270 50 189000 35000
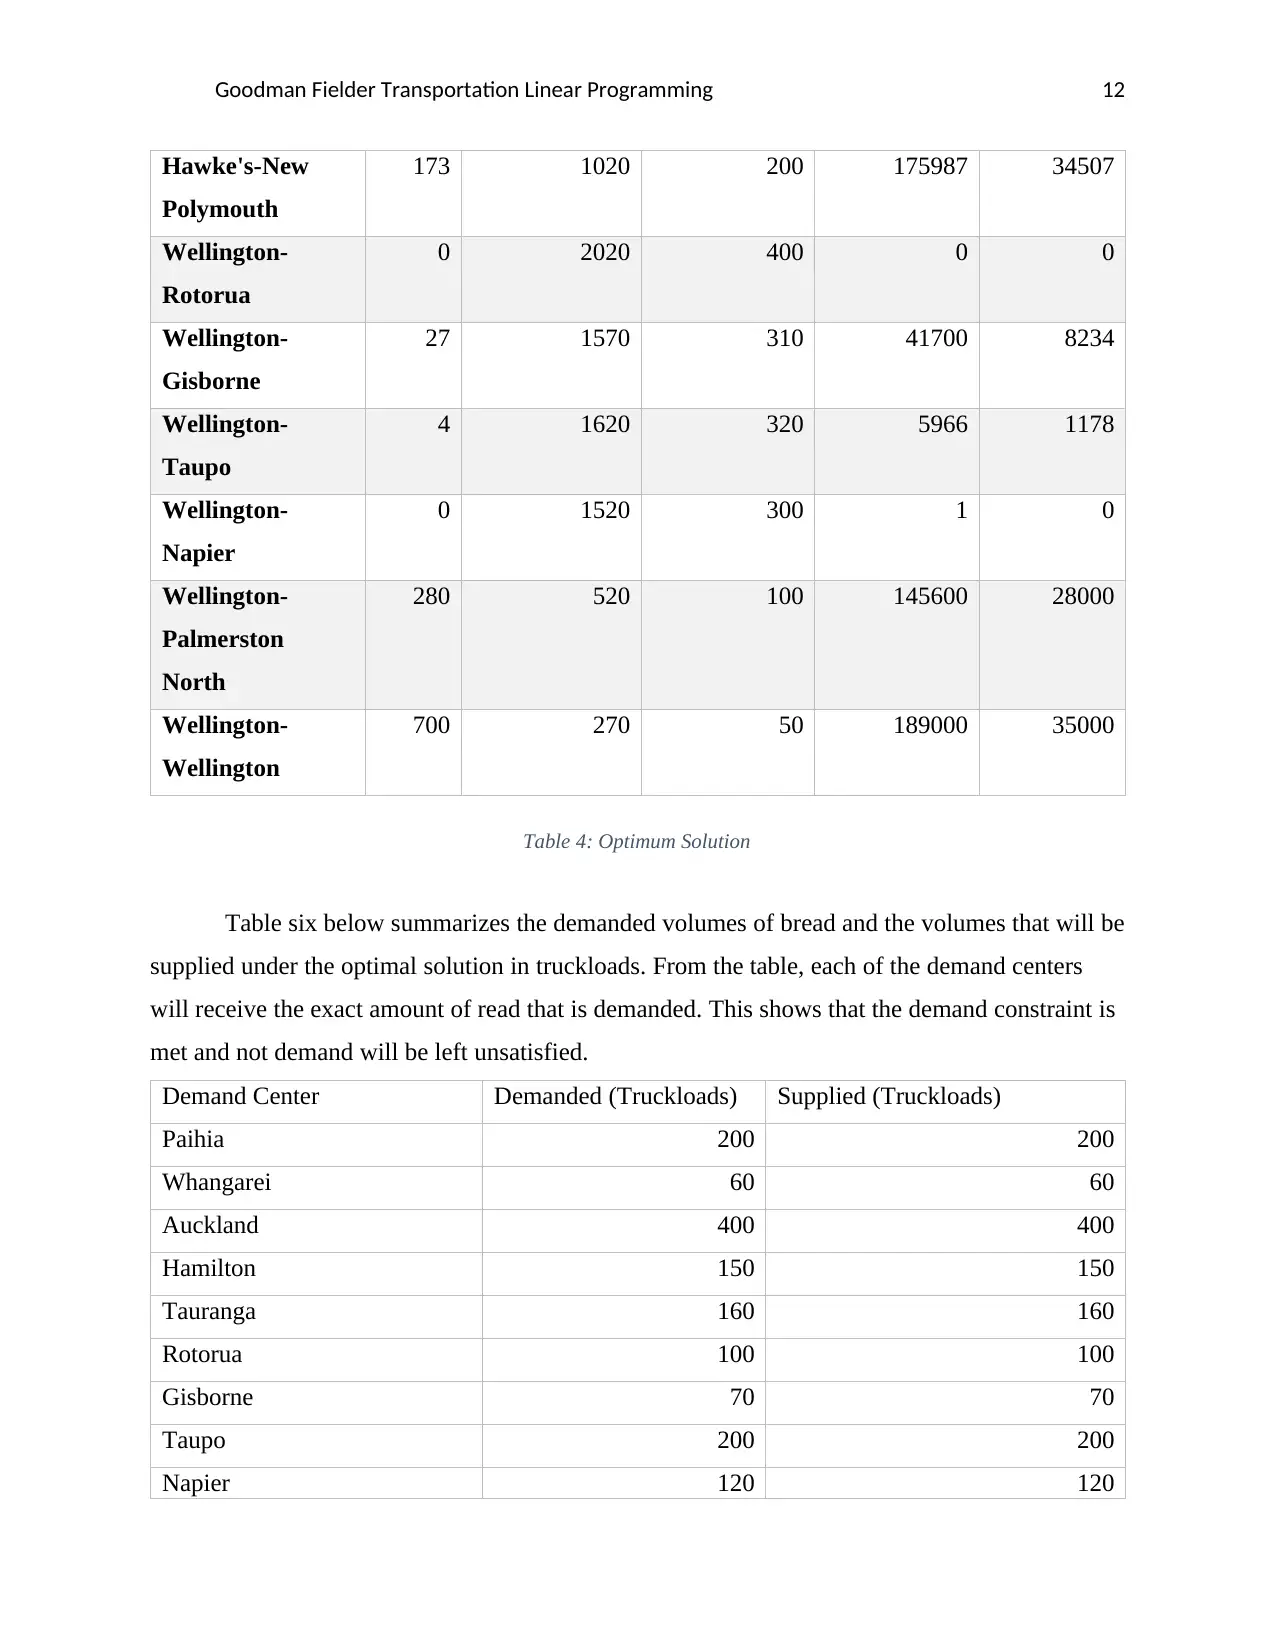
Table 4: Optimum Solution
Table six below summarizes the demanded volumes of bread and the volumes that will be
supplied under the optimal solution in truckloads. From the table, each of the demand centers
will receive the exact amount of read that is demanded. This shows that the demand constraint is
met and not demand will be left unsatisfied.
Demand Center Demanded (Truckloads) Supplied (Truckloads)
Paihia 200 200
Whangarei 60 60
Auckland 400 400
Hamilton 150 150
Tauranga 160 160
Rotorua 100 100
Gisborne 70 70
Taupo 200 200
Napier 120 120
Hawke's-New
Polymouth
173 1020 200 175987 34507
Wellington-
Rotorua
0 2020 400 0 0
Wellington-
Gisborne
27 1570 310 41700 8234
Wellington-
Taupo
4 1620 320 5966 1178
Wellington-
Napier
0 1520 300 1 0
Wellington-
Palmerston
North
280 520 100 145600 28000
Wellington-
Wellington
700 270 50 189000 35000
Table 4: Optimum Solution
Table six below summarizes the demanded volumes of bread and the volumes that will be
supplied under the optimal solution in truckloads. From the table, each of the demand centers
will receive the exact amount of read that is demanded. This shows that the demand constraint is
met and not demand will be left unsatisfied.
Demand Center Demanded (Truckloads) Supplied (Truckloads)
Paihia 200 200
Whangarei 60 60
Auckland 400 400
Hamilton 150 150
Tauranga 160 160
Rotorua 100 100
Gisborne 70 70
Taupo 200 200
Napier 120 120
⊘ This is a preview!⊘
Do you want full access?
Subscribe today to unlock all pages.
Trusted by 1+ million students worldwide
1 out of 16
Your All-in-One AI-Powered Toolkit for Academic Success.
+13062052269
info@desklib.com
Available 24*7 on WhatsApp / Email
![[object Object]](/_next/static/media/star-bottom.7253800d.svg)
Unlock your academic potential
Copyright © 2020–2026 A2Z Services. All Rights Reserved. Developed and managed by ZUCOL.