Google Data Analysis with Excel: Applying Statistical Techniques
VerifiedAdded on 2023/06/12
|8
|1707
|156
Practical Assignment
AI Summary
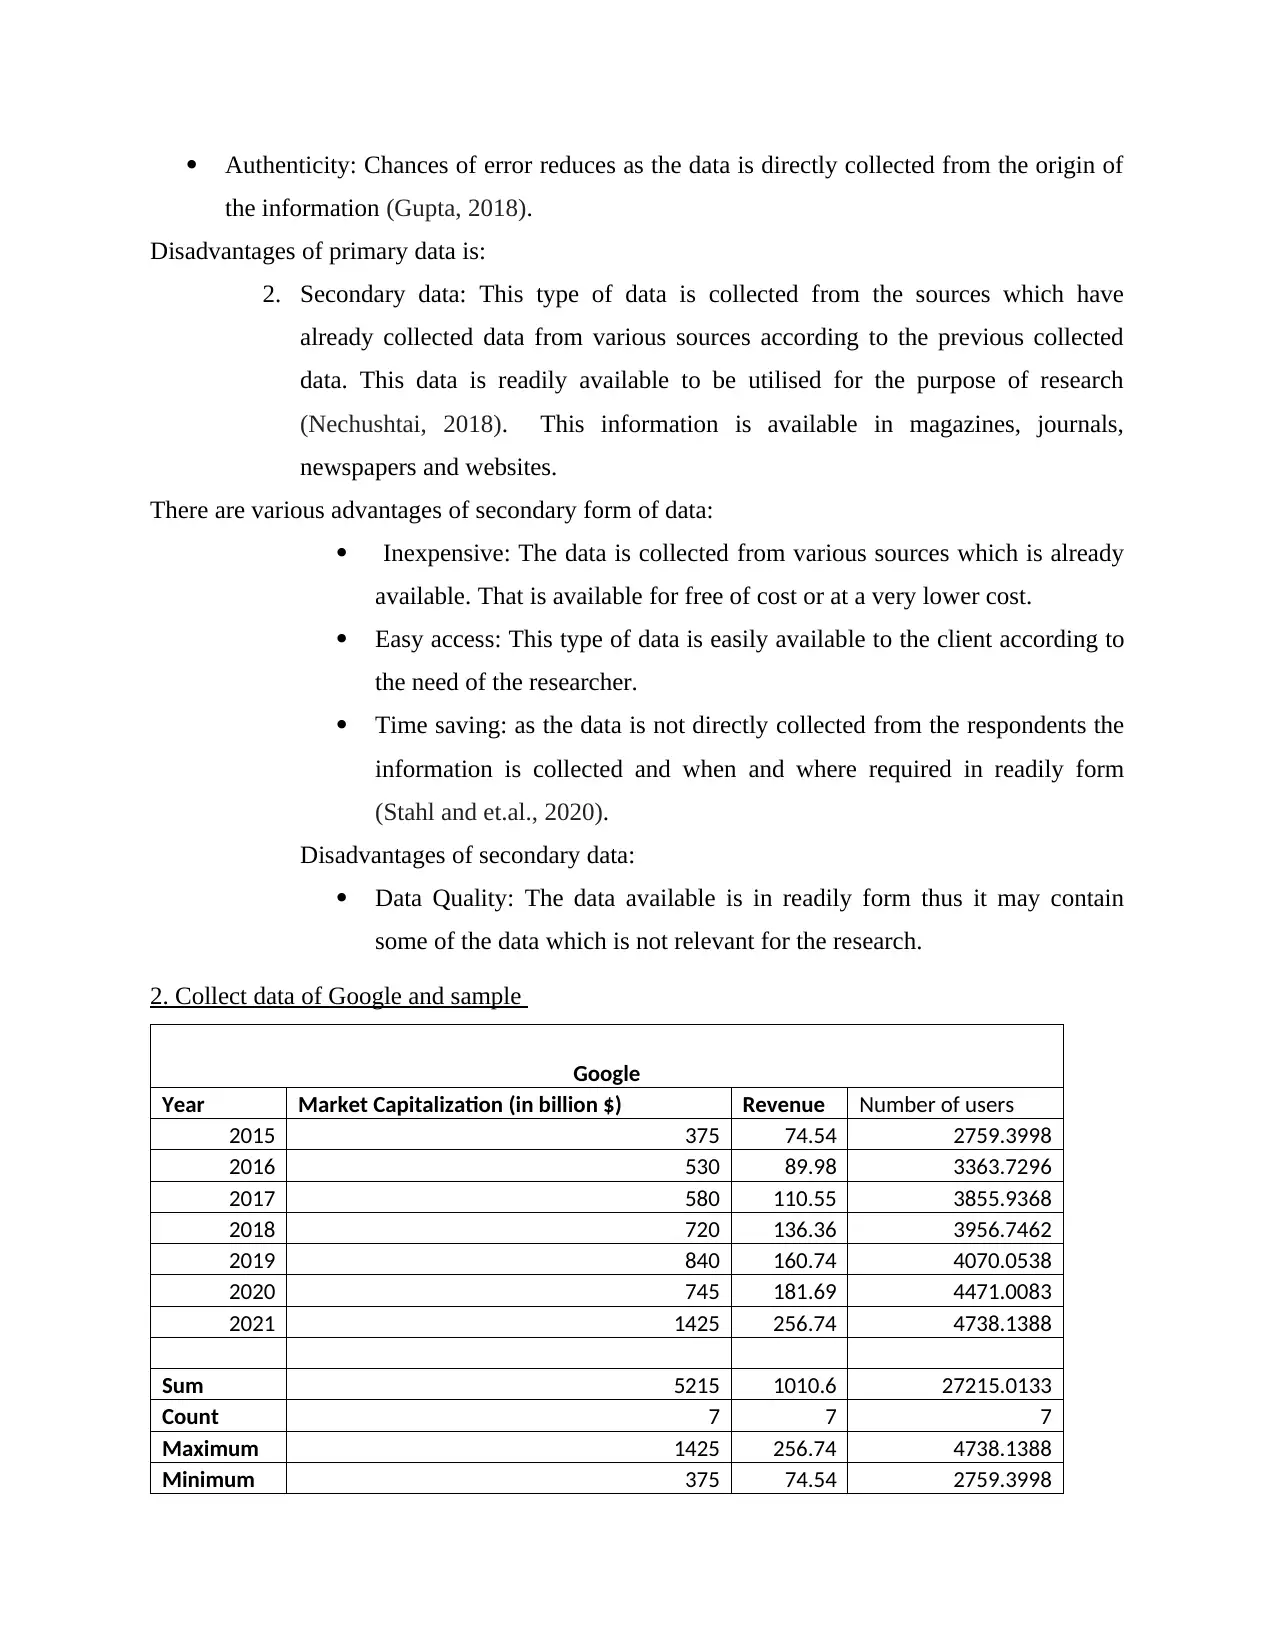
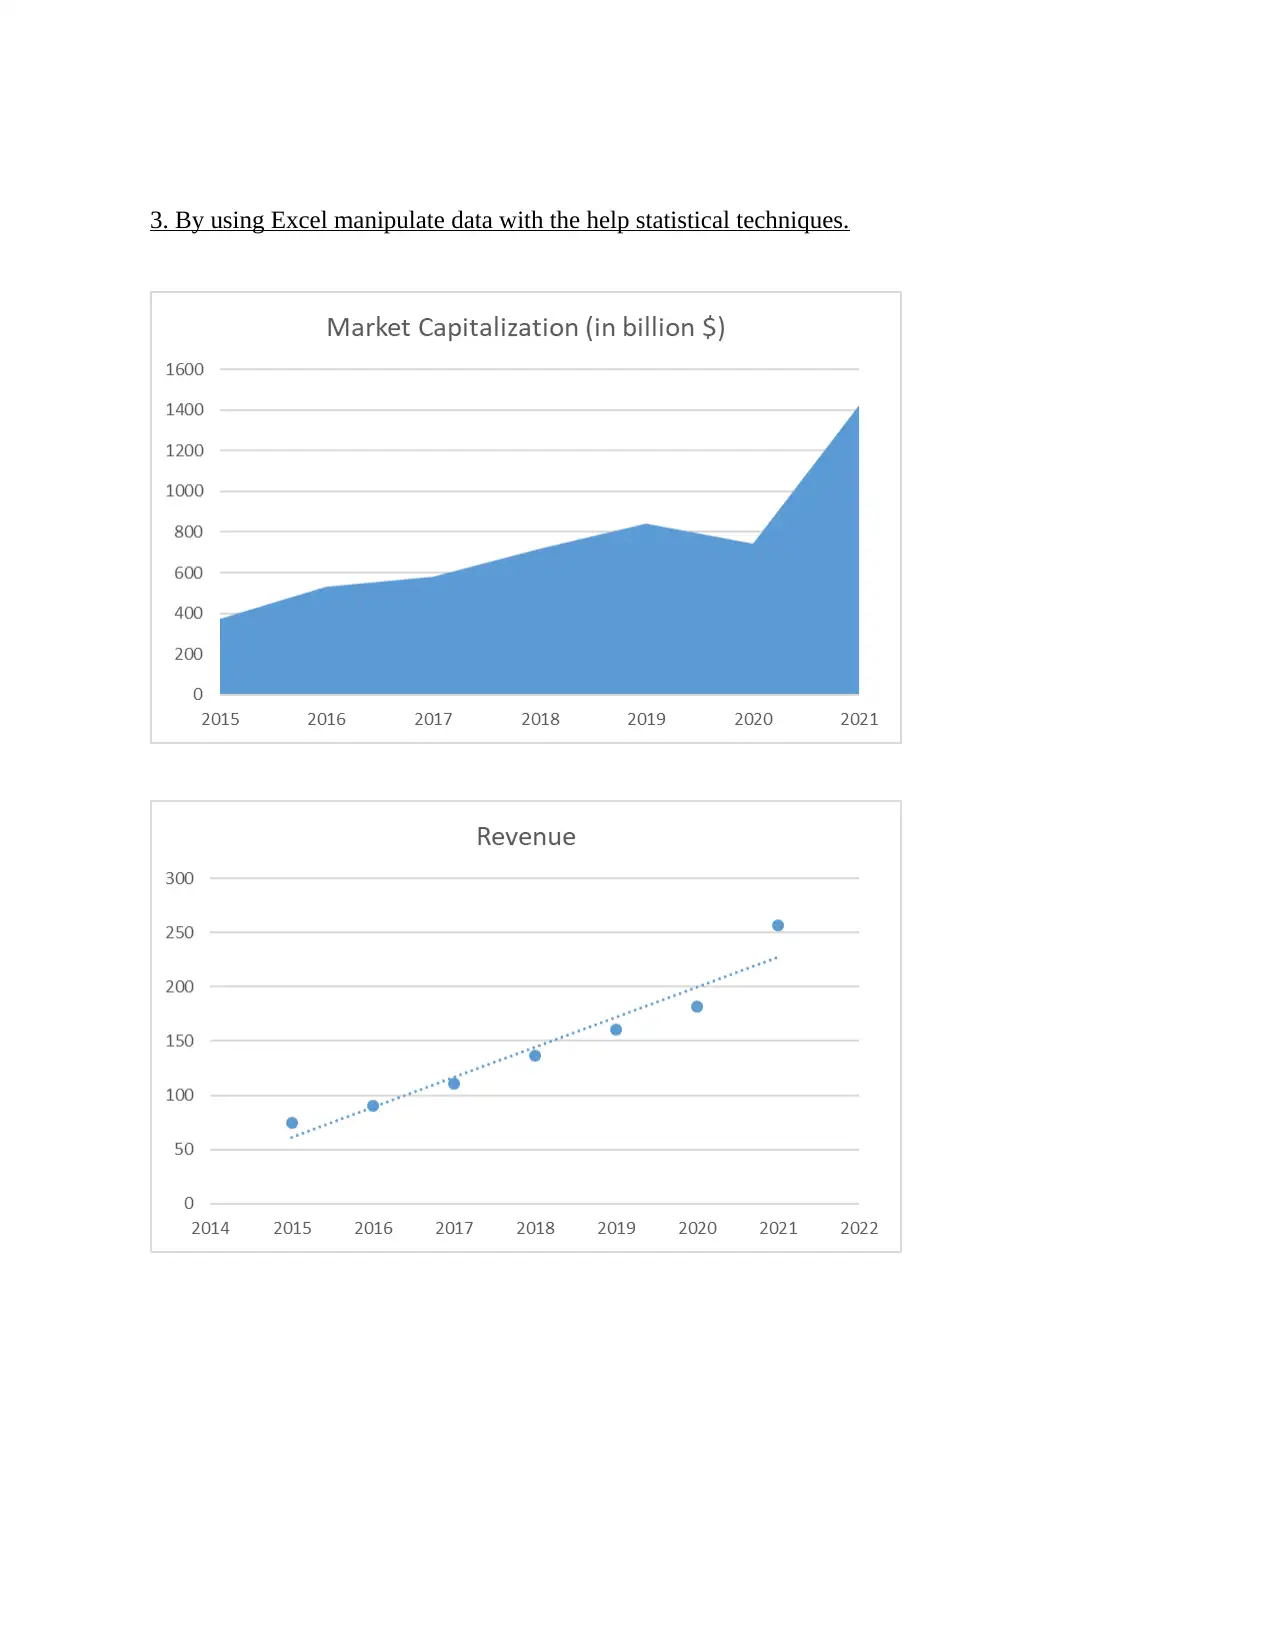
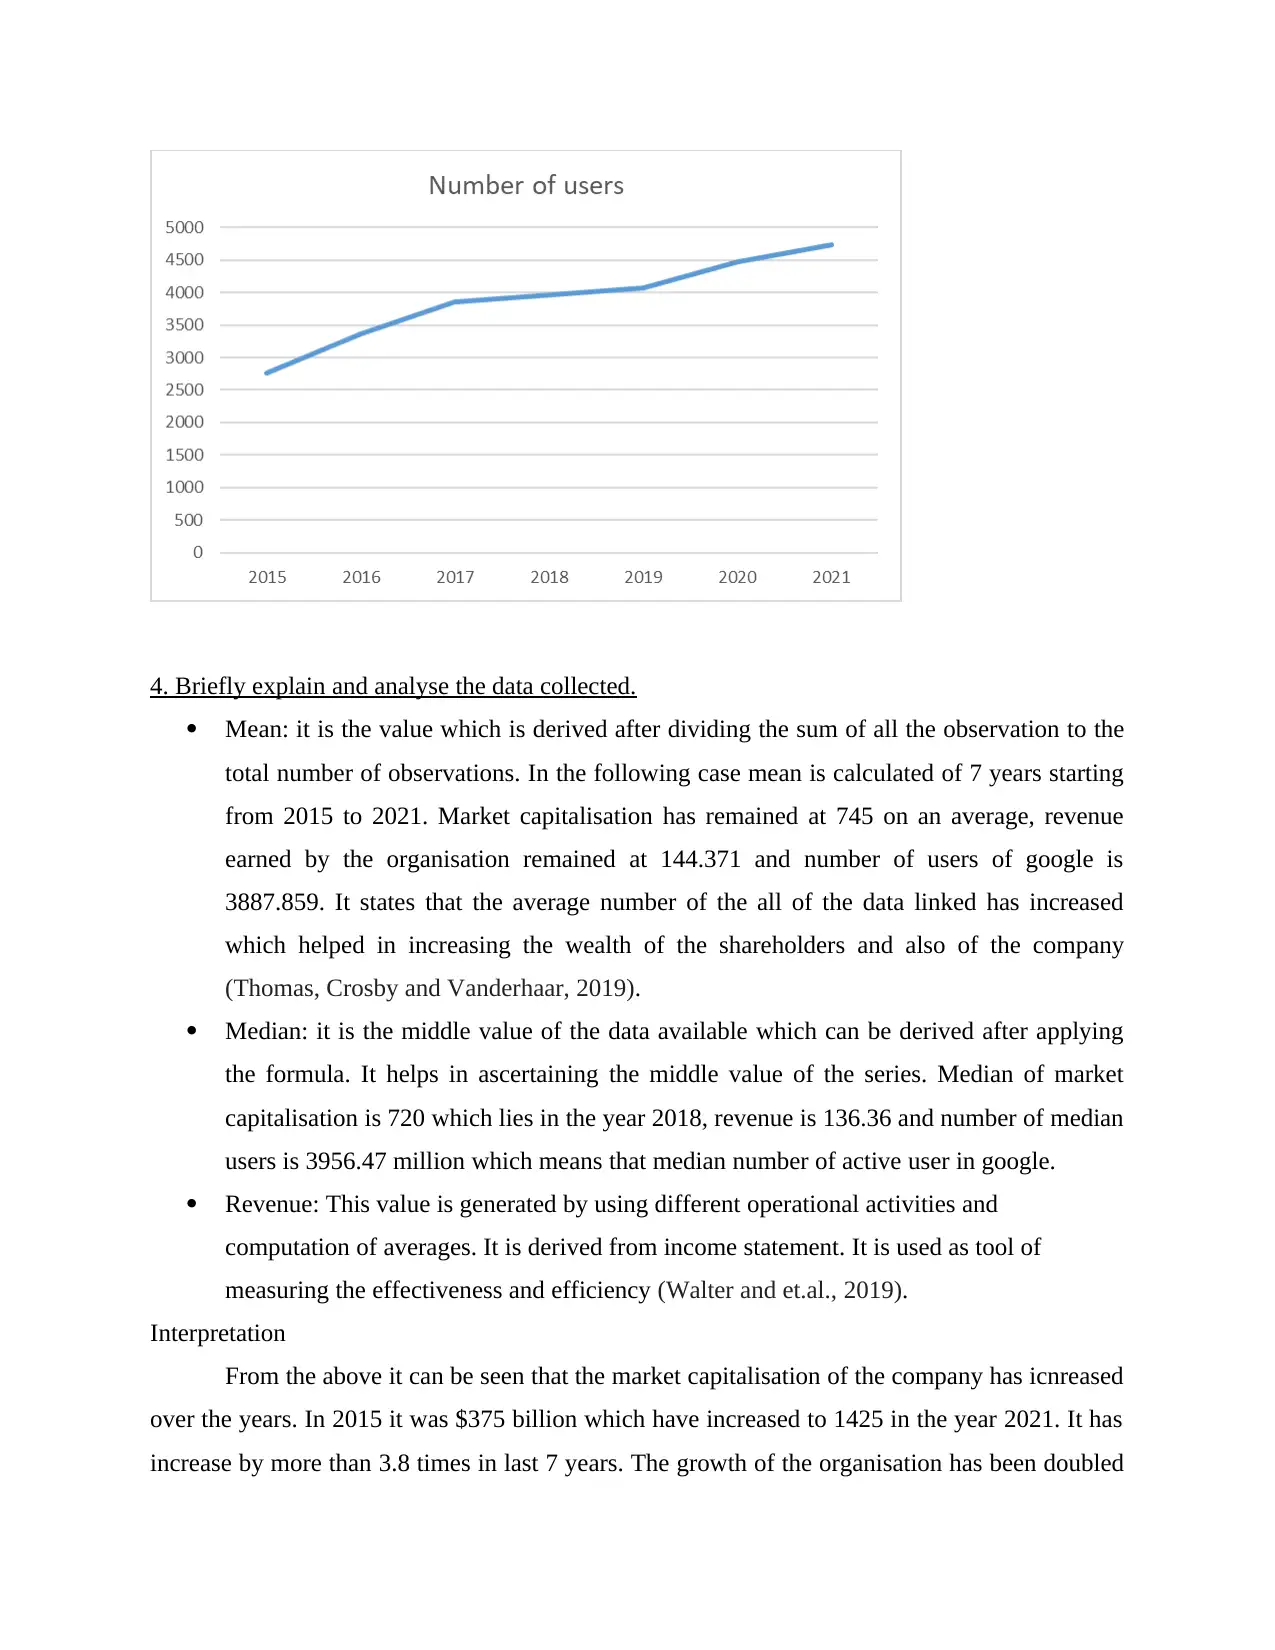
This assignment focuses on analyzing Google's data, including market capitalization, revenue, and user numbers, using Microsoft Excel. It covers data collection methods, both primary and secondary, and then applies statistical techniques such as calculating mean, median, sum, minimum, maximum, and count to interpret the data. The analysis reveals significant growth in Google's market capitalization, revenue, and user base between 2015 and 2021. The report concludes that Excel is a valuable tool for data analysis and decision-making, and the findings are presented in tables and charts for clarity. Desklib offers similar solved assignments and study resources for students.

1 out of 8
Related Documents


Your All-in-One AI-Powered Toolkit for Academic Success.
+13062052269
info@desklib.com
Available 24*7 on WhatsApp / Email
![[object Object]](/_next/static/media/star-bottom.7253800d.svg)
Copyright © 2020–2026 A2Z Services. All Rights Reserved. Developed and managed by ZUCOL.