Data Analysis of Google's Market Performance Using Excel Tools

Verified

Added on  2023/06/12

|9
|1824
|186
Report
AI Summary
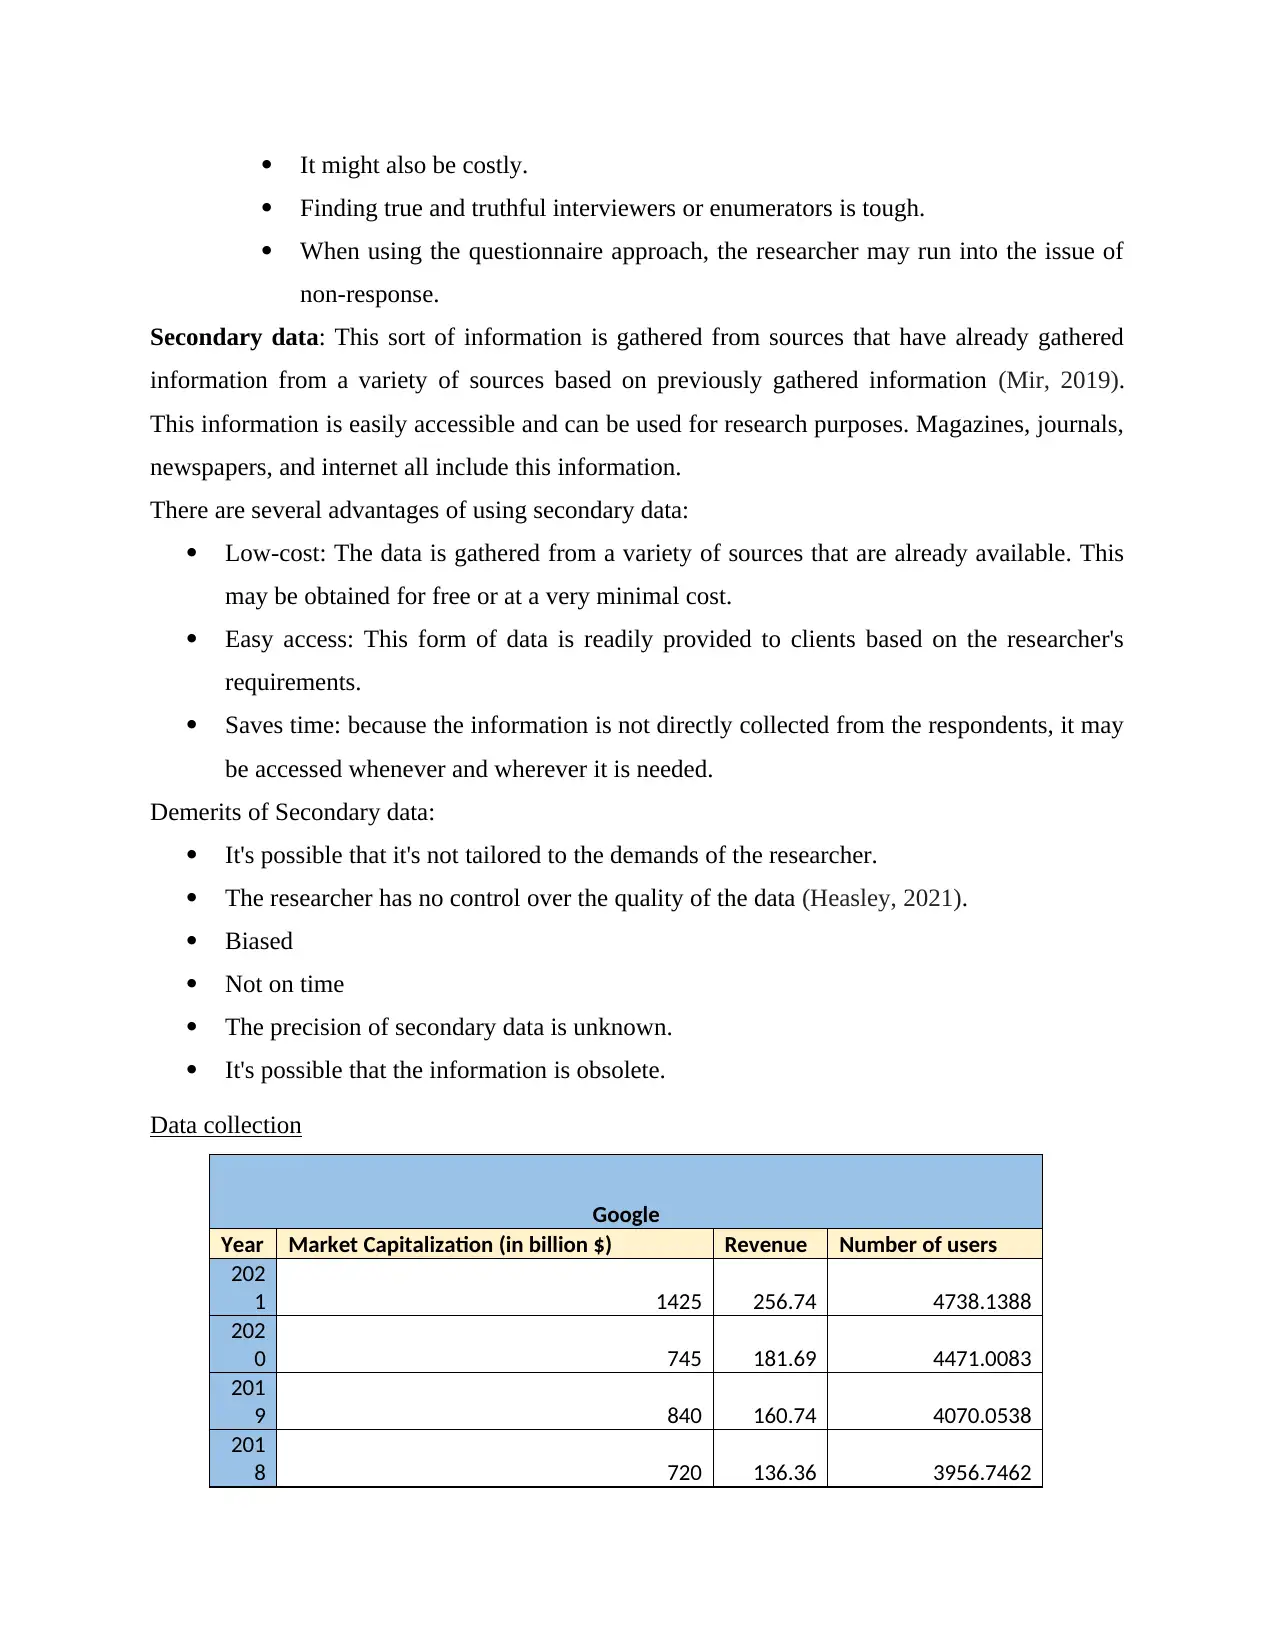
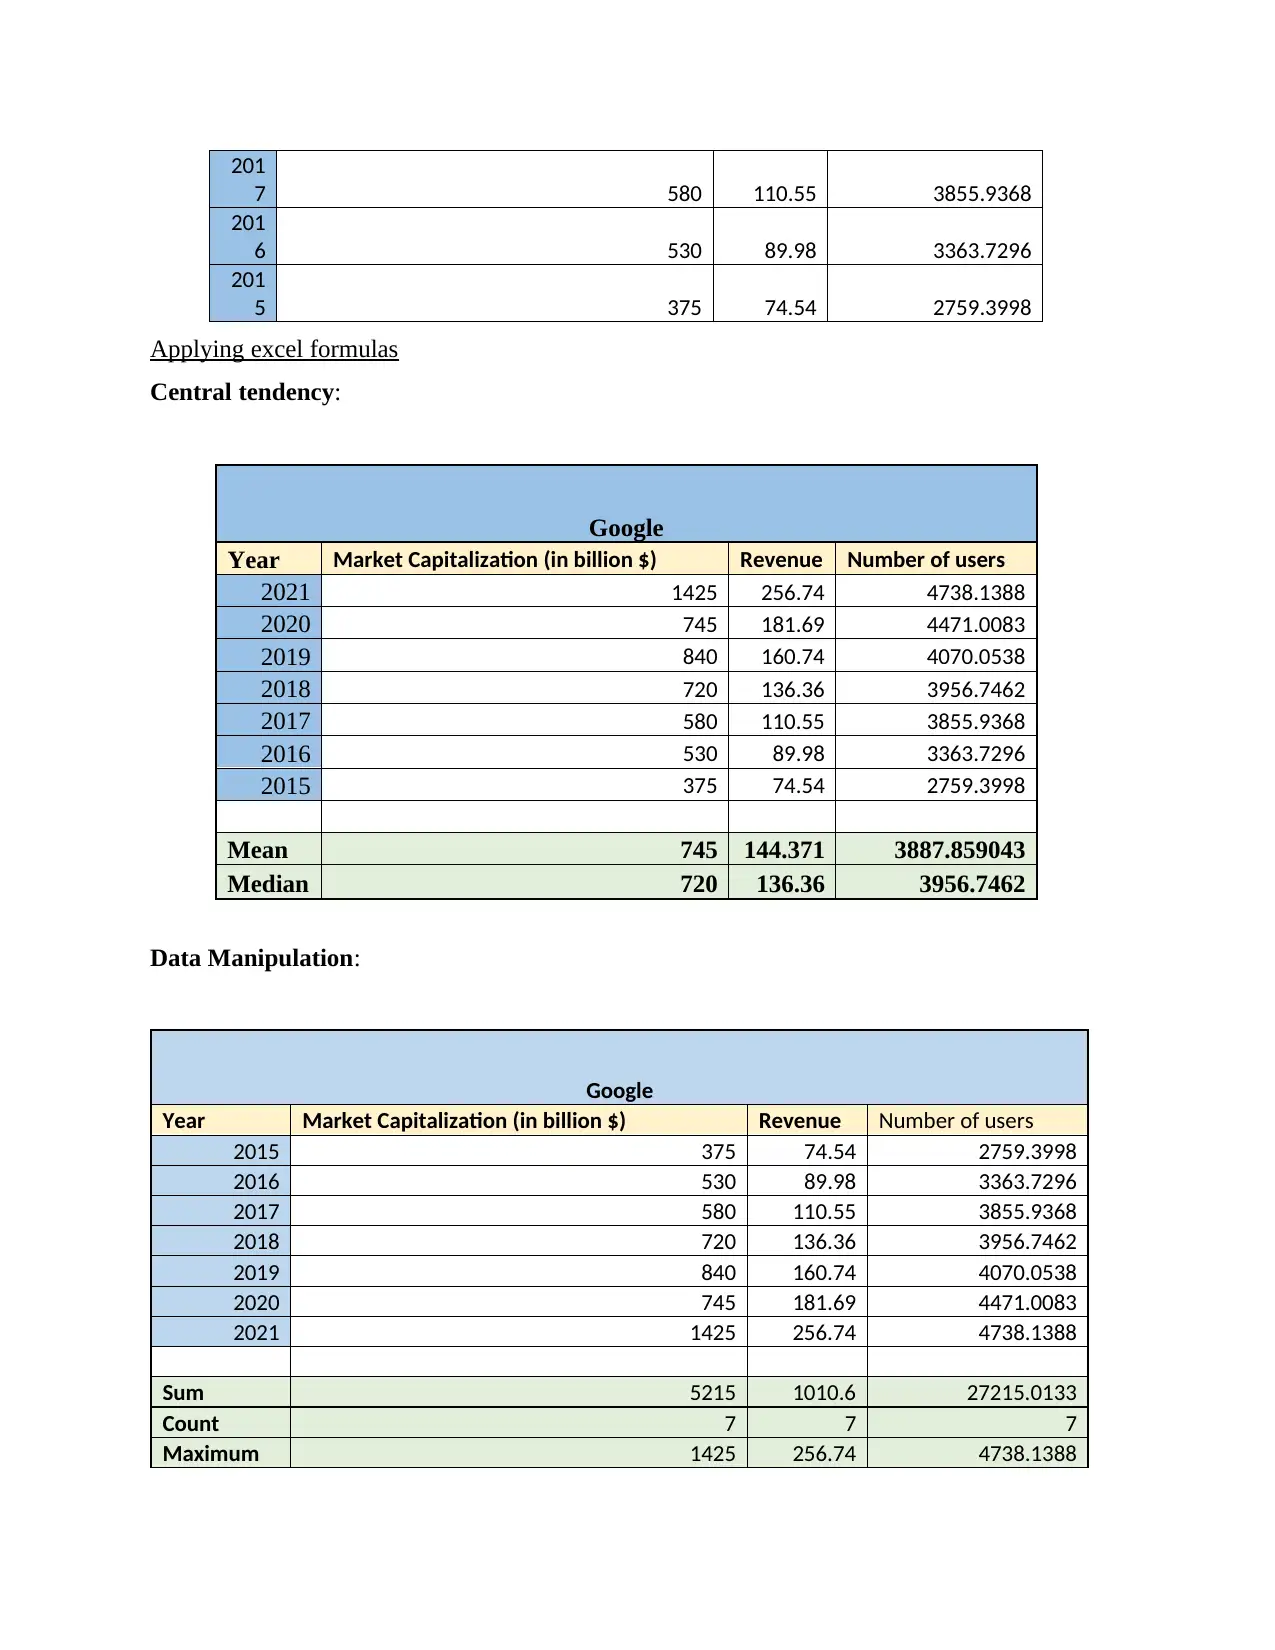
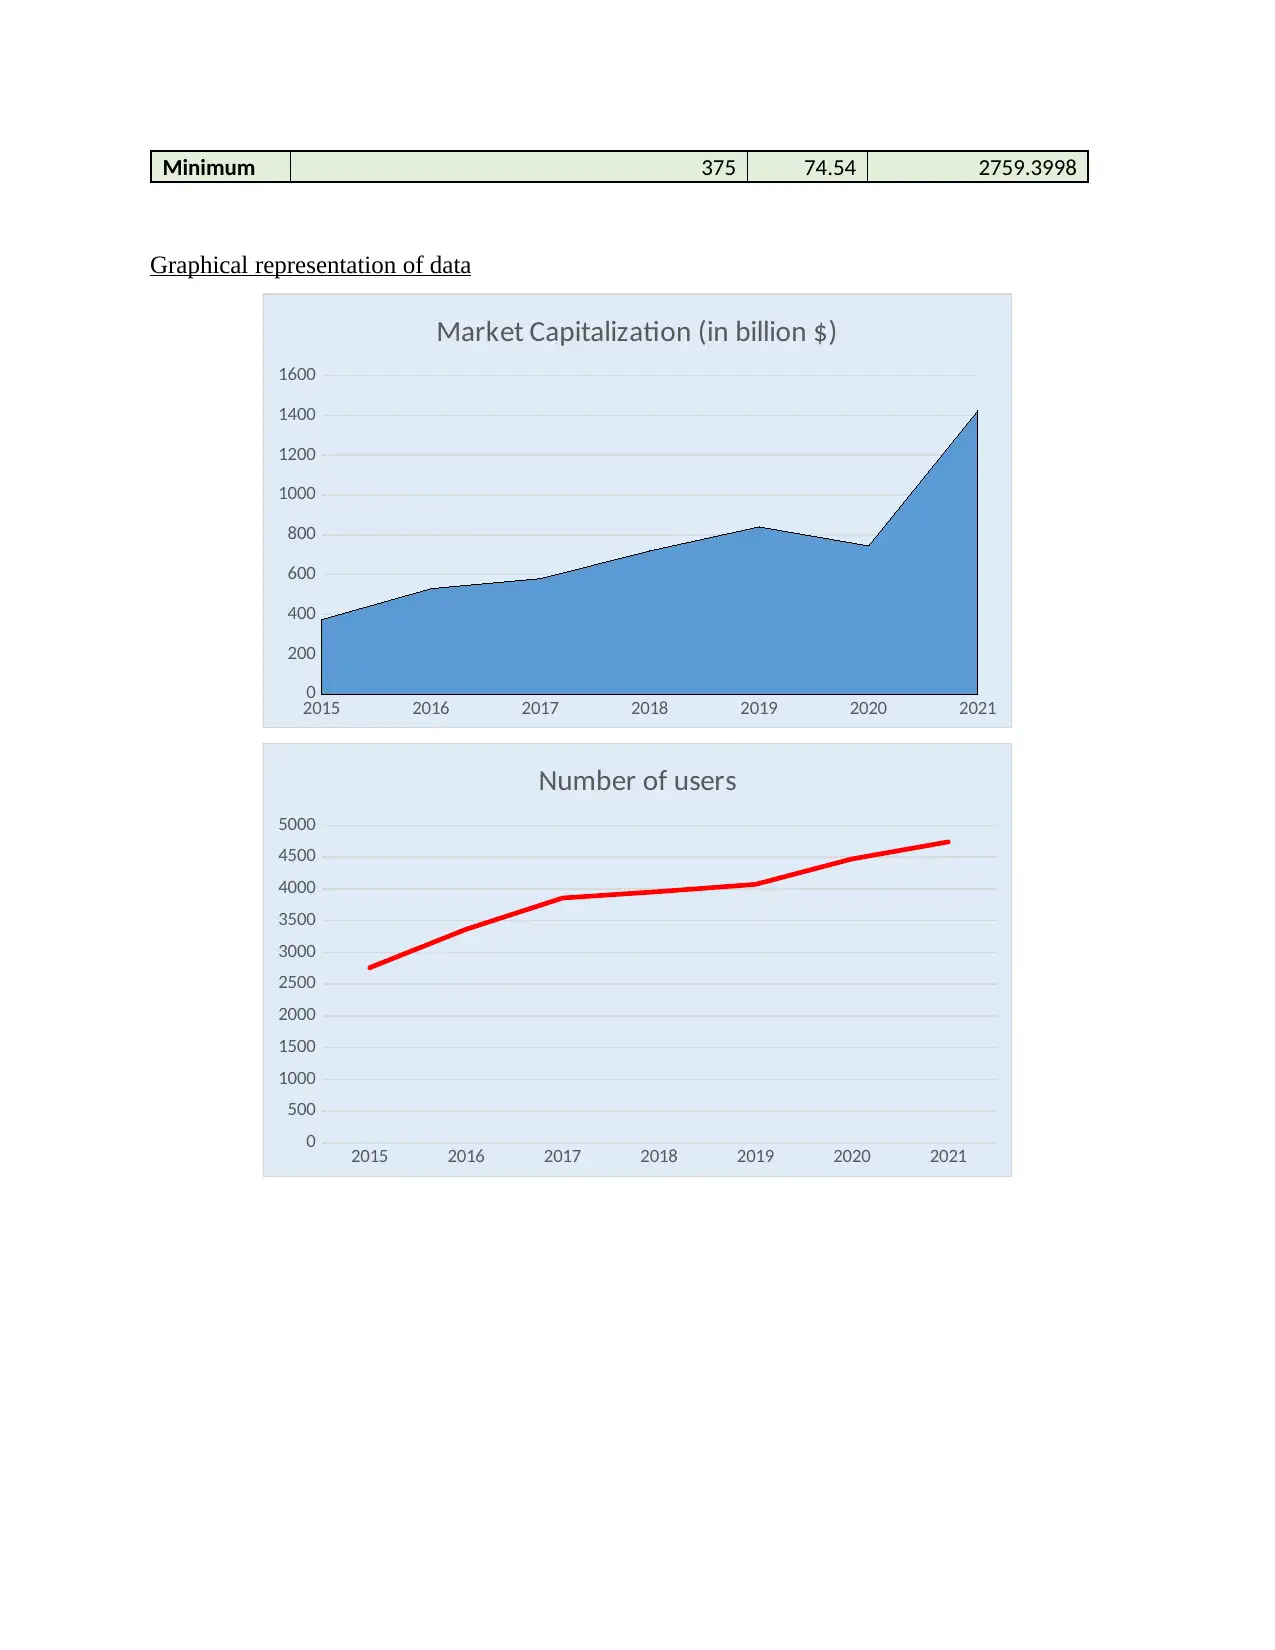
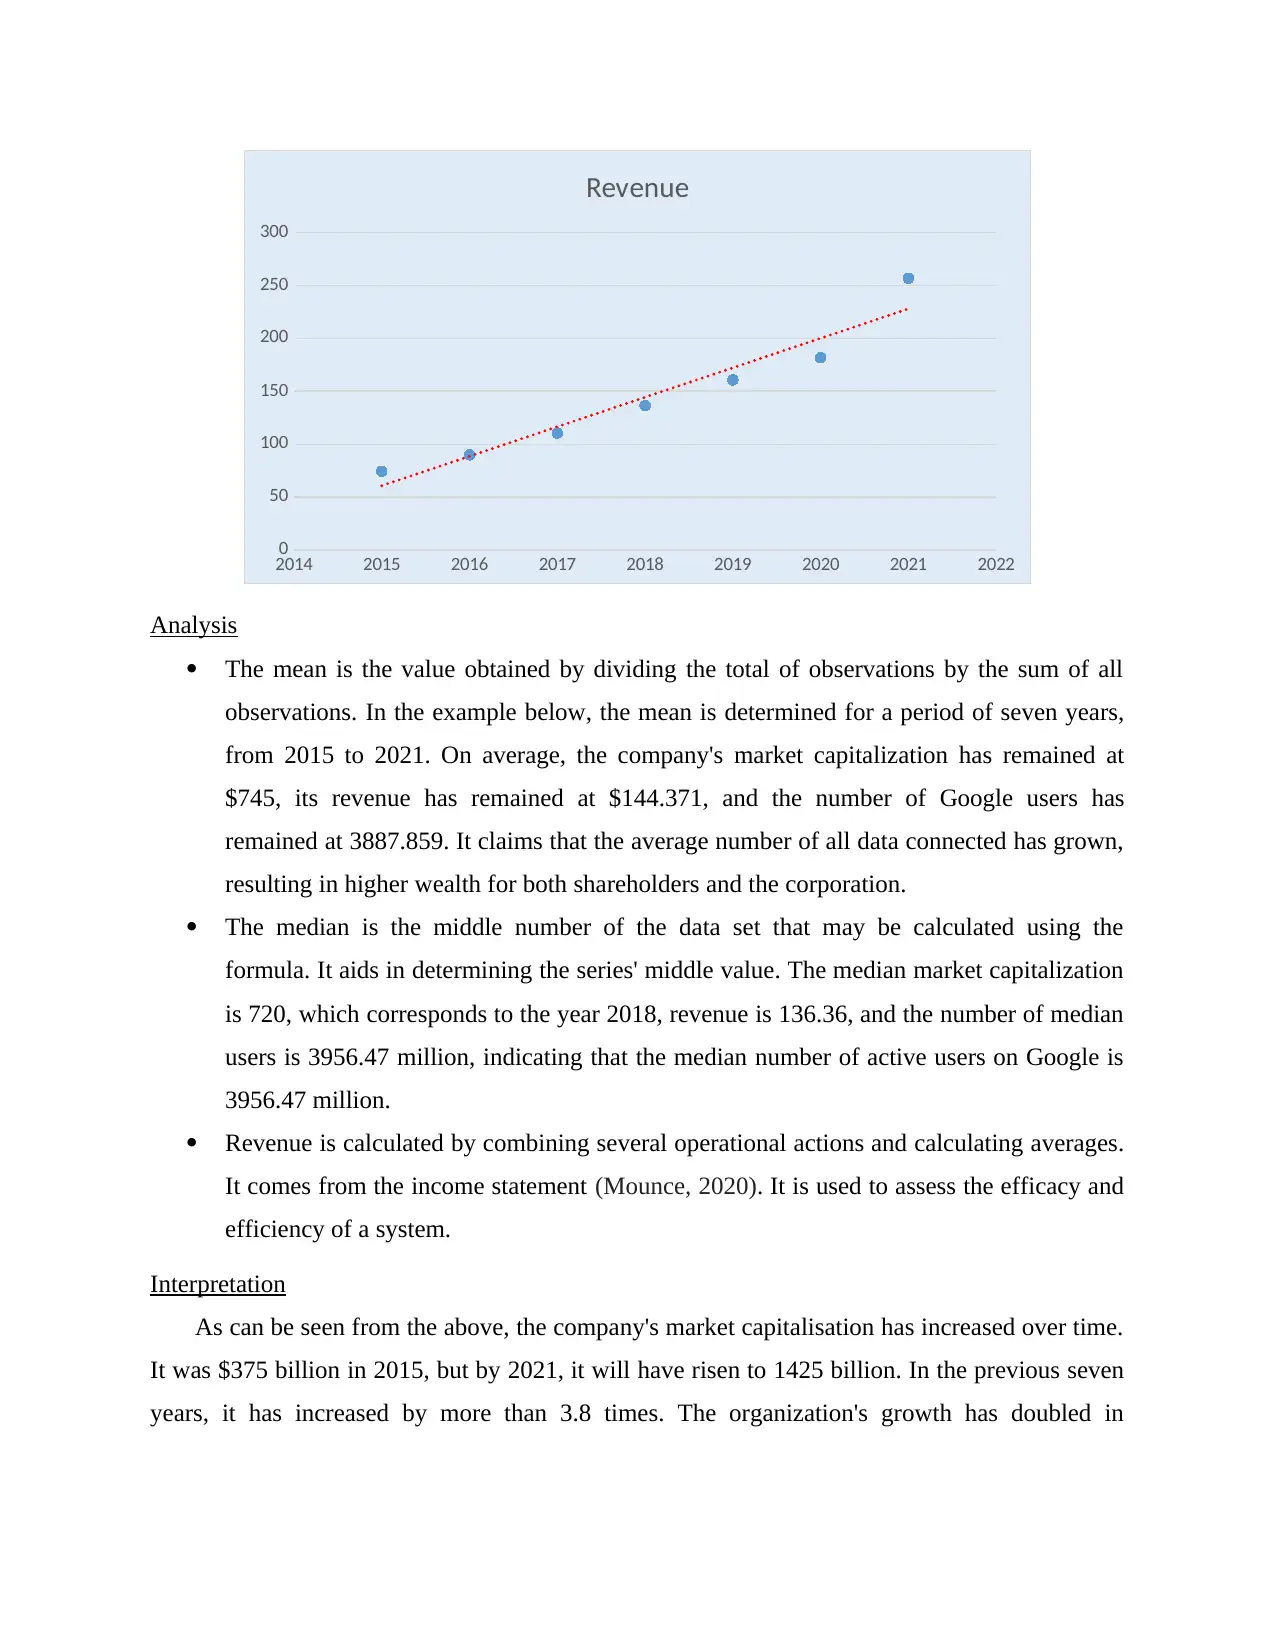
This report provides a detailed analysis of Google's market capitalization, revenue, and user trends from 2015 to 2021 using Microsoft Excel. The analysis employs descriptive statistics such as mean and median to interpret the company's performance. Data was collected from both primary and secondary sources, focusing on market capitalization, revenue, and user numbers. The report includes graphical representations of the data and interprets key findings, such as the significant increase in market capitalization and revenue over the seven-year period. Excel functions like SUM, MAX, MIN, and COUNT were utilized to derive insights and facilitate data manipulation. The conclusion highlights the effectiveness of using Excel for data analysis and decision-making, emphasizing Google's substantial growth in market value and user base during the analyzed period.
Document Page
summative assessments
tabler-icon-diamond-filled.svg

Secure Best Marks with AI Grader

Need help grading? Try our AI Grader for instant feedback on your assignments.
Document Page
Contents
INTRODUCTION...........................................................................................................................3
MAIN BODY..................................................................................................................................3
Topic............................................................................................................................................3
Data collection.............................................................................................................................4
Applying excel formulas..............................................................................................................5
Graphical representation of data..................................................................................................6
Analysis.......................................................................................................................................7
Interpretation................................................................................................................................7
CONCLUSION................................................................................................................................8
REFERENCES................................................................................................................................9
Document Page
INTRODUCTION
Microsoft Office consists of Microsoft PowerPoint, Microsoft Access, Microsoft Excel, and
Microsoft Word, among other programmes. Microsoft Word supports a wide range of operating
systems all across the world. It is capable of editing, formatting, and altering, to name a few
things. A power point presentation is used to create visually appealing slides that help the reader
grasp the report's main point in a nutshell (Wagner, Stuerzlinger, and Nedel, 2021). Excel is a
spreadsheet tool that may be used to store large quantities of data, which can subsequently be
updated and utilised for research. Revenue, user count, and market capitalization are among the
data acquired. Descriptive statistics such as median, mean, and mode are also included.
MAIN BODY
Topic
The firm chosen inside this example is Google. The study focuses on the findings of many
factors such as Google's market capitalization, users, and income. It also contains the company's
and Google's performance, as well as the organization's market share. The organisation has a
variety of responsibilities, for example, it must have data that enables its users to get answers to
their questions with a single click. For successful management of these resources, the company
must focus on its managerial tasks, such as allocating appropriate personnel to meet the
administration's demands.
Revenue, staff count, and capitalization statistics are gathered from a variety of sources that
can be utilised to get raw data.
Primary data is gathered from a direct source of information from which the data may be
extracted, and it is gathered in accordance with the study subject (Ahmad, Singla, and Giri,
2021). This approach collects all essential data related to the study subject. The following are
some of the benefits of using primary data:
New data: The data was acquired directly from the respondents and is brand new
to the study.
Authenticity: Because the data is taken directly from the source of the
information, the chances of inaccuracy are reduced.
Demerits of Primary data:
Primary data collection is a time-consuming process.
Document Page
It might also be costly.
Finding true and truthful interviewers or enumerators is tough.
When using the questionnaire approach, the researcher may run into the issue of
non-response.
Secondary data: This sort of information is gathered from sources that have already gathered
information from a variety of sources based on previously gathered information (Mir, 2019).
This information is easily accessible and can be used for research purposes. Magazines, journals,
newspapers, and internet all include this information.
There are several advantages of using secondary data:
Low-cost: The data is gathered from a variety of sources that are already available. This
may be obtained for free or at a very minimal cost.
Easy access: This form of data is readily provided to clients based on the researcher's
requirements.
Saves time: because the information is not directly collected from the respondents, it may
be accessed whenever and wherever it is needed.
Demerits of Secondary data:
It's possible that it's not tailored to the demands of the researcher.
The researcher has no control over the quality of the data (Heasley, 2021).
Biased
Not on time
The precision of secondary data is unknown.
It's possible that the information is obsolete.
Data collection
Google
Year Market Capitalization (in billion $) Revenue Number of users
202
1 1425 256.74 4738.1388
202
0 745 181.69 4471.0083
201
9 840 160.74 4070.0538
201
8 720 136.36 3956.7462
tabler-icon-diamond-filled.svg

Secure Best Marks with AI Grader

Need help grading? Try our AI Grader for instant feedback on your assignments.
Document Page
201
7 580 110.55 3855.9368
201
6 530 89.98 3363.7296
201
5 375 74.54 2759.3998
Applying excel formulas
Central tendency:
Google
Year Market Capitalization (in billion $) Revenue Number of users
2021 1425 256.74 4738.1388
2020 745 181.69 4471.0083
2019 840 160.74 4070.0538
2018 720 136.36 3956.7462
2017 580 110.55 3855.9368
2016 530 89.98 3363.7296
2015 375 74.54 2759.3998
Mean 745 144.371 3887.859043
Median 720 136.36 3956.7462
Data Manipulation:
Google
Year Market Capitalization (in billion $) Revenue Number of users
2015 375 74.54 2759.3998
2016 530 89.98 3363.7296
2017 580 110.55 3855.9368
2018 720 136.36 3956.7462
2019 840 160.74 4070.0538
2020 745 181.69 4471.0083
2021 1425 256.74 4738.1388
Sum 5215 1010.6 27215.0133
Count 7 7 7
Maximum 1425 256.74 4738.1388
Document Page
Minimum 375 74.54 2759.3998
Graphical representation of data
2015 2016 2017 2018 2019 2020 2021
0
200
400
600
800
1000
1200
1400
1600
Market Capitalization (in billion $)
2015 2016 2017 2018 2019 2020 2021
0
500
1000
1500
2000
2500
3000
3500
4000
4500
5000
Number of users
Document Page
2014 2015 2016 2017 2018 2019 2020 2021 2022
0
50
100
150
200
250
300
Revenue
Analysis
The mean is the value obtained by dividing the total of observations by the sum of all
observations. In the example below, the mean is determined for a period of seven years,
from 2015 to 2021. On average, the company's market capitalization has remained at
$745, its revenue has remained at $144.371, and the number of Google users has
remained at 3887.859. It claims that the average number of all data connected has grown,
resulting in higher wealth for both shareholders and the corporation.
The median is the middle number of the data set that may be calculated using the
formula. It aids in determining the series' middle value. The median market capitalization
is 720, which corresponds to the year 2018, revenue is 136.36, and the number of median
users is 3956.47 million, indicating that the median number of active users on Google is
3956.47 million.
Revenue is calculated by combining several operational actions and calculating averages.
It comes from the income statement (Mounce, 2020). It is used to assess the efficacy and
efficiency of a system.
Interpretation
As can be seen from the above, the company's market capitalisation has increased over time.
It was $375 billion in 2015, but by 2021, it will have risen to 1425 billion. In the previous seven
years, it has increased by more than 3.8 times. The organization's growth has doubled in
tabler-icon-diamond-filled.svg

Paraphrase This Document

Need a fresh take? Get an instant paraphrase of this document with our AI Paraphraser
Document Page
comparison to the previous year. The organization's revenue has also climbed to 256.74 in 2021,
compared to 74.54 in 2015.
In the previous seven years, the organization's revenue has risen by more than thrice. In the
preceding seven years, the company's revenues climbed by $182.2 billion. The number of users
at the organisation has increased dramatically during the previous seven years. Google has
2759.40 users in 2015, a growth of 1979 in the previous seven years.
Sum: When data is available on an excel sheet and the total of the data is required,
the sum function is used to calculate the total of the data available. The sum of the
data sets above is 5215, 1010.6, and 27215.0133.
Maximum: It's used to figure out what the highest number in the data collection is.
It aids in selecting the value in the data series with the maximum number of values.
In the following scenario, the organization's income, wealth, and number of users
peaked in 2021.
Minimum: It's useful for discovering the values that are the lowest in the data
collection. The smallest capitalization value is 375, the smallest revenue is 74.54,
and the smallest number of users is 2759.40.
Count: This function is useful for computing the total number of observations in a
data collection (Febriyanto, Rahayu, Pangaribuan. and Sunarya, 2020). There are a
total of seven values reported in all of the observations. The value of income,
capitalization, and number of users of the organisation are all the same in all three
raw data sets accessible, as they were in the previous seven years.
CONCLUSION
Ms excel is an application that many researchers use to test the performance of excel and
complete tasks, as seen by the preceding study. The computations can be finished in less time as
a result of this. Google was picked as the research topic for this investigation. The data is shown
as charts and tables for making business decisions. The data's insights are determined using
Excel functions such as min, sum, count, and maximum.
Document Page
REFERENCES
Books and Journals
Wagner, J., Stuerzlinger, W. and Nedel, L., 2021. Comparing and combining virtual hand and
virtual ray pointer interactions for data manipulation in immersive analytics. IEEE
Transactions on Visualization and Computer Graphics, 27(5), pp.2513-2523.
Ahmad, G.I., Singla, J. and Giri, K.J., 2021. Security and Privacy of E-health Data.
In Multimedia Security (pp. 199-214). Springer, Singapore.
Mir, S.A., 2019. ICT integrated higher education: Prospects and challenges. International
Journal of Research in Economics and Social Sciences (IJRESS), 8(2), pp.1-4.
Heasley, C., 2021. More than a Data Point: Validating Authentic Identities through ICT-
conscious Practices. In Effective Leadership for Overcoming ICT Challenges in Higher
Education: What Faculty, Staff and Administrators Can Do to Thrive Amidst the Chaos.
Emerald Publishing Limited.
Mounce, S.R., 2020. Data science trends and opportunities for smart water utilities. ICT for
Smart Water Systems: Measurements and Data Science, pp.1-26.
Febriyanto, E., Rahayu, N., Pangaribuan, K. and Sunarya, P.A., 2020, October. Using
Blockchain Data Security Management for E-Voting Systems. In 2020 8th
International Conference on Cyber and IT Service Management (CITSM) (pp. 1-4).
IEEE.
chevron_up_icon
1 out of 9
circle_padding
hide_on_mobile
zoom_out_icon
logo.png

Your All-in-One AI-Powered Toolkit for Academic Success.

Available 24*7 on WhatsApp / Email

[object Object]