Data Analysis Report: Google's Market Performance, Revenue, and Users
VerifiedAdded on  2023/06/10
|8
|1600
|378
Report
AI Summary
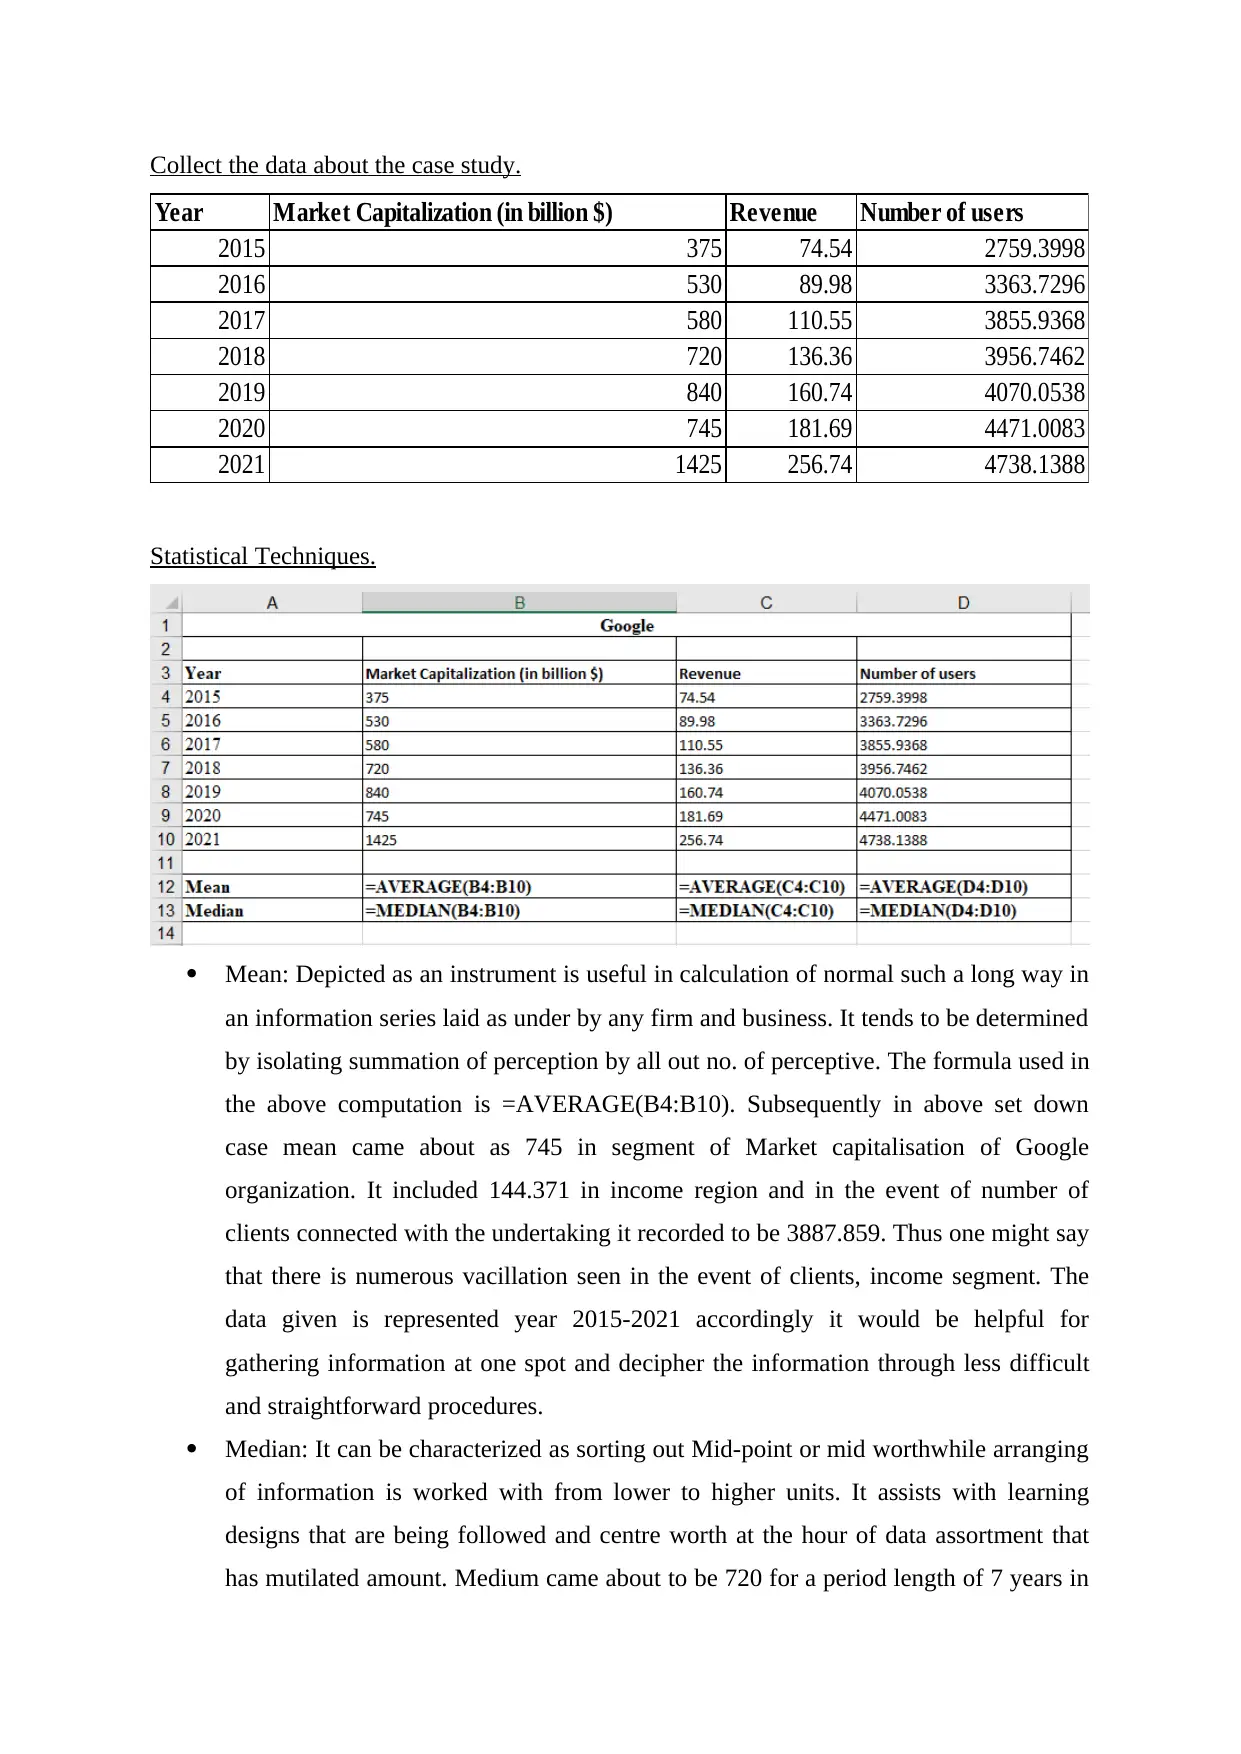
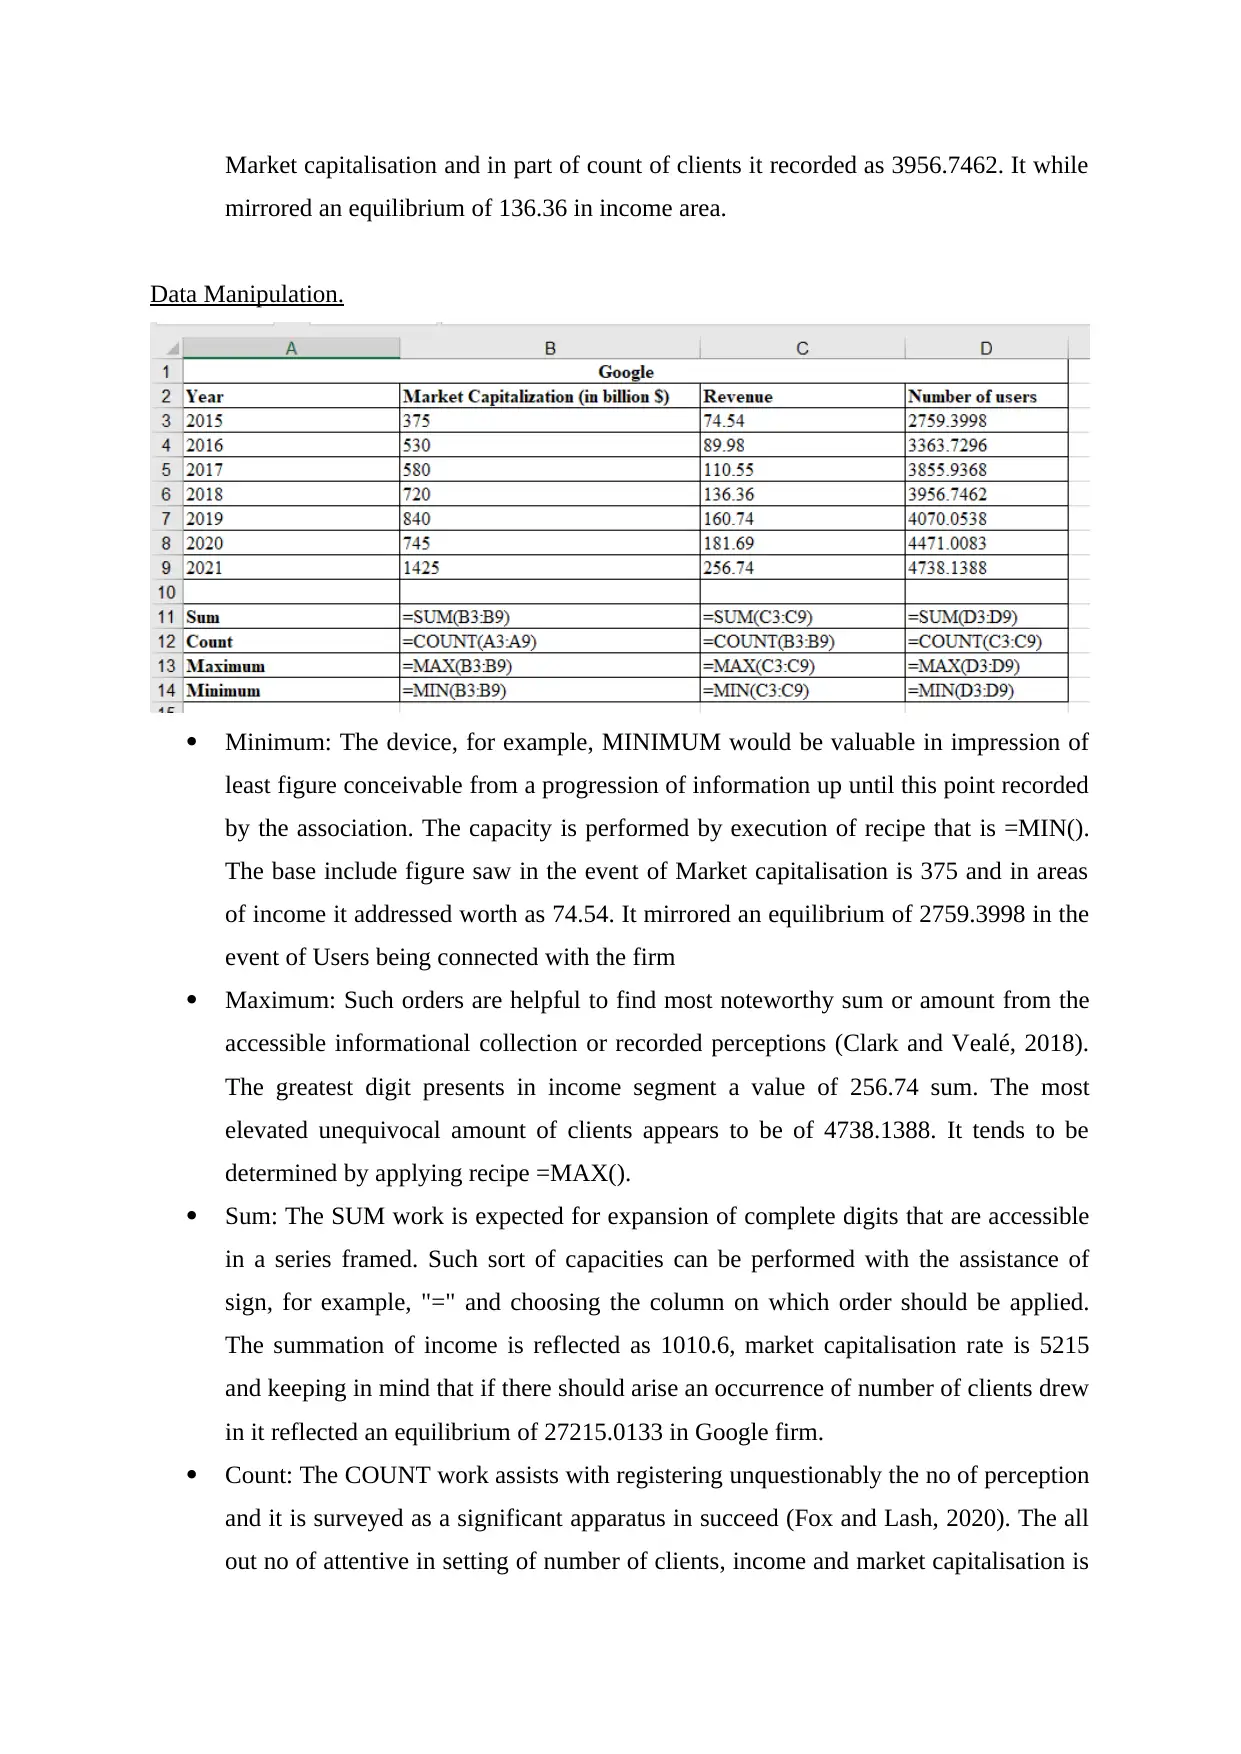
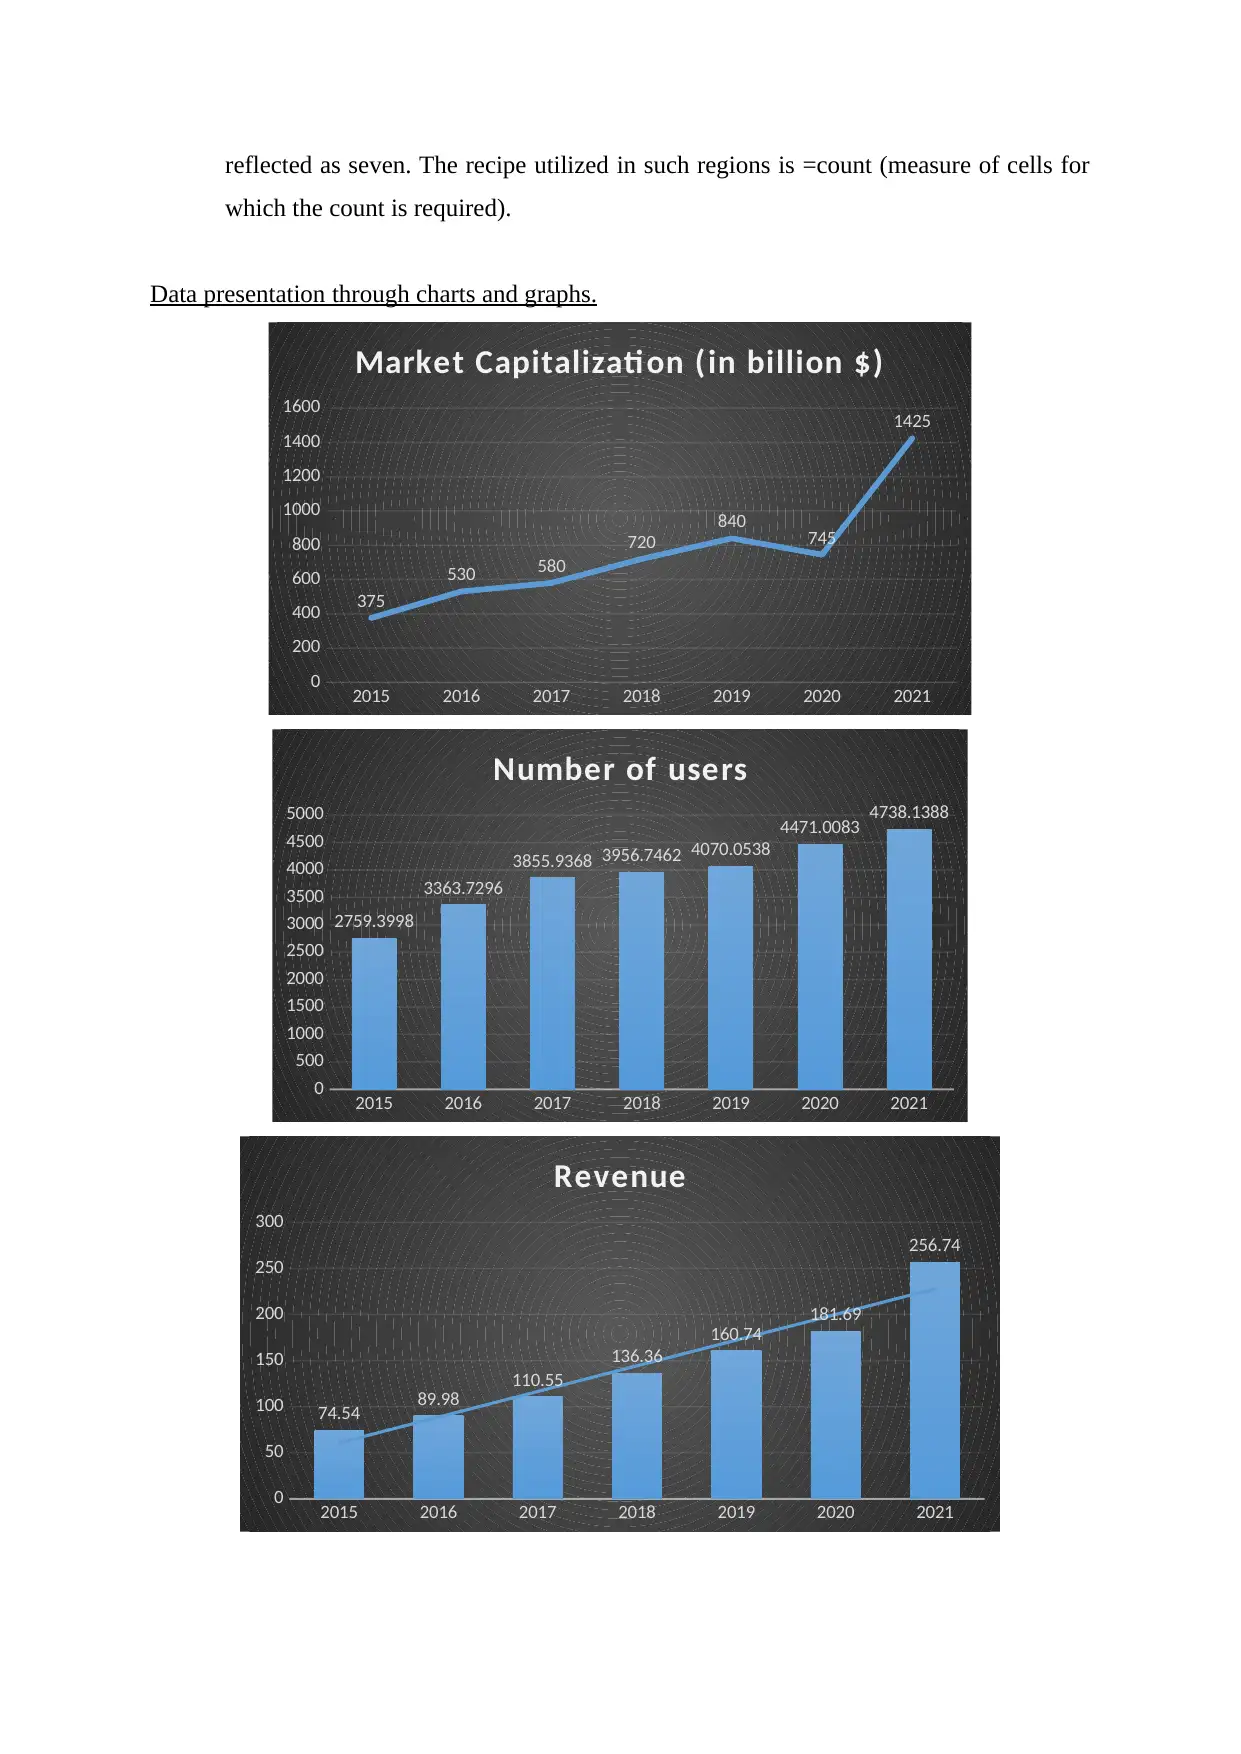
This report analyzes Google's market performance from 2015 to 2021, focusing on market capitalization, revenue, and user data. It utilizes statistical techniques like mean, median, minimum, maximum, sum, and count to manipulate and interpret the data. The report leverages MS Excel for data presentation through charts and graphs, providing a clear overview of Google's financial trends. The analysis highlights significant growth in market capitalization and the importance of data-driven insights for business decision-making. The report concludes by emphasizing the usefulness of MS Excel in performing various tasks related to data analysis and its role in improving financial performance. The report also includes references to relevant books and journals.
Contribute Materials
Your contribution can guide someone’s learning journey. Share your
documents today.

DHICT Assessment
Brief
Brief
Secure Best Marks with AI Grader
Need help grading? Try our AI Grader for instant feedback on your assignments.

Contents
INTRODUCTION......................................................................................................................3
MAIN BODY.............................................................................................................................3
Choose any research topic......................................................................................................3
Collect the data about the case study.....................................................................................4
Statistical Techniques.............................................................................................................4
Data Manipulation..................................................................................................................5
Data presentation through charts and graphs.........................................................................6
Data Interpretation.................................................................................................................7
CONCLUSION..........................................................................................................................7
REFERENCES...........................................................................................................................8

INTRODUCTION
The report prepared under considers the purposes of Microsoft office in an
organization and business related exercises. It makes sense of different focuses considered,
for example, Microsoft power point supportive in willingness of introductions, MS word
which assists with building exhaustive reports, MS excel which is useful in completing
complex estimations. It is utilized for loading information at a bigger scope and is useful in
handling a few choices of the organization (Balakrishnan, Ling and So, 2021). Such report
considers significant data in setting of Google, it additionally works in web related items and
administrations. It incorporates online mechanism for creating notices, web search tools and
distributed computing programming also. Significant perspectives, for example, income,
market capitalisation and number of clients is additionally remembered for the report gave.
MAIN BODY
Choose any research topic.
In the research the case study of Google has been chosen. The report did is tied in
with looking and tracking down multiple ways for arranging data. It fills in as an aide for
registering market capitalisation, income produced by the firm and clients connected with the
venture.
The evaluation content for the finding is Google. It will portray whether the method
would be useful in further developing business related results and execution. There is
different job performed by trend setting innovation in organizations, for example, keeping up
with the degree of stock. There should not be circumstances which prompts stacking up of
stock and lack in accessible stock (Baldissone and et.al., 2019). The state of stock out will
limit the brand picture, and heaped stock would prompt ascending of conveying cost. For
powerful administration of assets there are a few programming expected for instance stock
administration that aid designation of assets in an appropriate manner.

Collect the data about the case study.
Year Market Capitalization (in billion $) Revenue Number of users
2015 375 74.54 2759.3998
2016 530 89.98 3363.7296
2017 580 110.55 3855.9368
2018 720 136.36 3956.7462
2019 840 160.74 4070.0538
2020 745 181.69 4471.0083
2021 1425 256.74 4738.1388
Statistical Techniques.
ď‚· Mean: Depicted as an instrument is useful in calculation of normal such a long way in
an information series laid as under by any firm and business. It tends to be determined
by isolating summation of perception by all out no. of perceptive. The formula used in
the above computation is =AVERAGE(B4:B10). Subsequently in above set down
case mean came about as 745 in segment of Market capitalisation of Google
organization. It included 144.371 in income region and in the event of number of
clients connected with the undertaking it recorded to be 3887.859. Thus one might say
that there is numerous vacillation seen in the event of clients, income segment. The
data given is represented year 2015-2021 accordingly it would be helpful for
gathering information at one spot and decipher the information through less difficult
and straightforward procedures.
ď‚· Median: It can be characterized as sorting out Mid-point or mid worthwhile arranging
of information is worked with from lower to higher units. It assists with learning
designs that are being followed and centre worth at the hour of data assortment that
has mutilated amount. Medium came about to be 720 for a period length of 7 years in
Secure Best Marks with AI Grader
Need help grading? Try our AI Grader for instant feedback on your assignments.

Market capitalisation and in part of count of clients it recorded as 3956.7462. It while
mirrored an equilibrium of 136.36 in income area.
Data Manipulation.
ď‚· Minimum: The device, for example, MINIMUM would be valuable in impression of
least figure conceivable from a progression of information up until this point recorded
by the association. The capacity is performed by execution of recipe that is =MIN().
The base include figure saw in the event of Market capitalisation is 375 and in areas
of income it addressed worth as 74.54. It mirrored an equilibrium of 2759.3998 in the
event of Users being connected with the firm
ď‚· Maximum: Such orders are helpful to find most noteworthy sum or amount from the
accessible informational collection or recorded perceptions (Clark and Vealé, 2018).
The greatest digit presents in income segment a value of 256.74 sum. The most
elevated unequivocal amount of clients appears to be of 4738.1388. It tends to be
determined by applying recipe =MAX().
ď‚· Sum: The SUM work is expected for expansion of complete digits that are accessible
in a series framed. Such sort of capacities can be performed with the assistance of
sign, for example, "=" and choosing the column on which order should be applied.
The summation of income is reflected as 1010.6, market capitalisation rate is 5215
and keeping in mind that if there should arise an occurrence of number of clients drew
in it reflected an equilibrium of 27215.0133 in Google firm.
ď‚· Count: The COUNT work assists with registering unquestionably the no of perception
and it is surveyed as a significant apparatus in succeed (Fox and Lash, 2020). The all
out no of attentive in setting of number of clients, income and market capitalisation is

reflected as seven. The recipe utilized in such regions is =count (measure of cells for
which the count is required).
Data presentation through charts and graphs.
2015 2016 2017 2018 2019 2020 2021
0
200
400
600
800
1000
1200
1400
1600
375
530 580
720
840 745
1425
Market Capitalizati on (in billion $)
2015 2016 2017 2018 2019 2020 2021
0
500
1000
1500
2000
2500
3000
3500
4000
4500
5000
2759.3998
3363.7296
3855.9368 3956.7462 4070.0538
4471.0083 4738.1388
Number of users
2015 2016 2017 2018 2019 2020 2021
0
50
100
150
200
250
300
74.54 89.98
110.55
136.36
160.74
181.69
256.74
Revenue

Data Interpretation.
It very well may be expressed as the benefit that is being procured by an organization
throughout as timeframe by playing out a few activities based exercises and ascertaining
normal expense of selling (Castleberry and Nolen, 2018). It can likewise be refereed as Sales
on pay proclamation or records. It further acts as a method which evaluate the working and
working of organization's promoting and deal though reserve stream is considered a sign of
liquidity kept up with up until this point. The market capitalisation of the organisation Google
is growing over the years. Also, in 2020 it was only $745 billion but in 23021 it took a major
upsurge of about 50% increase in the market capitalisation. In 2021 it became $1425 billion.
CONCLUSION
From the above stated report, it tends to be finished up and deciphered too that Ms
succeed gives helpful direction to performing different undertakings doled out in an
organization. It helps in readiness of exploration reports, arranging of information, lessening
responsibility of analysts and limiting assignments that count confounded errands. The
complicated computations can be done in lesser span. It considers graphs, tables that
assistance to figure out what has been rise and fall in number of clients drew in and fixed
with the organization. It takes information for more than 7 years and apply summation of
information, its middle and normal also. It further helps with picking best choice from
accessible options that would help in further developing the money based execution of the
firm. The report likewise presents tables and graphs that give a clearer picture and picture
which would be valuable for clients that need to appropriately design their assets and
activities. It additionally assists with performing different orders that would help in arranging
of information in an easier way for longer timeframe in a business. Hence it is important for
organizations to zero in on such devices and methods.
Paraphrase This Document
Need a fresh take? Get an instant paraphrase of this document with our AI Paraphraser

REFERENCES
Books and Journals
Balakrishnan, N., Ling, M.H. and So, H.Y., 2021. Accelerated life testing of one-shot
devices: Data collection and analysis. John Wiley & Sons.
Baldissone, G and et.al., 2019. The analysis and management of unsafe acts and unsafe
conditions. Data collection and analysis. Safety Science, 119, pp.240-251.
Castleberry, A. and Nolen, A., 2018. Thematic analysis of qualitative research data: Is it as
easy as it sounds?. Currents in pharmacy teaching and learning, 10(6), pp.807-815.
Clark, K.R. and Vealé, B.L., 2018. Strategies to enhance data collection and analysis in
qualitative research. Radiologic technology, 89(5), pp.482CT-485CT.
Fox, M.P. and Lash, T.L., 2020. Quantitative bias analysis for study and grant
planning. Annals of Epidemiology, 43, pp.32-36.
1 out of 8
Related Documents

Your All-in-One AI-Powered Toolkit for Academic Success.
 +13062052269
info@desklib.com
Available 24*7 on WhatsApp / Email
Unlock your academic potential
© 2024  |  Zucol Services PVT LTD  |  All rights reserved.