Comprehensive Data Analysis Report: Google Play App Performance
VerifiedAdded on 2021/02/19
|12
|2172
|39
Report
AI Summary
This report presents a statistical analysis of Google Play applications, focusing on various aspects such as free versus paid apps, the significance of communication and game apps, and the relationship between app ratings and the number of reviews. The study utilizes t-tests to assess differences between app categories and correlation analysis to understand relationships between variables. The analysis reveals that unpaid apps are preferred, and there are significant differences between communication and game apps. The report also examines the relationship between countries and communication apps. The conclusion highlights key findings and offers recommendations for Google Play, including strategies to increase the effectiveness of its offerings, such as advertising and free demos, to enhance the user experience and expand its market reach. The report uses data from Google Play Store user reviews and provides insights into user behavior and app performance.
Statistics and Data Analysis
Paraphrase This Document
Need a fresh take? Get an instant paraphrase of this document with our AI Paraphraser
Table of Contents
Section 1..........................................................................................................................................3
Introduction..................................................................................................................................3
Aims and Objectives....................................................................................................................3
Literature review..........................................................................................................................3
Section 2..........................................................................................................................................4
Section 3..........................................................................................................................................5
Section 4..........................................................................................................................................5
Section 5..........................................................................................................................................8
Section 6..........................................................................................................................................9
Section 7........................................................................................................................................10
Conclusion and recommendations.............................................................................................10
CONCLUSION..............................................................................................................................11
REFERENCES................................................................................................................................1
Section 1
Introduction
Statistics and data analysis can be determined as a process in which several data is being
gathered or obtained through the creation of hypothesis which is being analysed for the purpose
of determining appropriate findings for which the data is being collected (Latif and et.al., 2019).
Present study is based on Google play which is a digital distribution service operated and
developed by Google. Further this study involves a literature review. This also contains an
analysis of a data for determining specific aims and objectives of doing this study.
Aims and Objectives
Aim: To understand the significance of google play applications in communication and
determining the sources of funding of the applications
Objectives
To analyse the funding of free Google play apps
To assess the reason of price difference in paid apps.
To investigate the use of communication apps among international students in different
countries.
To predict the rating of different Google play app in order to find out the most used app.
Literature review
According to Frie and et.al., (2017), Mobile phones and tablets have become essentiality for each
and every human being in the society. These devices are being used by the people for spending
their free time, or for performing several business activities and mostly for connection to each
other in the society. In order to fulfil all these aspects, people have to use several applications
which are easily available on the google play store. There are majorly free applications in the
play store but there are also some paid applications for which people have to pay specific amount
to use these services. It is being evaluated that around 82 % of applications in play store are free
where as remaining are paid. The free applications are being developed and grown by the fund
from several advertising companies who pays for their advertisement for famous and most used
applications of play store.
⊘ This is a preview!⊘
Do you want full access?
Subscribe today to unlock all pages.
Trusted by 1+ million students worldwide
As per Martin, Sarro and Harman (2016), the major reason for the differentiation of prices in the
google play application are according to their features. These prices are being set according to
their distinctive features of each specific application of google play. According to Martin (2016)
, it is being observed that, most of the students that are residing outside their home countries, are
being involved in usage of google play applications for the purpose of communicating with their
family and friends who are residing in their nations. These social media applications have
facilitated the users for communicating with their peers in a more easy and convenient manner
with the use of internet connectivity around the globe.
Section 2
Count -
Type
Type Total
Free 3718
Paid 282
Grand
Total 4000
Free 93%
Paid 7%
Total 100%
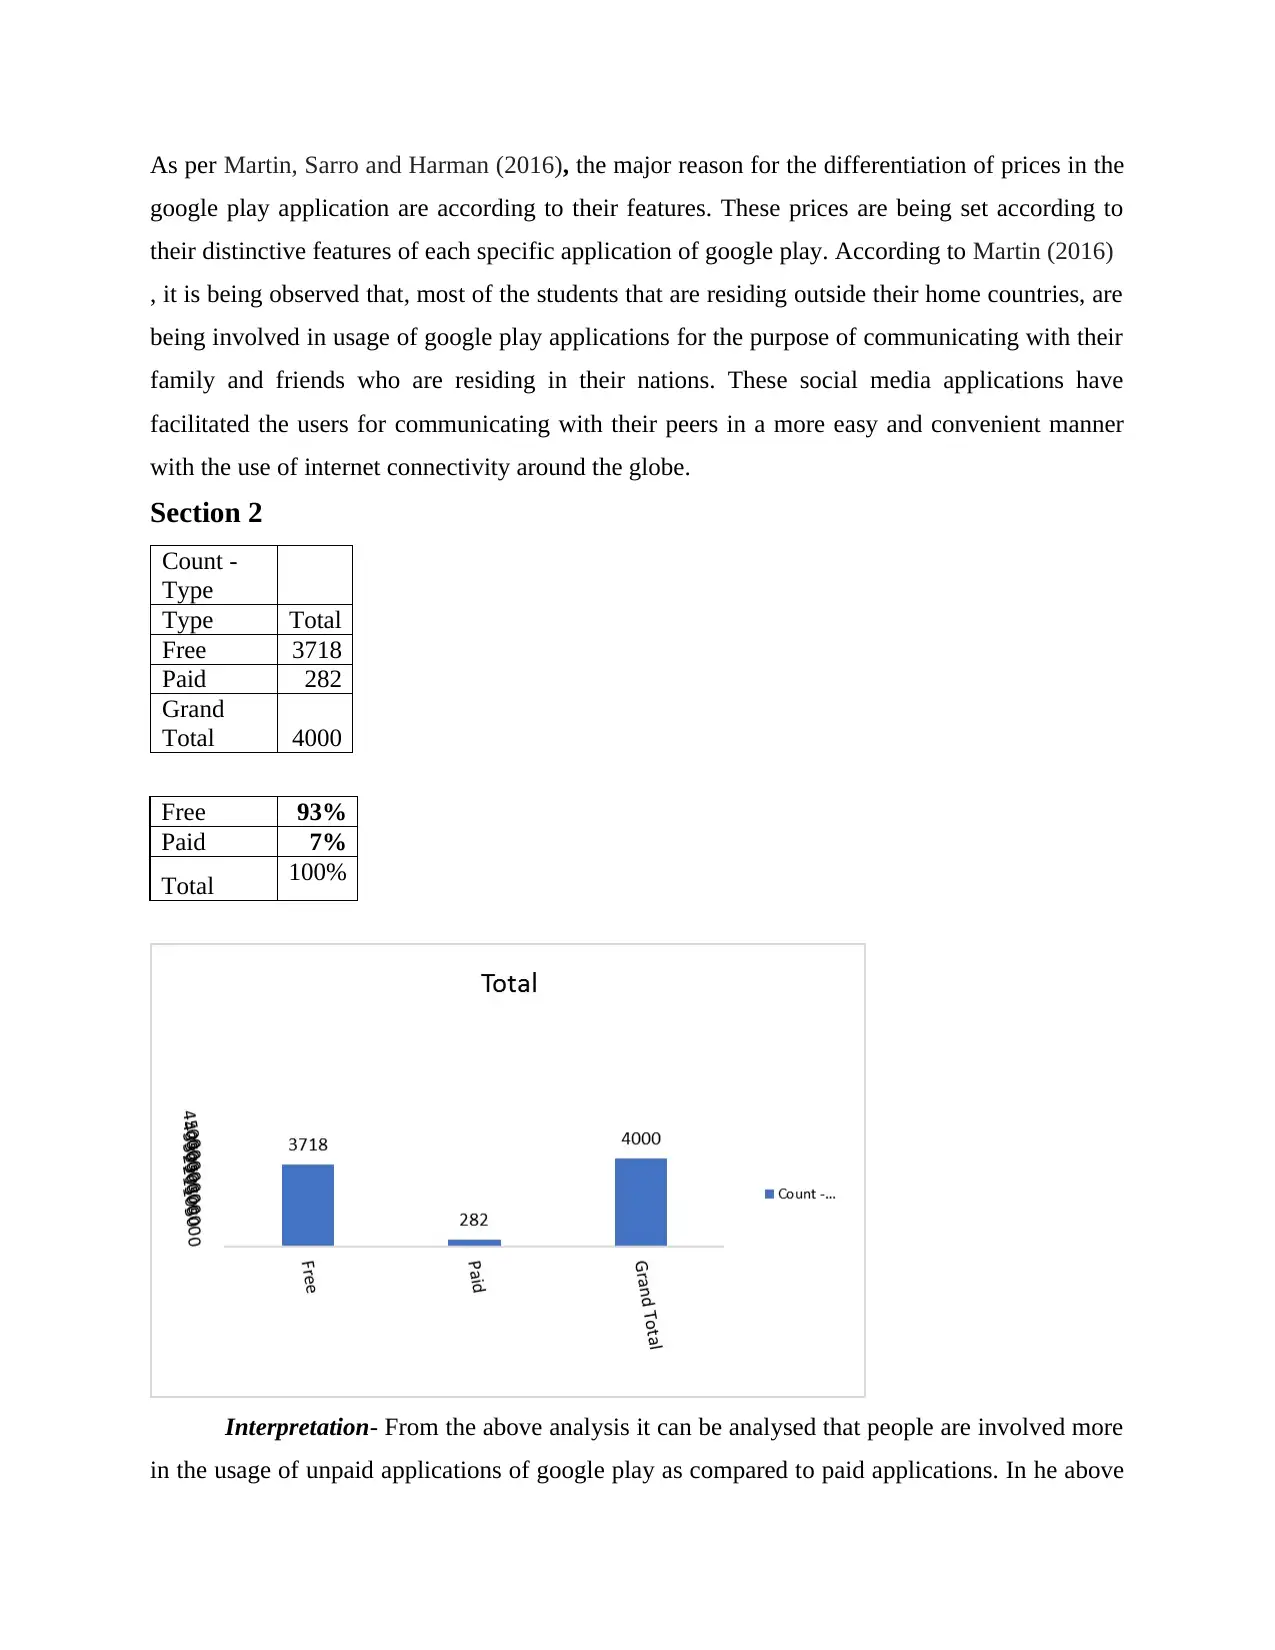
Interpretation- From the above analysis it can be analysed that people are involved more
in the usage of unpaid applications of google play as compared to paid applications. In he above
google play application are according to their features. These prices are being set according to
their distinctive features of each specific application of google play. According to Martin (2016)
, it is being observed that, most of the students that are residing outside their home countries, are
being involved in usage of google play applications for the purpose of communicating with their
family and friends who are residing in their nations. These social media applications have
facilitated the users for communicating with their peers in a more easy and convenient manner
with the use of internet connectivity around the globe.
Section 2
Count -
Type
Type Total
Free 3718
Paid 282
Grand
Total 4000
Free 93%
Paid 7%
Total 100%
Interpretation- From the above analysis it can be analysed that people are involved more
in the usage of unpaid applications of google play as compared to paid applications. In he above
Paraphrase This Document
Need a fresh take? Get an instant paraphrase of this document with our AI Paraphraser
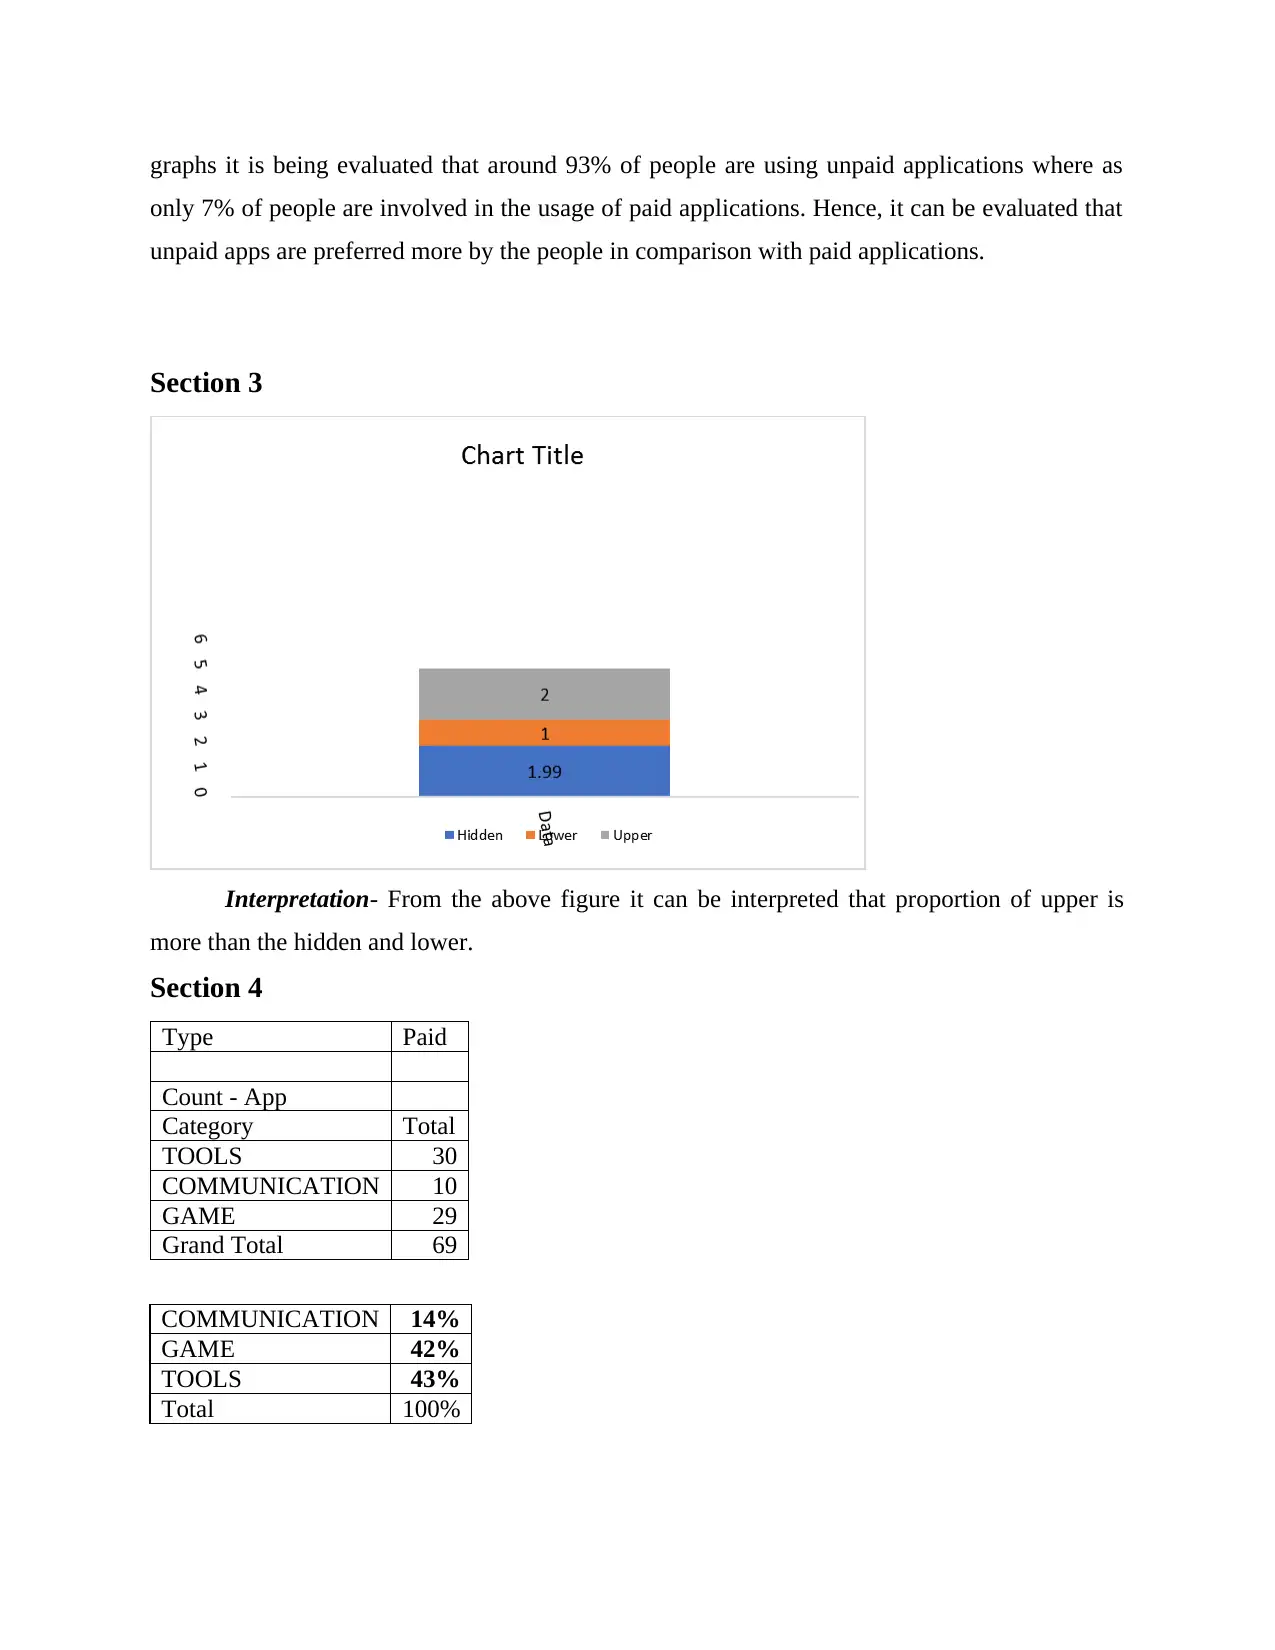
graphs it is being evaluated that around 93% of people are using unpaid applications where as
only 7% of people are involved in the usage of paid applications. Hence, it can be evaluated that
unpaid apps are preferred more by the people in comparison with paid applications.
Section 3
Interpretation- From the above figure it can be interpreted that proportion of upper is
more than the hidden and lower.
Section 4
Type Paid
Count - App
Category Total
TOOLS 30
COMMUNICATION 10
GAME 29
Grand Total 69
COMMUNICATION 14%
GAME 42%
TOOLS 43%
Total 100%
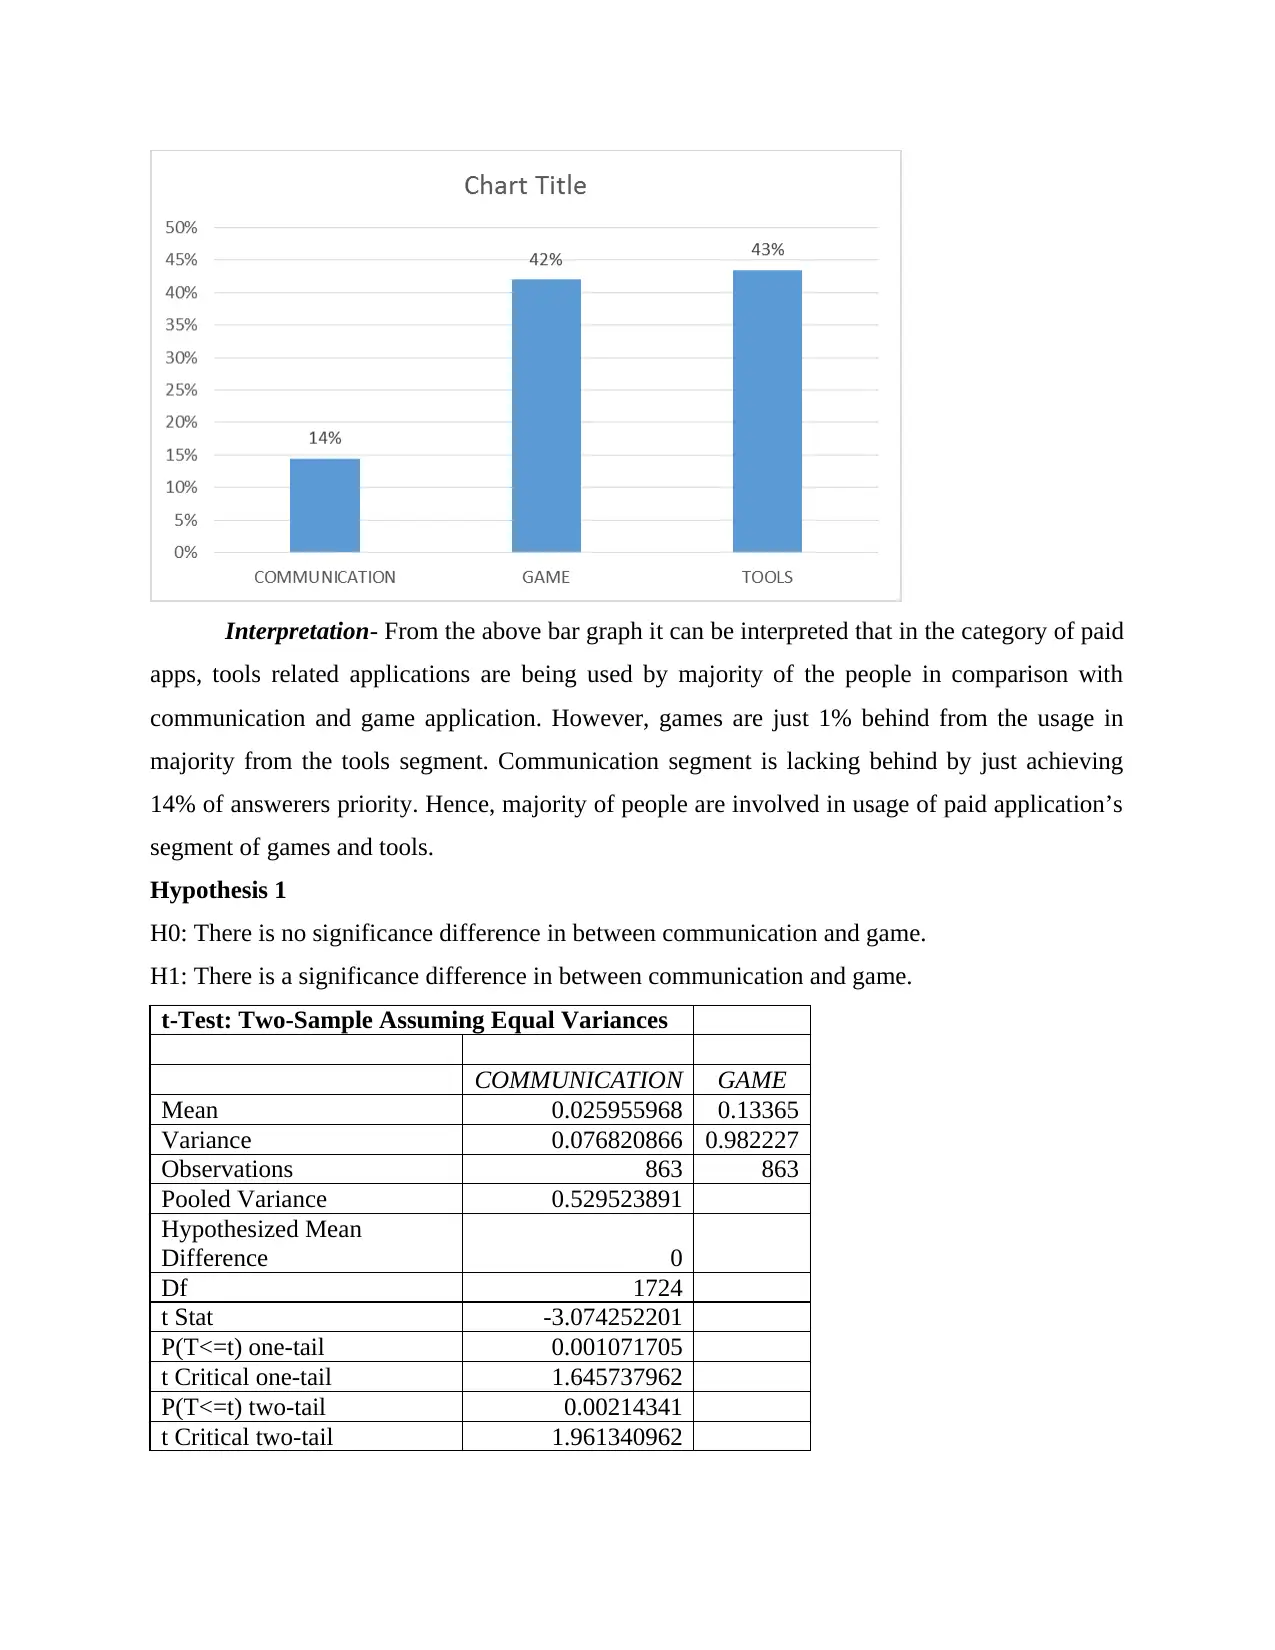
Interpretation- From the above bar graph it can be interpreted that in the category of paid
apps, tools related applications are being used by majority of the people in comparison with
communication and game application. However, games are just 1% behind from the usage in
majority from the tools segment. Communication segment is lacking behind by just achieving
14% of answerers priority. Hence, majority of people are involved in usage of paid application’s
segment of games and tools.
Hypothesis 1
H0: There is no significance difference in between communication and game.
H1: There is a significance difference in between communication and game.
t-Test: Two-Sample Assuming Equal Variances
COMMUNICATION GAME
Mean 0.025955968 0.13365
Variance 0.076820866 0.982227
Observations 863 863
Pooled Variance 0.529523891
Hypothesized Mean
Difference 0
Df 1724
t Stat -3.074252201
P(T<=t) one-tail 0.001071705
t Critical one-tail 1.645737962
P(T<=t) two-tail 0.00214341
t Critical two-tail 1.961340962
⊘ This is a preview!⊘
Do you want full access?
Subscribe today to unlock all pages.
Trusted by 1+ million students worldwide
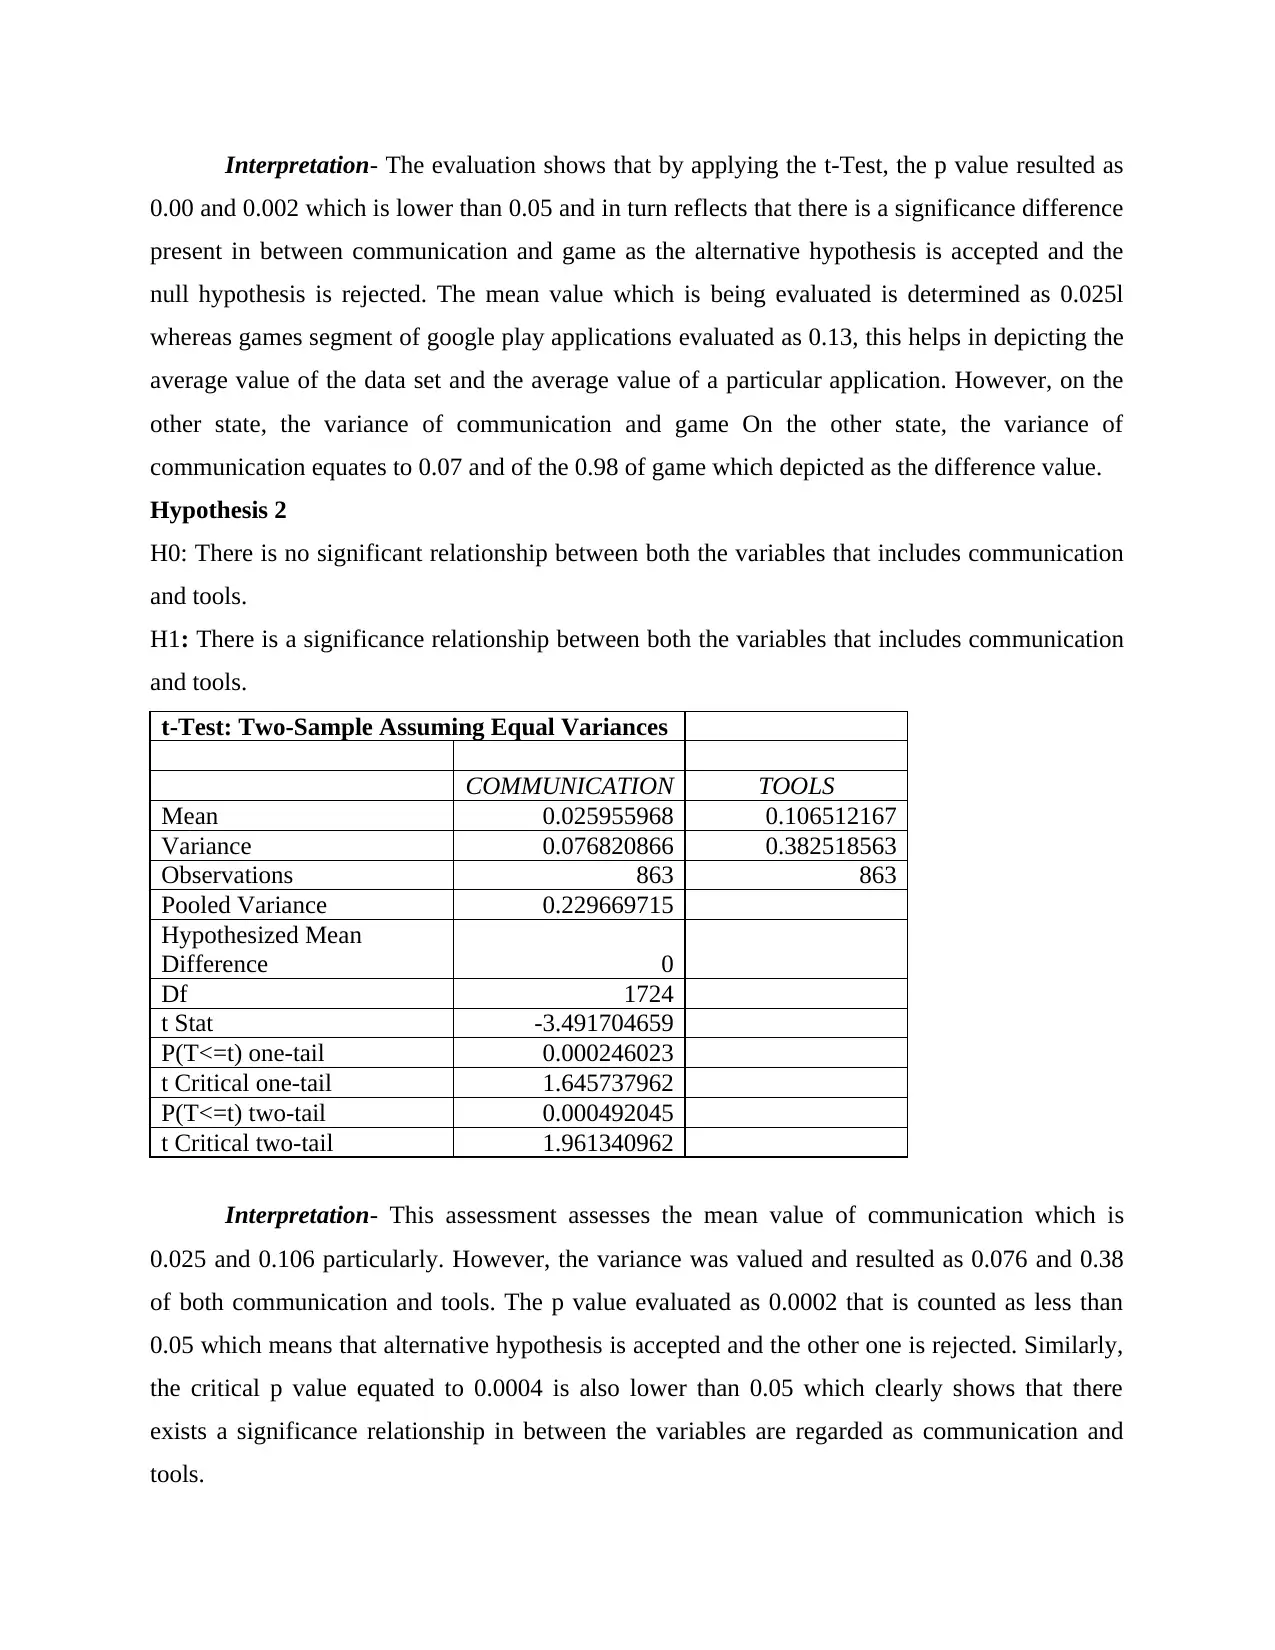
Interpretation- The evaluation shows that by applying the t-Test, the p value resulted as
0.00 and 0.002 which is lower than 0.05 and in turn reflects that there is a significance difference
present in between communication and game as the alternative hypothesis is accepted and the
null hypothesis is rejected. The mean value which is being evaluated is determined as 0.025l
whereas games segment of google play applications evaluated as 0.13, this helps in depicting the
average value of the data set and the average value of a particular application. However, on the
other state, the variance of communication and game On the other state, the variance of
communication equates to 0.07 and of the 0.98 of game which depicted as the difference value.
Hypothesis 2
H0: There is no significant relationship between both the variables that includes communication
and tools.
H1: There is a significance relationship between both the variables that includes communication
and tools.
t-Test: Two-Sample Assuming Equal Variances
COMMUNICATION TOOLS
Mean 0.025955968 0.106512167
Variance 0.076820866 0.382518563
Observations 863 863
Pooled Variance 0.229669715
Hypothesized Mean
Difference 0
Df 1724
t Stat -3.491704659
P(T<=t) one-tail 0.000246023
t Critical one-tail 1.645737962
P(T<=t) two-tail 0.000492045
t Critical two-tail 1.961340962
Interpretation- This assessment assesses the mean value of communication which is
0.025 and 0.106 particularly. However, the variance was valued and resulted as 0.076 and 0.38
of both communication and tools. The p value evaluated as 0.0002 that is counted as less than
0.05 which means that alternative hypothesis is accepted and the other one is rejected. Similarly,
the critical p value equated to 0.0004 is also lower than 0.05 which clearly shows that there
exists a significance relationship in between the variables are regarded as communication and
tools.
Paraphrase This Document
Need a fresh take? Get an instant paraphrase of this document with our AI Paraphraser
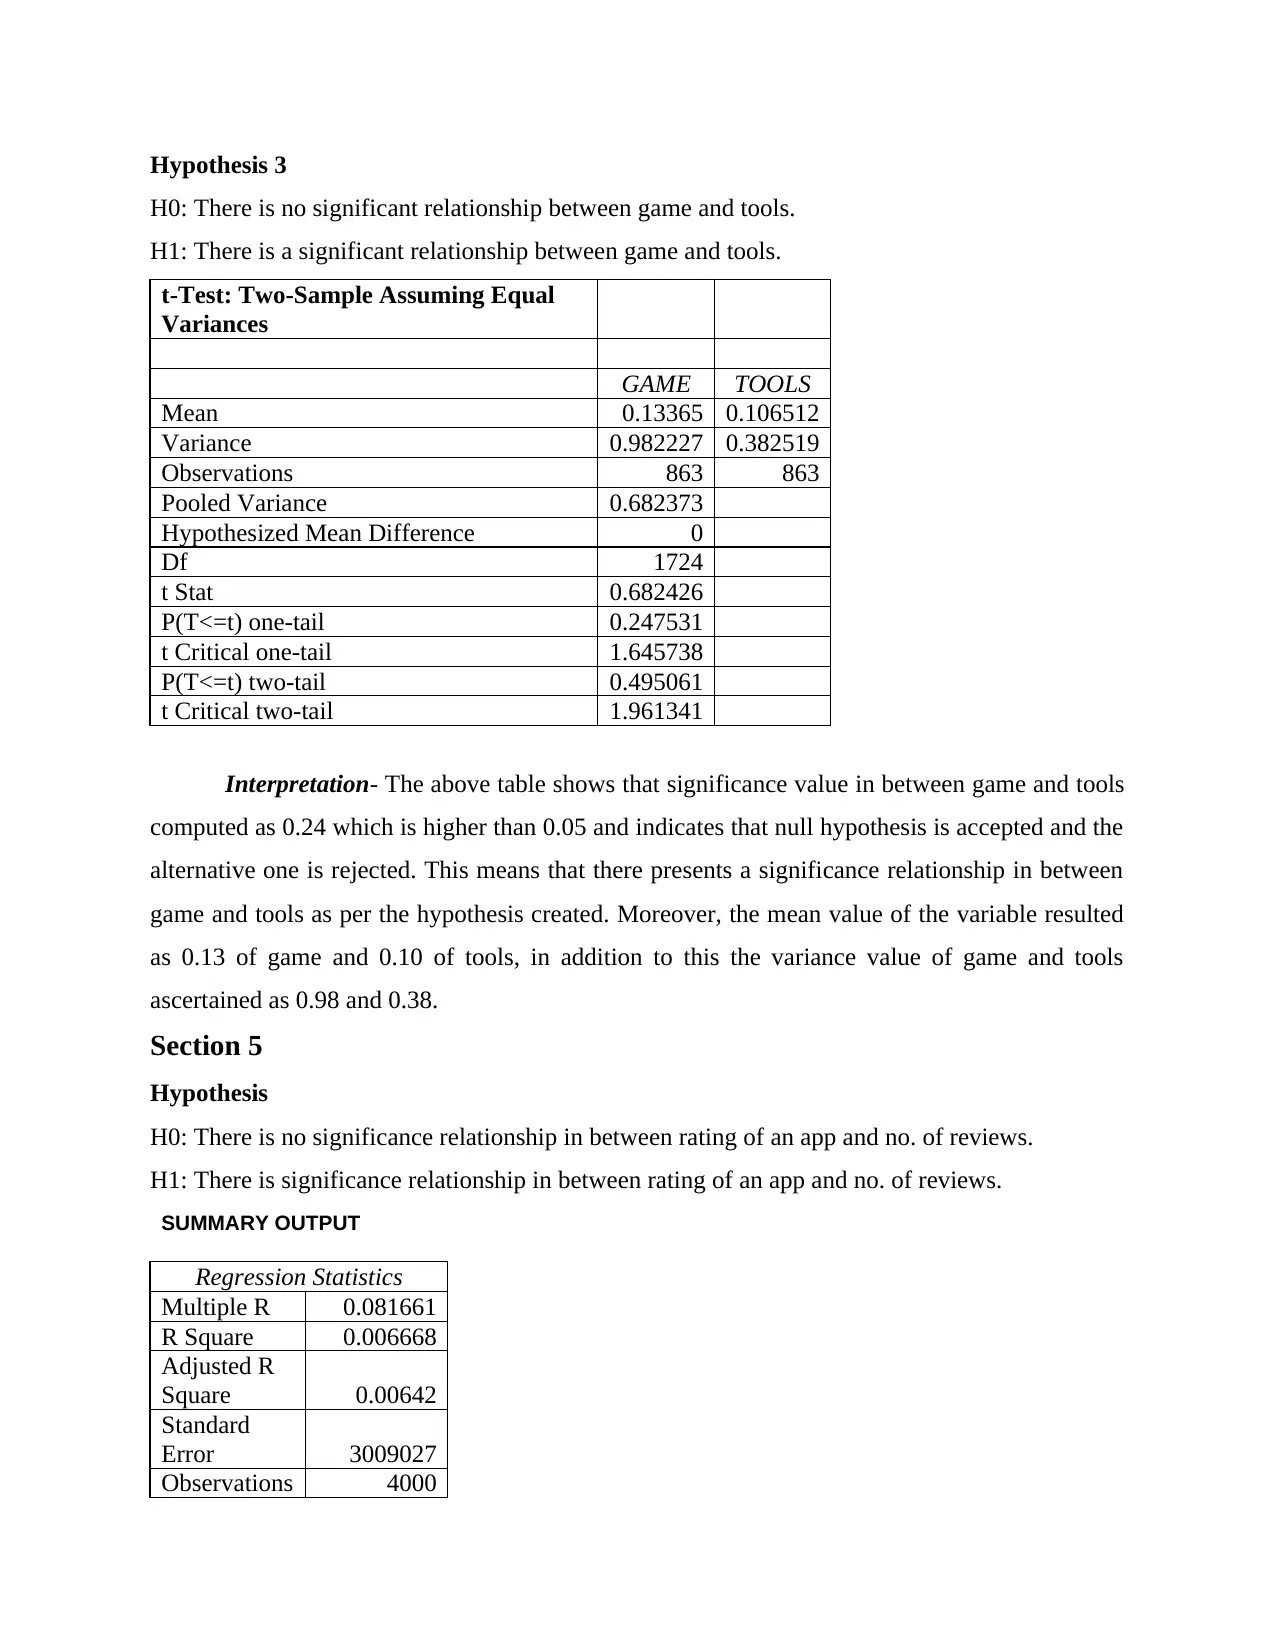
Hypothesis 3
H0: There is no significant relationship between game and tools.
H1: There is a significant relationship between game and tools.
t-Test: Two-Sample Assuming Equal
Variances
GAME TOOLS
Mean 0.13365 0.106512
Variance 0.982227 0.382519
Observations 863 863
Pooled Variance 0.682373
Hypothesized Mean Difference 0
Df 1724
t Stat 0.682426
P(T<=t) one-tail 0.247531
t Critical one-tail 1.645738
P(T<=t) two-tail 0.495061
t Critical two-tail 1.961341
Interpretation- The above table shows that significance value in between game and tools
computed as 0.24 which is higher than 0.05 and indicates that null hypothesis is accepted and the
alternative one is rejected. This means that there presents a significance relationship in between
game and tools as per the hypothesis created. Moreover, the mean value of the variable resulted
as 0.13 of game and 0.10 of tools, in addition to this the variance value of game and tools
ascertained as 0.98 and 0.38.
Section 5
Hypothesis
H0: There is no significance relationship in between rating of an app and no. of reviews.
H1: There is significance relationship in between rating of an app and no. of reviews.
SUMMARY OUTPUT
Regression Statistics
Multiple R 0.081661
R Square 0.006668
Adjusted R
Square 0.00642
Standard
Error 3009027
Observations 4000
ANOVA
df SS MS F
Significance
F
Regression 1 2.43E+14 2.43E+14 26.83955 2.32E-07
Residual 3998 3.62E+16 9.05E+12
Total 3999 3.64E+16
Coefficients
Standard
Error t Stat P-value Lower 95%
Upper
95%
Lower
95.0%
Upper
95.0%
Intercept -1474157 389936 -3.78051 0.000159 -2238649 -709665
-
2238649 -70966
Rating 478659.4 92392.99 5.18069 2.32E-07 297517.7 659801.2 297517.7 659801.
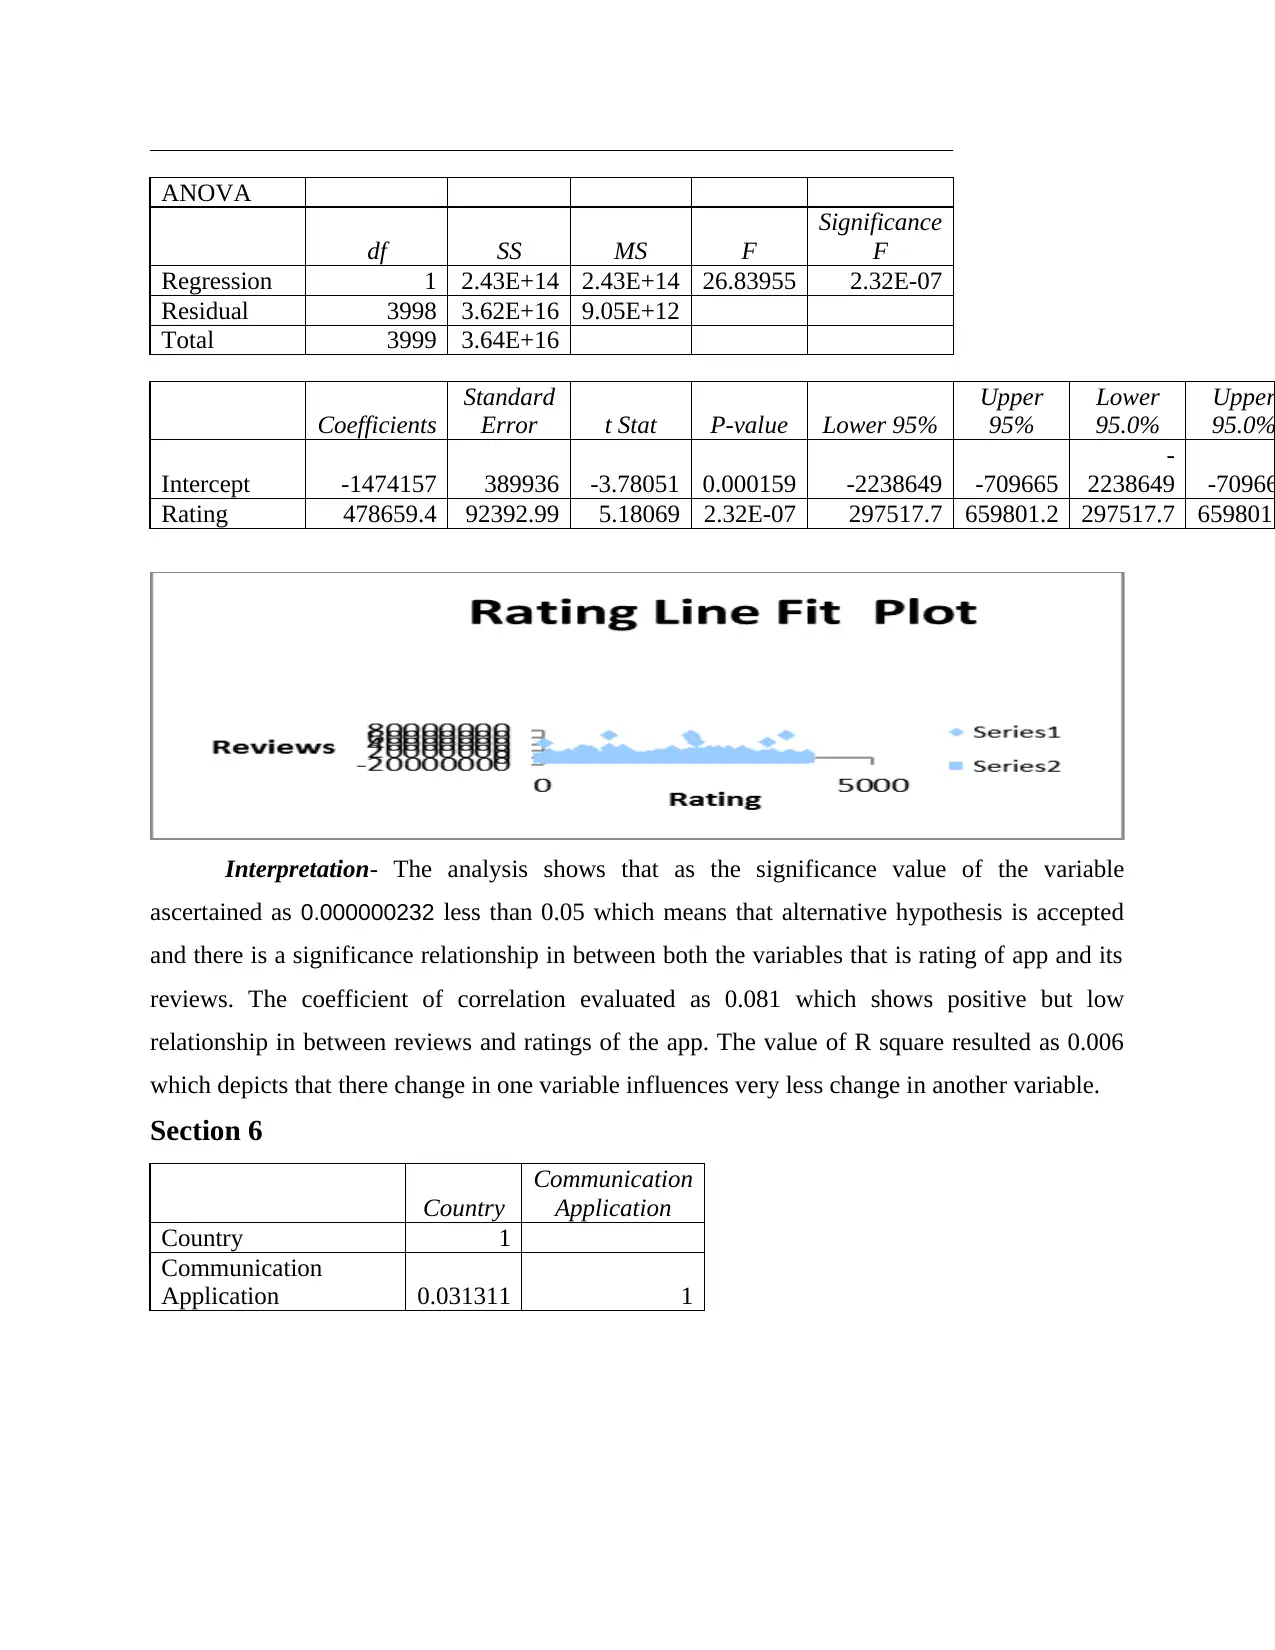
Interpretation- The analysis shows that as the significance value of the variable
ascertained as 0.000000232 less than 0.05 which means that alternative hypothesis is accepted
and there is a significance relationship in between both the variables that is rating of app and its
reviews. The coefficient of correlation evaluated as 0.081 which shows positive but low
relationship in between reviews and ratings of the app. The value of R square resulted as 0.006
which depicts that there change in one variable influences very less change in another variable.
Section 6
Country
Communication
Application
Country 1
Communication
Application 0.031311 1
df SS MS F
Significance
F
Regression 1 2.43E+14 2.43E+14 26.83955 2.32E-07
Residual 3998 3.62E+16 9.05E+12
Total 3999 3.64E+16
Coefficients
Standard
Error t Stat P-value Lower 95%
Upper
95%
Lower
95.0%
Upper
95.0%
Intercept -1474157 389936 -3.78051 0.000159 -2238649 -709665
-
2238649 -70966
Rating 478659.4 92392.99 5.18069 2.32E-07 297517.7 659801.2 297517.7 659801.
Interpretation- The analysis shows that as the significance value of the variable
ascertained as 0.000000232 less than 0.05 which means that alternative hypothesis is accepted
and there is a significance relationship in between both the variables that is rating of app and its
reviews. The coefficient of correlation evaluated as 0.081 which shows positive but low
relationship in between reviews and ratings of the app. The value of R square resulted as 0.006
which depicts that there change in one variable influences very less change in another variable.
Section 6
Country
Communication
Application
Country 1
Communication
Application 0.031311 1
⊘ This is a preview!⊘
Do you want full access?
Subscribe today to unlock all pages.
Trusted by 1+ million students worldwide
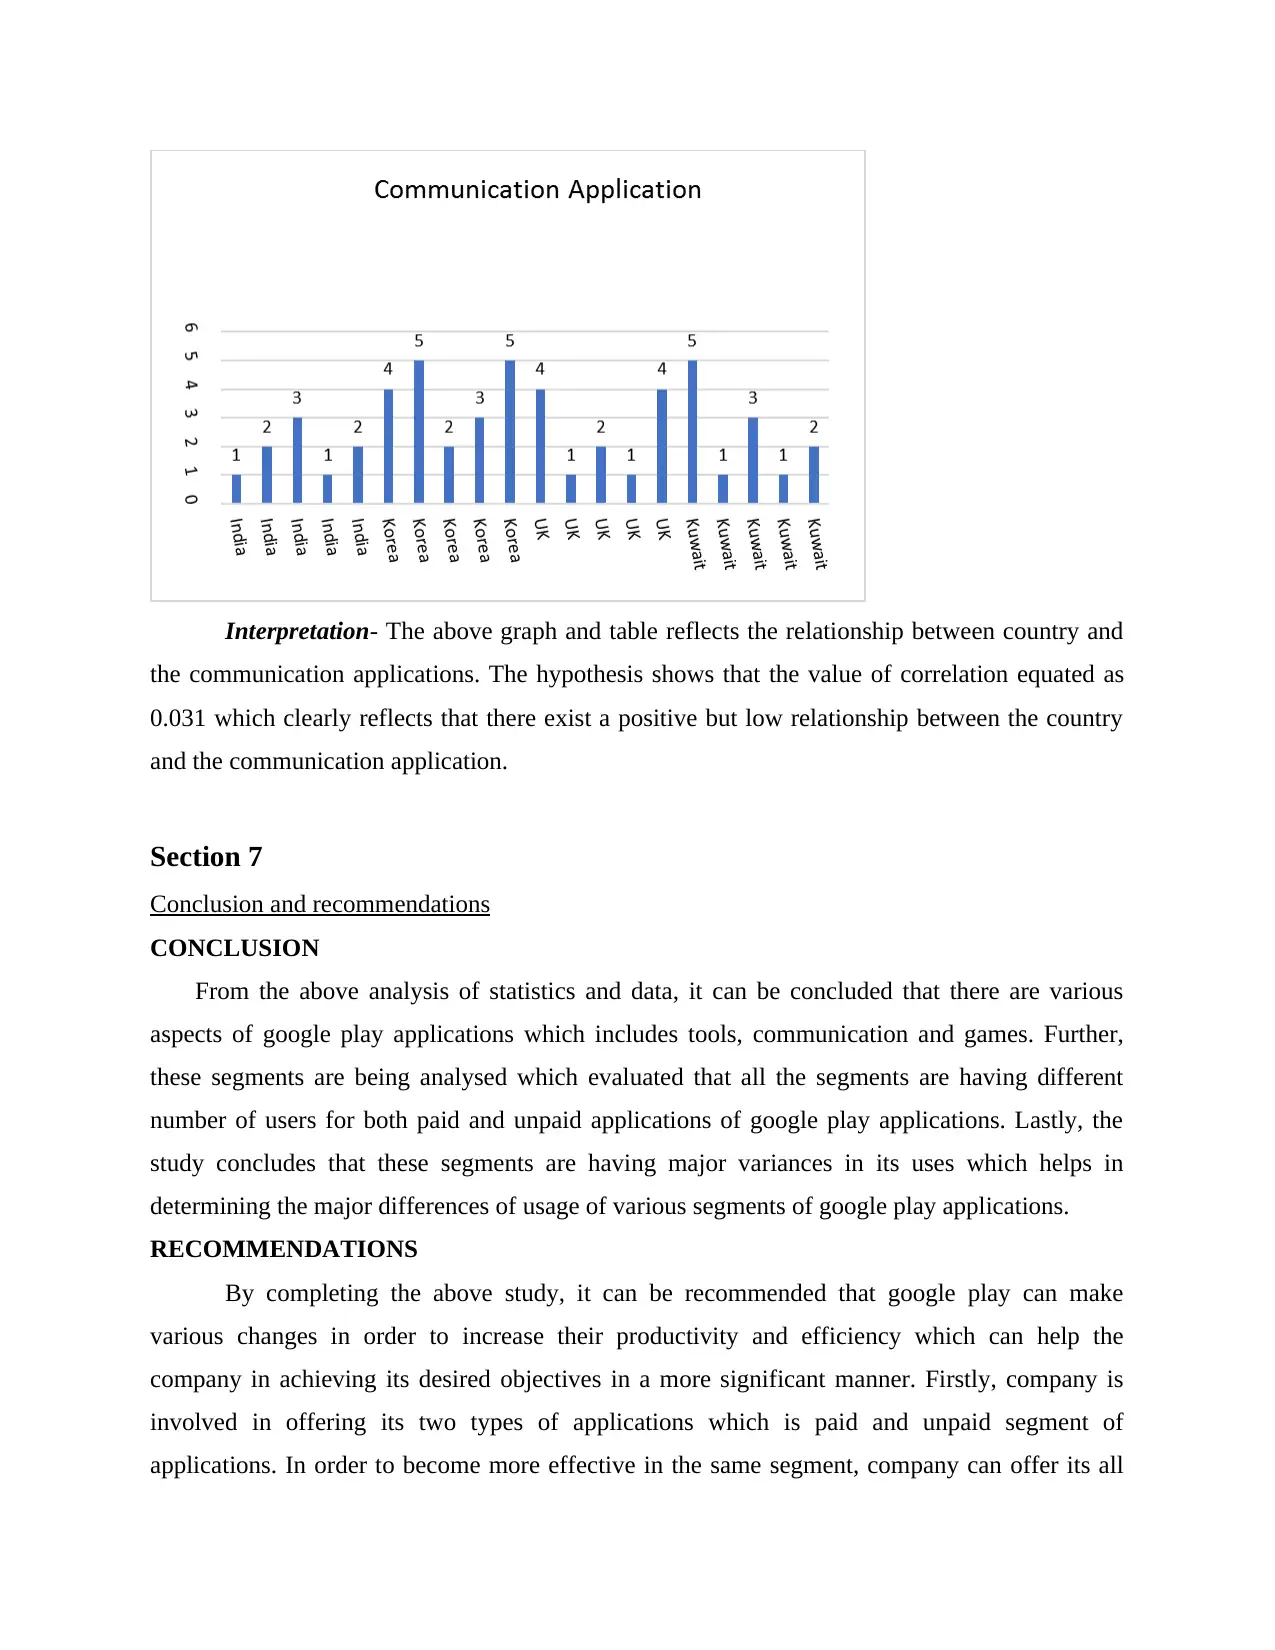
Interpretation- The above graph and table reflects the relationship between country and
the communication applications. The hypothesis shows that the value of correlation equated as
0.031 which clearly reflects that there exist a positive but low relationship between the country
and the communication application.
Section 7
Conclusion and recommendations
CONCLUSION
From the above analysis of statistics and data, it can be concluded that there are various
aspects of google play applications which includes tools, communication and games. Further,
these segments are being analysed which evaluated that all the segments are having different
number of users for both paid and unpaid applications of google play applications. Lastly, the
study concludes that these segments are having major variances in its uses which helps in
determining the major differences of usage of various segments of google play applications.
RECOMMENDATIONS
By completing the above study, it can be recommended that google play can make
various changes in order to increase their productivity and efficiency which can help the
company in achieving its desired objectives in a more significant manner. Firstly, company is
involved in offering its two types of applications which is paid and unpaid segment of
applications. In order to become more effective in the same segment, company can offer its all
Paraphrase This Document
Need a fresh take? Get an instant paraphrase of this document with our AI Paraphraser
range of applications as unpaid by accepting advertisements of all those companies who wishes
to advertise through applications. This can increase the profits of the organization through
offering a new segment of advertising. Further, in order to promote its communication segment
of paid application, which is being lacking behind, company can offer a free demo to its
customers which can help them in providing the value of applications to the customers by giving
a chance to them for using these applications. This can increase the significance of using paid
communication applications. From the present study, it can be also recommended that Google
play applications are performing well in the market, which is opportunity for the organization.
This opportunity can be grabbed by the company by introducing a new range of products in the
digital market. This can help the company in expanding and developing its strategies for the
purpose of expansion.
CONCLUSION
From the present study it can be concluded that in majority of cases, alternative hypothesis
is being used and accepted. Whereas null hypothesis is being rejected that means among the
variables where there is significance relationship. The variable relates to the Google play apps
where such apps are divided into several categories that involve communication, tools and game.
The analysis also provides an evaluation of correlation which depicted as positive but low among
the dependent and the independent variables as the use of communication application very little
depends upon the country.
REFERENCES
Books and journals
Frie, K. and et.al., 2017. Insights from Google Play Store user reviews for the development of
weight loss apps: Mixed-method analysis. JMIR mHealth and uHealth, 5(12). p.e203.
Martin, W., Sarro, F. and Harman, M., 2016, November. Causal impact analysis for app releases
in google play. In Proceedings of the 2016 24th ACM SIGSOFT International Symposium on
Foundations of Software Engineering (pp. 435-446). ACM.
Martin, W., 2016, May. Causal impact for app store analysis. In Proceedings of the 38th
International Conference on Software Engineering Companion (pp. 659-661). ACM.
Latif, R.M.A. and et.al., 2019, January. Data Scraping from Google Play Store and Visualization
of its Content for Analytics. In 2019 2nd International Conference on Computing, Mathematics
and Engineering Technologies (iCoMET) (pp. 1-8). IEEE.
1
⊘ This is a preview!⊘
Do you want full access?
Subscribe today to unlock all pages.
Trusted by 1+ million students worldwide
1 out of 12
Related Documents


Your All-in-One AI-Powered Toolkit for Academic Success.
+13062052269
info@desklib.com
Available 24*7 on WhatsApp / Email
![[object Object]](/_next/static/media/star-bottom.7253800d.svg)
Unlock your academic potential
Copyright © 2020–2026 A2Z Services. All Rights Reserved. Developed and managed by ZUCOL.