Comprehensive Analysis of Google Stock Performance and Market Trends

Verified

Added on  2022/12/19

|4
|412
|33
Report
AI Summary
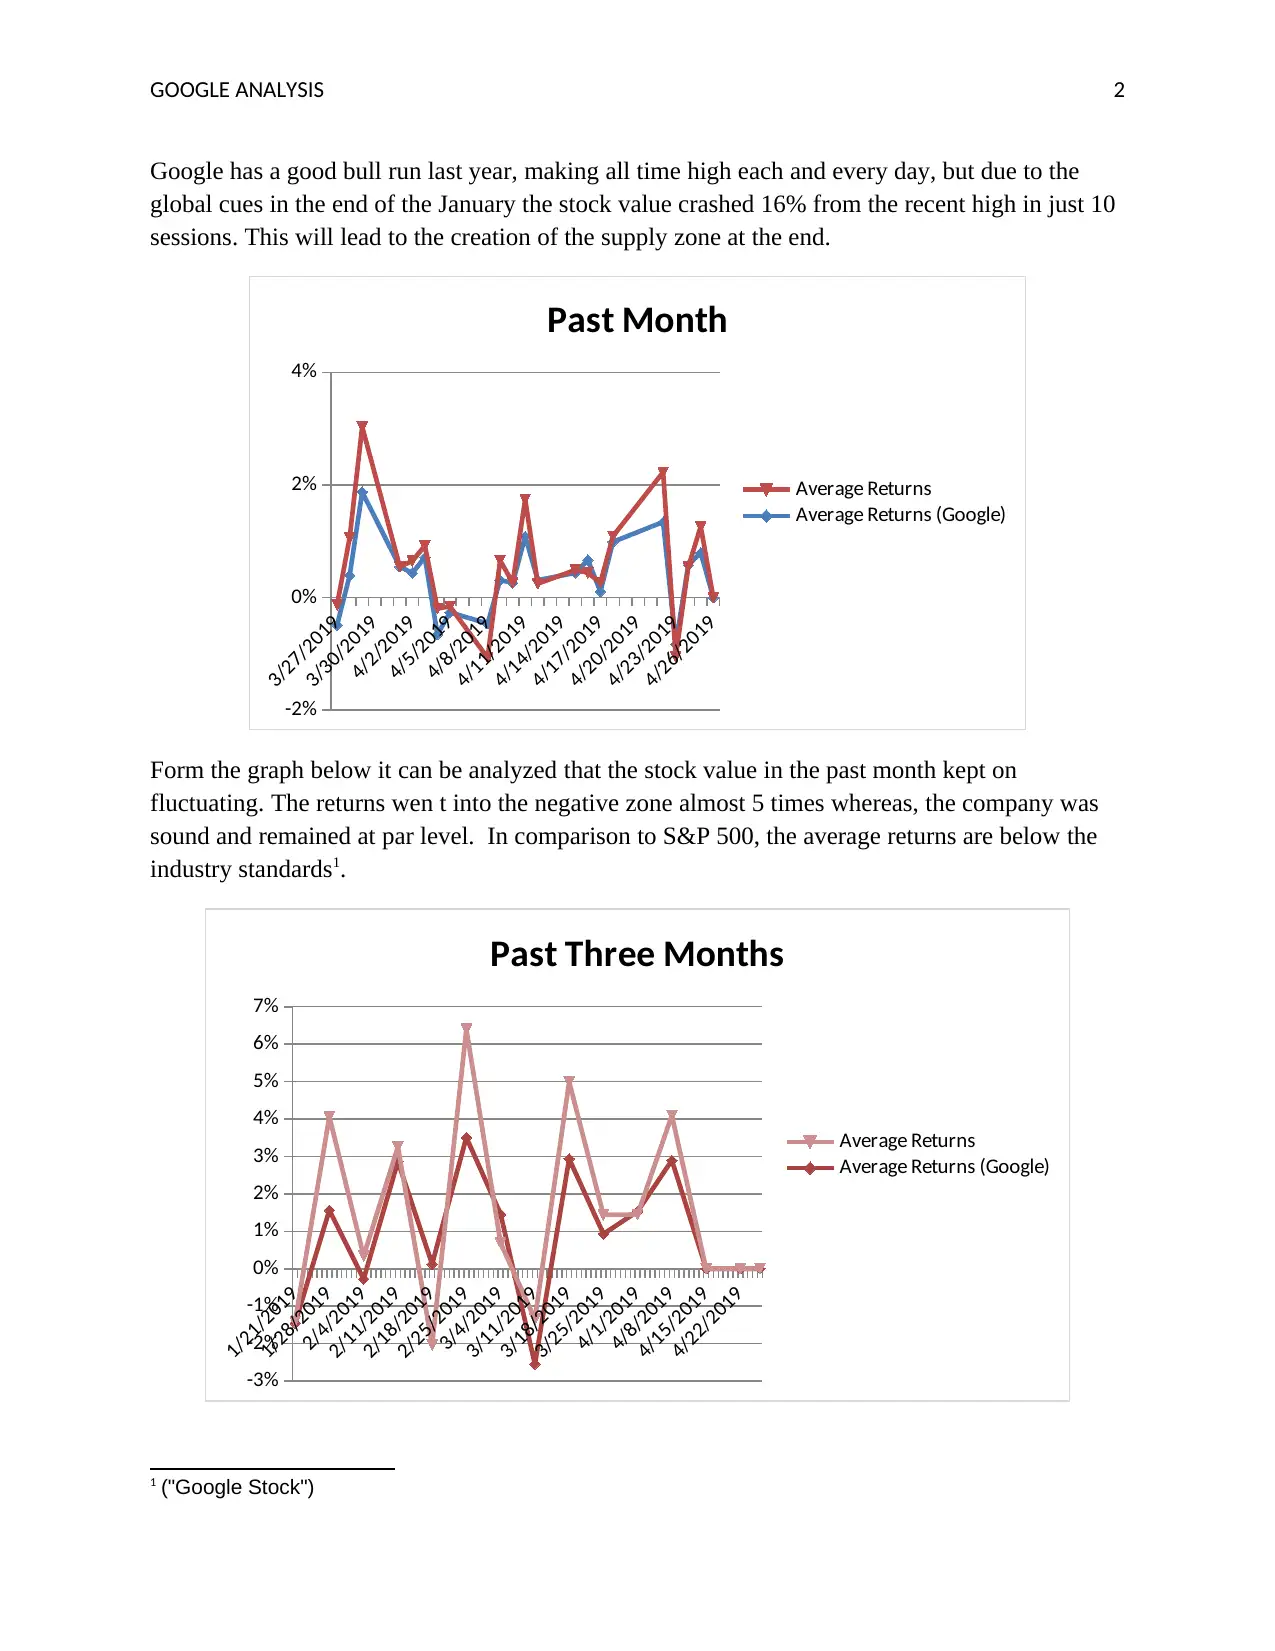
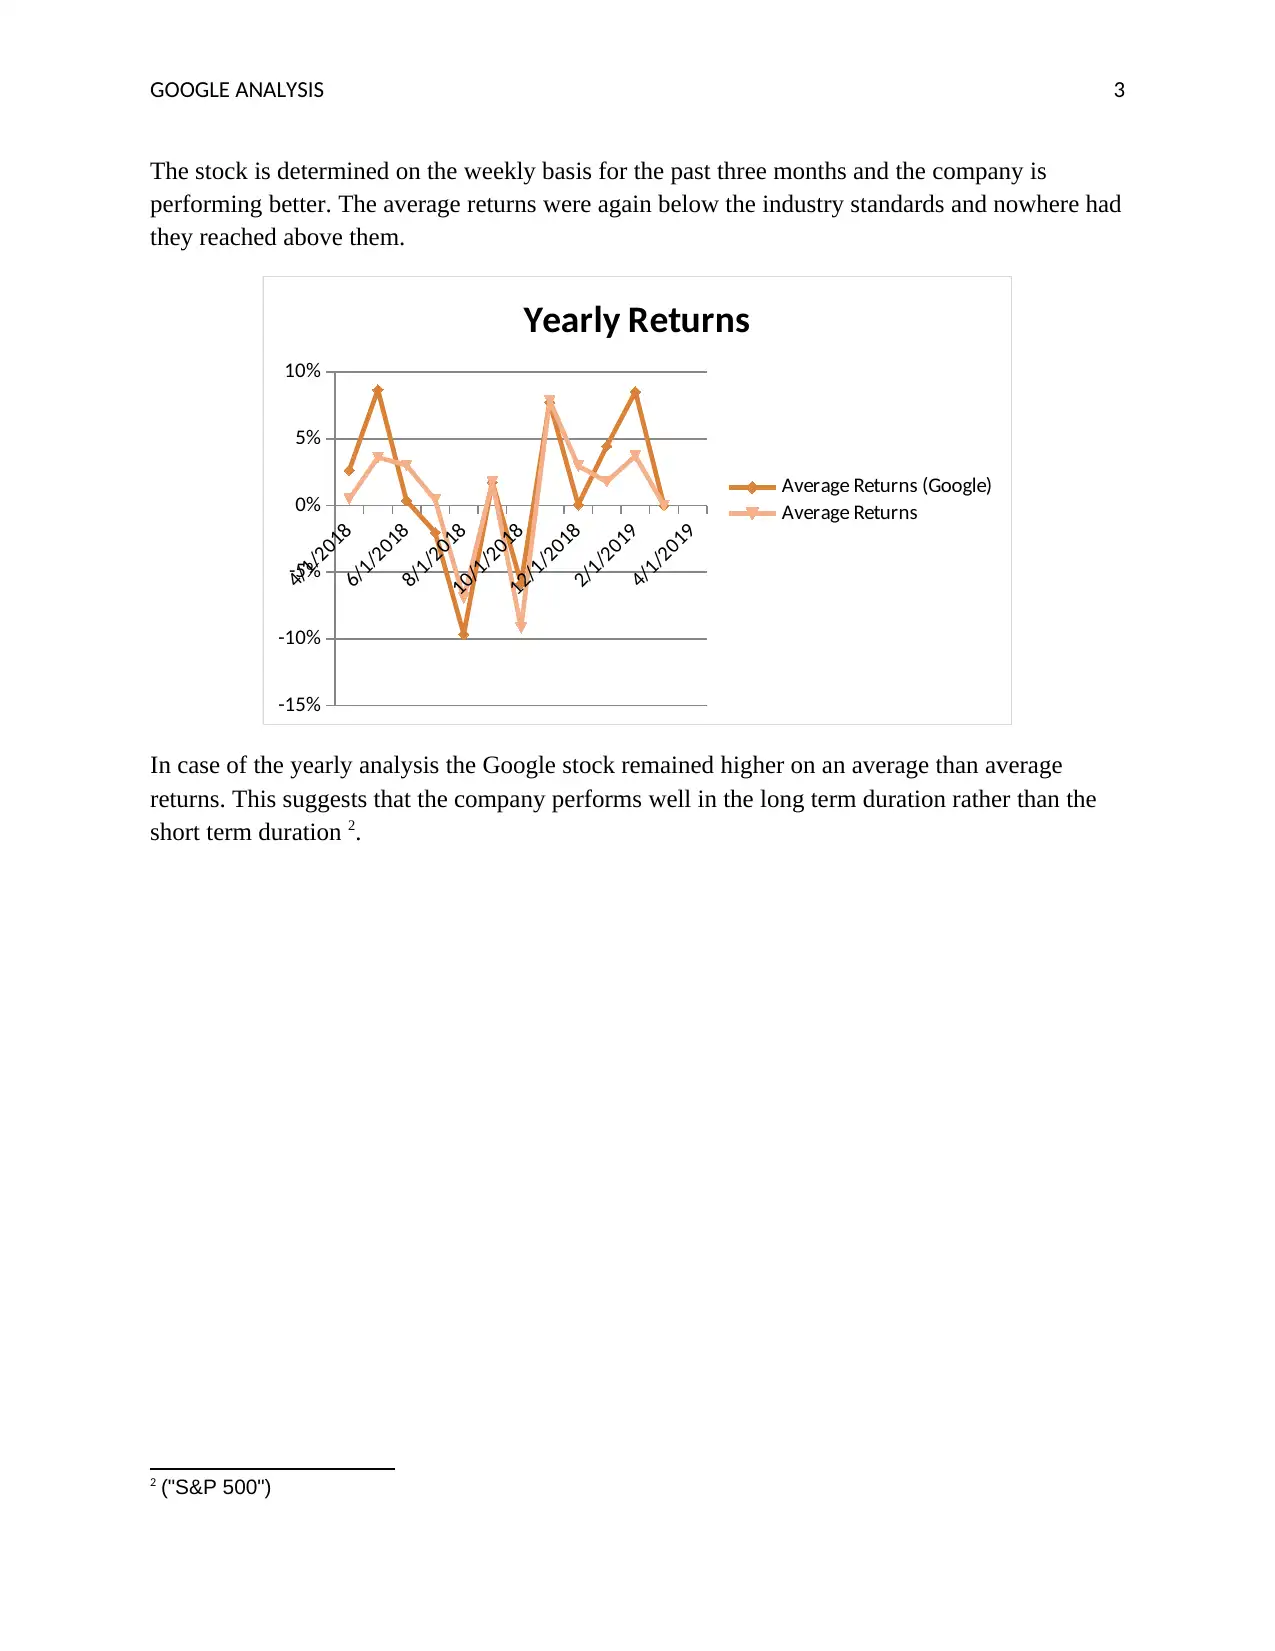
This report provides an analysis of Google's stock performance over different time periods. The analysis includes examination of the stock's fluctuations over the past month, highlighting instances where returns dipped into negative territory despite the company's overall stability. The report also assesses the stock's performance over the past three months, noting that the average returns were below industry standards. A yearly analysis reveals that Google's stock generally performed better than average returns, suggesting stronger performance in the long term. The report uses data from Yahoo Finance to support its findings, offering a comparative view of Google's stock against the S&P 500.
Document Page
Running head: GOOGLE ANALYSIS 1
GOOGLE ANALYSIS
tabler-icon-diamond-filled.svg

Paraphrase This Document

Need a fresh take? Get an instant paraphrase of this document with our AI Paraphraser
Document Page
GOOGLE ANALYSIS 2
Google has a good bull run last year, making all time high each and every day, but due to the
global cues in the end of the January the stock value crashed 16% from the recent high in just 10
sessions. This will lead to the creation of the supply zone at the end.
3/27/2019
3/30/2019
4/2/2019
4/5/2019
4/8/2019
4/11/2019
4/14/2019
4/17/2019
4/20/2019
4/23/2019
4/26/2019
-2%
0%
2%
4%
Past Month
Average Returns
Average Returns (Google)
Form the graph below it can be analyzed that the stock value in the past month kept on
fluctuating. The returns wen t into the negative zone almost 5 times whereas, the company was
sound and remained at par level. In comparison to S&P 500, the average returns are below the
industry standards1.
1/21/2019
1/28/2019
2/4/2019
2/11/2019
2/18/2019
2/25/2019
3/4/2019
3/11/2019
3/18/2019
3/25/2019
4/1/2019
4/8/2019
4/15/2019
4/22/2019
-3%
-2%
-1%
0%
1%
2%
3%
4%
5%
6%
7%
Past Three Months
Average Returns
Average Returns (Google)
1 ("Google Stock")
Document Page
GOOGLE ANALYSIS 3
The stock is determined on the weekly basis for the past three months and the company is
performing better. The average returns were again below the industry standards and nowhere had
they reached above them.
4/1/2018
6/1/2018
8/1/2018
10/1/2018
12/1/2018
2/1/2019
4/1/2019
-15%
-10%
-5%
0%
5%
10%
Yearly Returns
Average Returns (Google)
Average Returns
In case of the yearly analysis the Google stock remained higher on an average than average
returns. This suggests that the company performs well in the long term duration rather than the
short term duration 2.
2 ("S&P 500")
Document Page
GOOGLE ANALYSIS 4
References
"Google Stock". Finance.Yahoo.Com, 2019, https://finance.yahoo.com/quote/GOOG/.
"S&P 500". Finance.Yahoo.Com, 2019, https://finance.yahoo.com/quote/%5E.
chevron_up_icon
1 out of 4
circle_padding
hide_on_mobile
zoom_out_icon
[object Object]