Detailed Analysis of GoPro's Business Strategy: A Case Study

Verified

Added on  2021/02/20

|5
|667
|35
Case Study
AI Summary
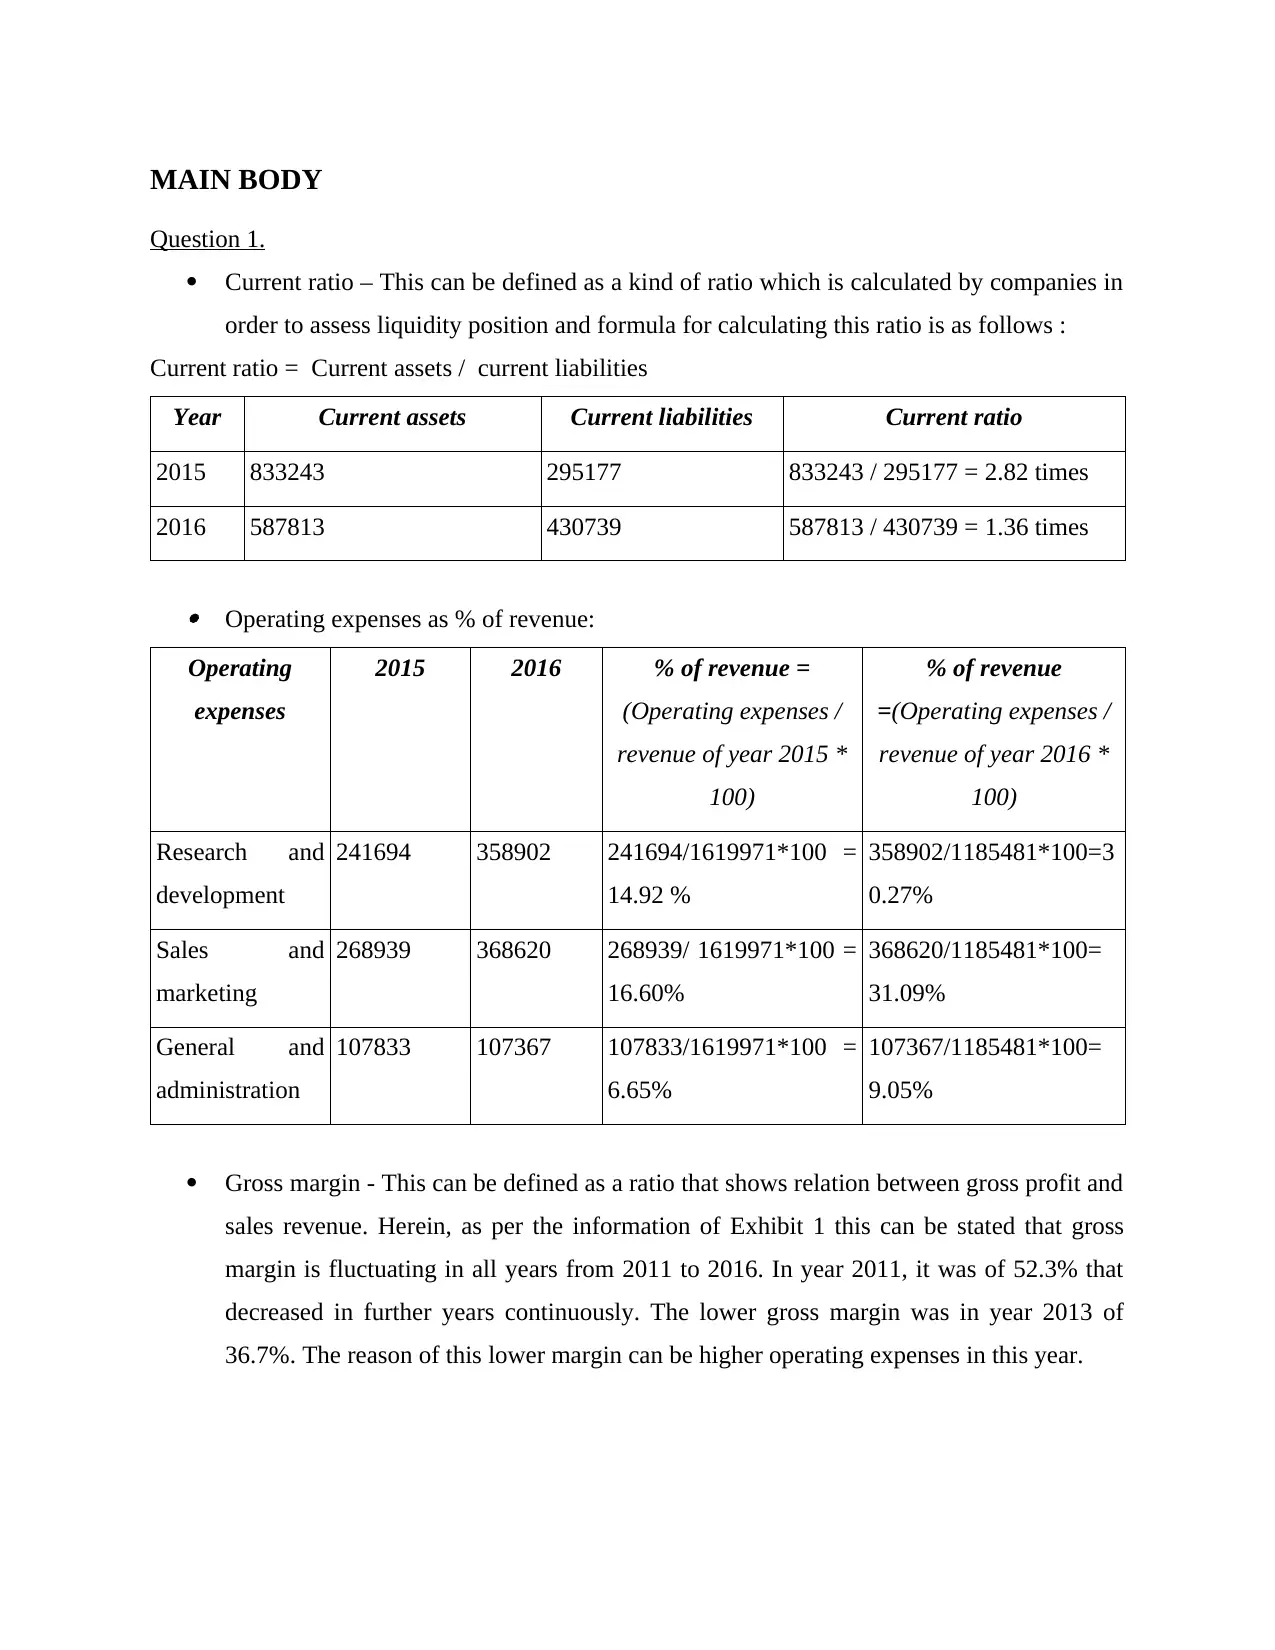
This case study analyzes GoPro's business performance, focusing on its financial ratios, operational expenses, and gross margin trends from 2011 to 2016. It examines the company's current ratio and the fluctuations in its operating expenses as a percentage of revenue. The analysis highlights the decreasing gross margin and the reasons behind the changes in financial trends, including balance sheet and income statement data. Furthermore, the case study applies the PESTLE model to assess the impact of environmental and technological factors on GoPro's business, particularly its product development and sales. Finally, it identifies the key resources of GoPro, such as software applications, competitive information, and funds, which were crucial for its strategic adaptations and comeback in 2017. This comprehensive analysis provides valuable insights into GoPro's business challenges and successes.
Document Page
CASE STUDY
tabler-icon-diamond-filled.svg

Secure Best Marks with AI Grader

Need help grading? Try our AI Grader for instant feedback on your assignments.
Document Page
Table of Contents
MAIN BODY...................................................................................................................................3
Question 1....................................................................................................................................3
Question 2....................................................................................................................................4
Question 3....................................................................................................................................4
Document Page
MAIN BODY
Question 1.
Current ratio – This can be defined as a kind of ratio which is calculated by companies in
order to assess liquidity position and formula for calculating this ratio is as follows :
Current ratio = Current assets / current liabilities
Year Current assets Current liabilities Current ratio
2015 833243 295177 833243 / 295177 = 2.82 times
2016 587813 430739 587813 / 430739 = 1.36 times
Operating expenses as % of revenue:
Operating
expenses
2015 2016 % of revenue =
(Operating expenses /
revenue of year 2015 *
100)
% of revenue
=(Operating expenses /
revenue of year 2016 *
100)
Research and
development
241694 358902 241694/1619971*100 =
14.92 %
358902/1185481*100=3
0.27%
Sales and
marketing
268939 368620 268939/ 1619971*100 =
16.60%
368620/1185481*100=
31.09%
General and
administration
107833 107367 107833/1619971*100 =
6.65%
107367/1185481*100=
9.05%
Gross margin - This can be defined as a ratio that shows relation between gross profit and
sales revenue. Herein, as per the information of Exhibit 1 this can be stated that gross
margin is fluctuating in all years from 2011 to 2016. In year 2011, it was of 52.3% that
decreased in further years continuously. The lower gross margin was in year 2013 of
36.7%. The reason of this lower margin can be higher operating expenses in this year.
Document Page
Analysis of trend- As per the analysis of gross margin of six years, this can be find out
that gross margin is reducing year by year. Hence, it can be stated that trend of gross
margin is going down significantly.
Reason of change in trend –
Balance sheet:
As per the balance sheet of year 2015-16, this can be stated that amount of total assets is
decreasing in year 2016 as compare to year 2015. The reason of this change can be decreasing in
assets turn overs.
Income statement:
The net profit in year 2014 was of $128088 that decreased in year 2015 and became of $36131.
While in year 2015, there was net loss of ($419003). The cause of difference is increasing in
total operational expenses.
Question 2.
PESTLE model:
Environmental factor- Under this factor, various kind of environmental aspects are
included such as region, culture, people like dislike, recent trends etc. In the context of
Go pro, this factor is linked because after year 2011 they did not make any change in
their products which was required by their customers and due to this their sales
decreased. As they made change as per need of external environment in year 2017, they
generated more revenues.
Technological factor- In the aspect of Go pro, this factor is important because during
2011-16 their profitability was decreasing. In year 2017, they enhanced their technology
and launched HERO5 camera that helped them in increasing total sales. As well as their
drone camera also supported in increasing the revenues.
Question 3.
Key resources of Go pro-
Software applications- This is one of the important resources for Go pro camera company
because due by help of it, they improved their techniques in less cost.
tabler-icon-diamond-filled.svg

Secure Best Marks with AI Grader

Need help grading? Try our AI Grader for instant feedback on your assignments.
Document Page
Competitive information- Due to this resource they modified their products effectively
and came back strongly in year 2017.
Fund- Another key resource for Go pro company is fund which helped them in adopting
higher class techniques.
chevron_up_icon
1 out of 5
circle_padding
hide_on_mobile
zoom_out_icon
logo.png

Your All-in-One AI-Powered Toolkit for Academic Success.

Available 24*7 on WhatsApp / Email

[object Object]