GoPro in 2017: Turnaround Strategy and Financial Performance Analysis

Verified

Added on  2023/06/04

|4
|508
|184
Case Study
AI Summary
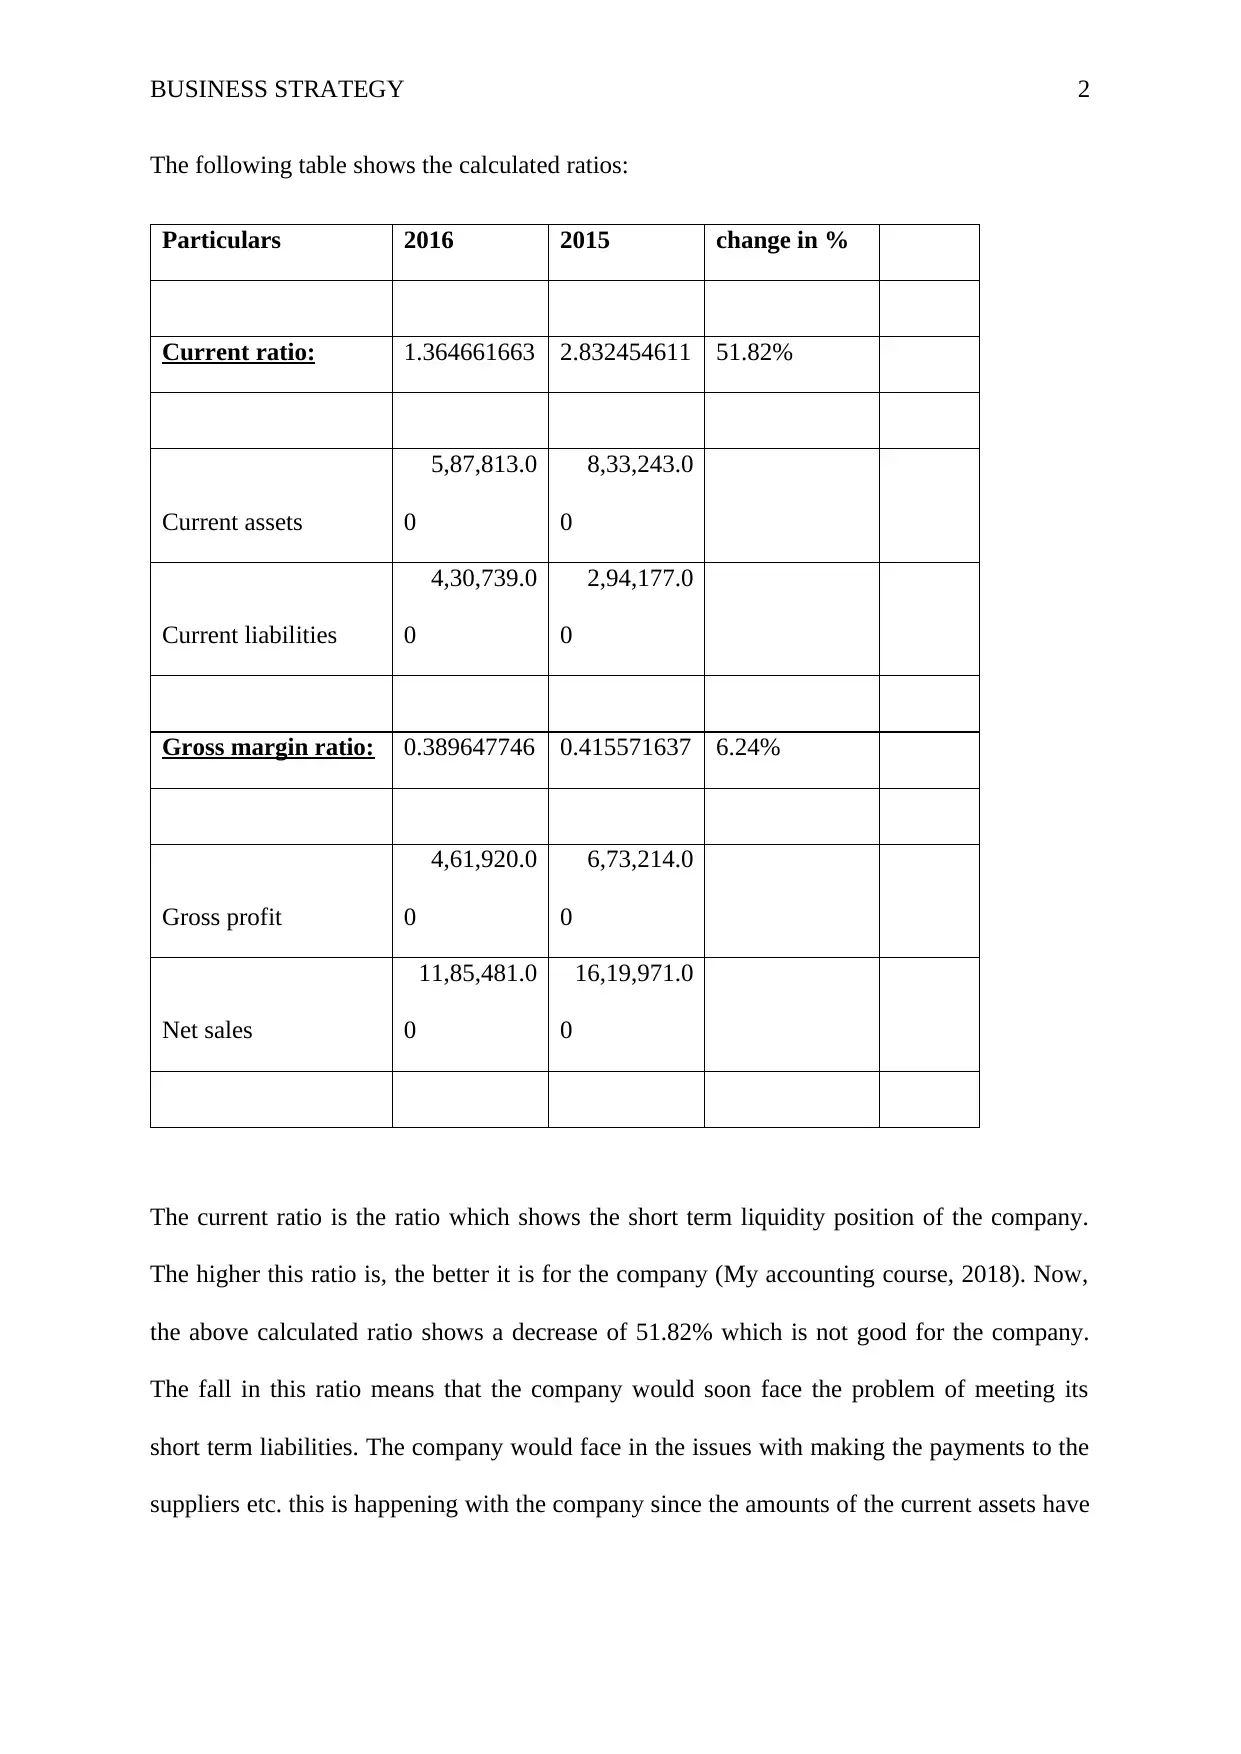
This case study analyzes GoPro's financial performance in 2015 and 2016, focusing on the company's turnaround strategy. The assignment involves calculating the current ratio and gross margin for both years, identifying the trends in these ratios, and explaining the reasons behind the observed changes. The analysis reveals a decline in both the current ratio and gross margin, indicating potential challenges in meeting short-term liabilities and a decrease in profitability. The decrease in current ratio is attributed to a reduction in current assets, particularly cash equivalents and marketable securities, potentially due to cash flow issues. The fall in gross margin is linked to a decrease in revenue. The study emphasizes the need for GoPro to improve revenue generation through strategies such as advertising and product quality improvements to restore profitability and improve its financial health. The analysis is supported by references to relevant accounting resources.
Document Page
BUSINESS STRATEGY 1
BUSINESS STRATEGY
tabler-icon-diamond-filled.svg

Paraphrase This Document

Need a fresh take? Get an instant paraphrase of this document with our AI Paraphraser
Document Page
BUSINESS STRATEGY 2
The following table shows the calculated ratios:
Particulars 2016 2015 change in %
Current ratio: 1.364661663 2.832454611 51.82%
Current assets
5,87,813.0
0
8,33,243.0
0
Current liabilities
4,30,739.0
0
2,94,177.0
0
Gross margin ratio: 0.389647746 0.415571637 6.24%
Gross profit
4,61,920.0
0
6,73,214.0
0
Net sales
11,85,481.0
0
16,19,971.0
0
The current ratio is the ratio which shows the short term liquidity position of the company.
The higher this ratio is, the better it is for the company (My accounting course, 2018). Now,
the above calculated ratio shows a decrease of 51.82% which is not good for the company.
The fall in this ratio means that the company would soon face the problem of meeting its
short term liabilities. The company would face in the issues with making the payments to the
suppliers etc. this is happening with the company since the amounts of the current assets have
Document Page
BUSINESS STRATEGY 3
reduced during the year 2016 when compared with the year 2015. This is mainly due to the
fall in the amount of cash equivalents and the marketable securities.
This could be due to the problem that the company could have been facing the cash crunch
due to which it went on to sale these marketable securities along with other cash equivalents.
This is because the marketable securities are held by the company for resale in future and the
cash equivalents are capable of being converted into cash without any delay. So, the company
has to look for the ways to increase the amounts of the cash.
The gross profit on the other hand shows the amount of the profits that the company earned
after the cost of goods sold have been deducted from the amount of the revenue that the
company has earned during the year (Accounting for management, 2018). The above table
shows a decrease again which is a bad sign for the company. The higher this ratio, the better
it is for the company since the company also has to meet the other expenses so that in turn,
the company is able to earn some profit. It should be able to generate some revenue from the
sale of goods and services.
The fall is mainly due to a major decrease in the amount of revenue that the company has
earned during the year 2016 when compared with year 2015. The company should look for
ways to increase the amount of revenue like advertising its products, improving the quality of
the products etc.
Document Page
BUSINESS STRATEGY 4
References:
Current Ratio | Formula | Example | Calculator | Analysis. (2018). Retrieved from
https://www.myaccountingcourse.com/financial-ratios/current-ratio
Gross profit (GP) ratio - explanation, formula, example and interpretation | Accounting for
Management. (2018). Retrieved from https://www.accountingformanagement.org/gross-
profit-ratio/
chevron_up_icon
1 out of 4
circle_padding
hide_on_mobile
zoom_out_icon
[object Object]