ECON 3: Federal, State, and Local Government Budget Comparison Report

Verified

Added on  2020/02/18

|12
|1840
|53
Report
AI Summary
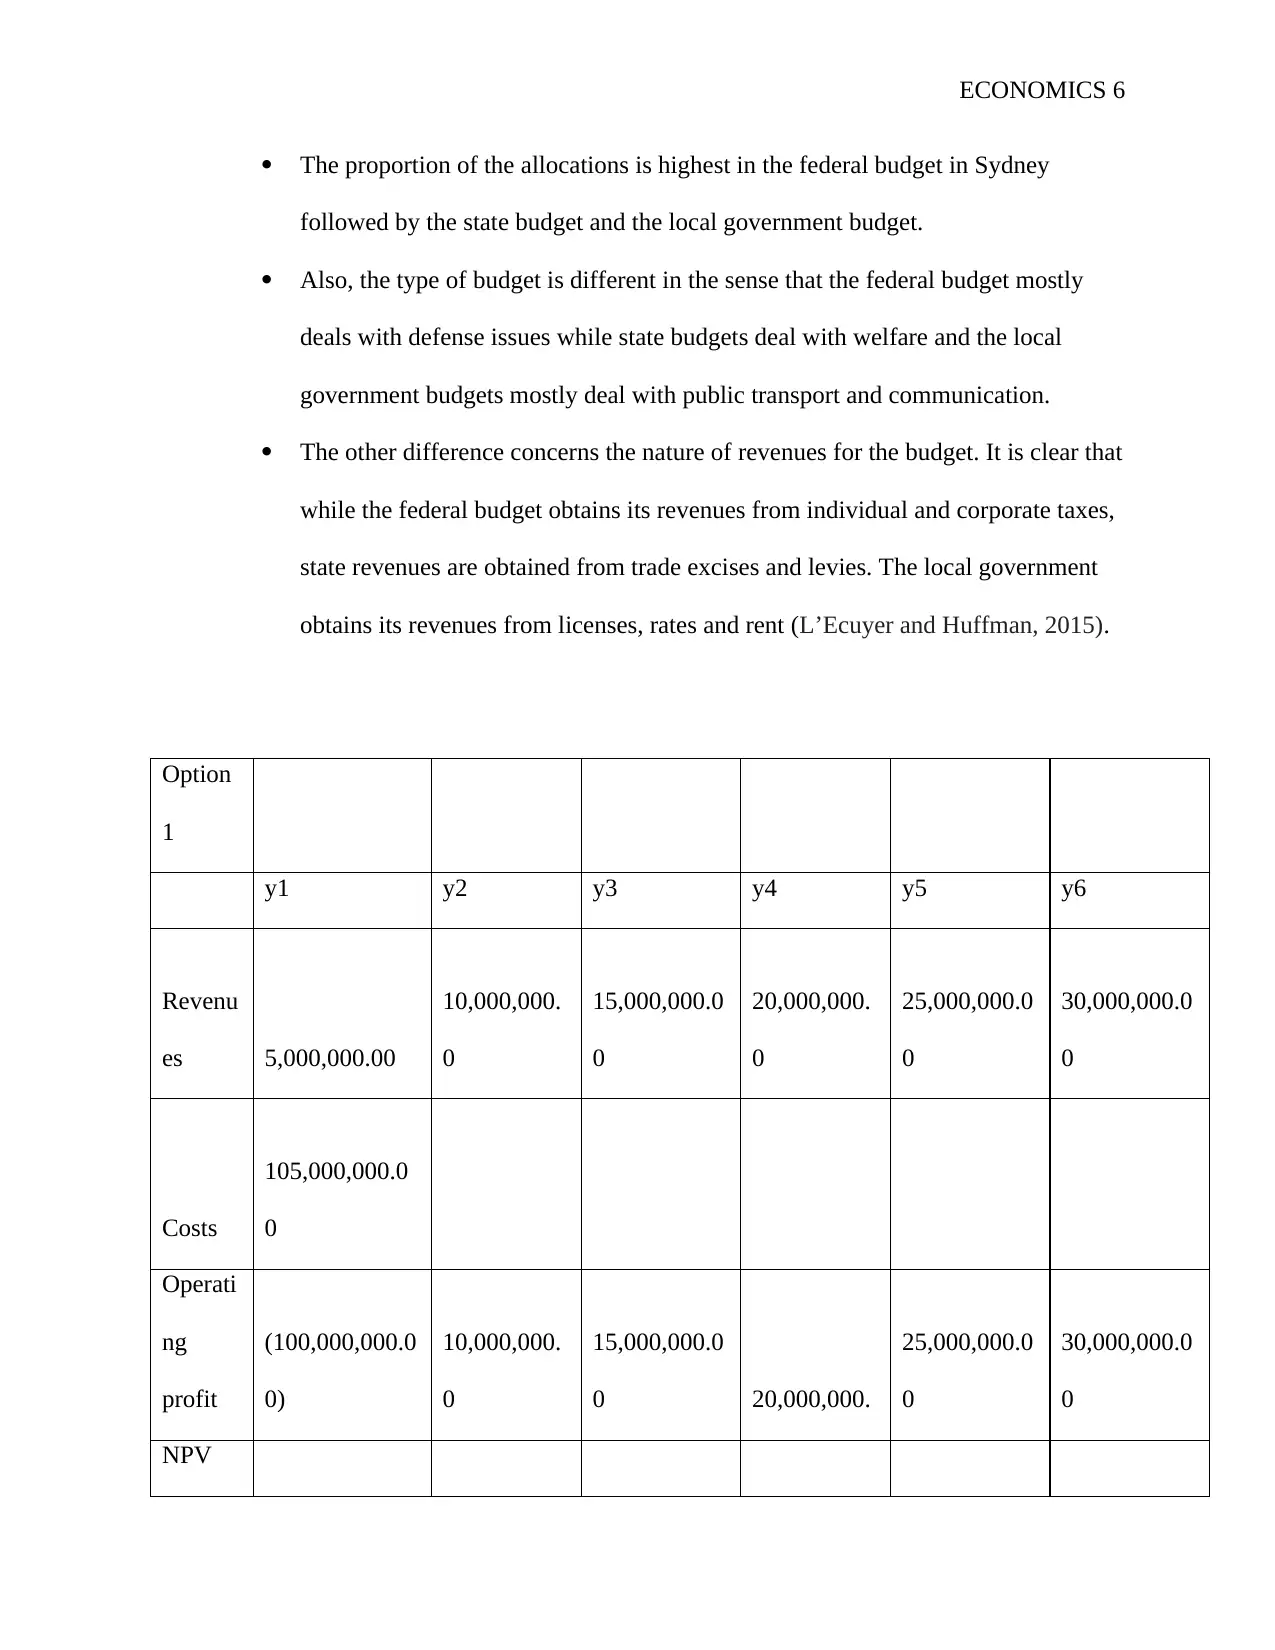
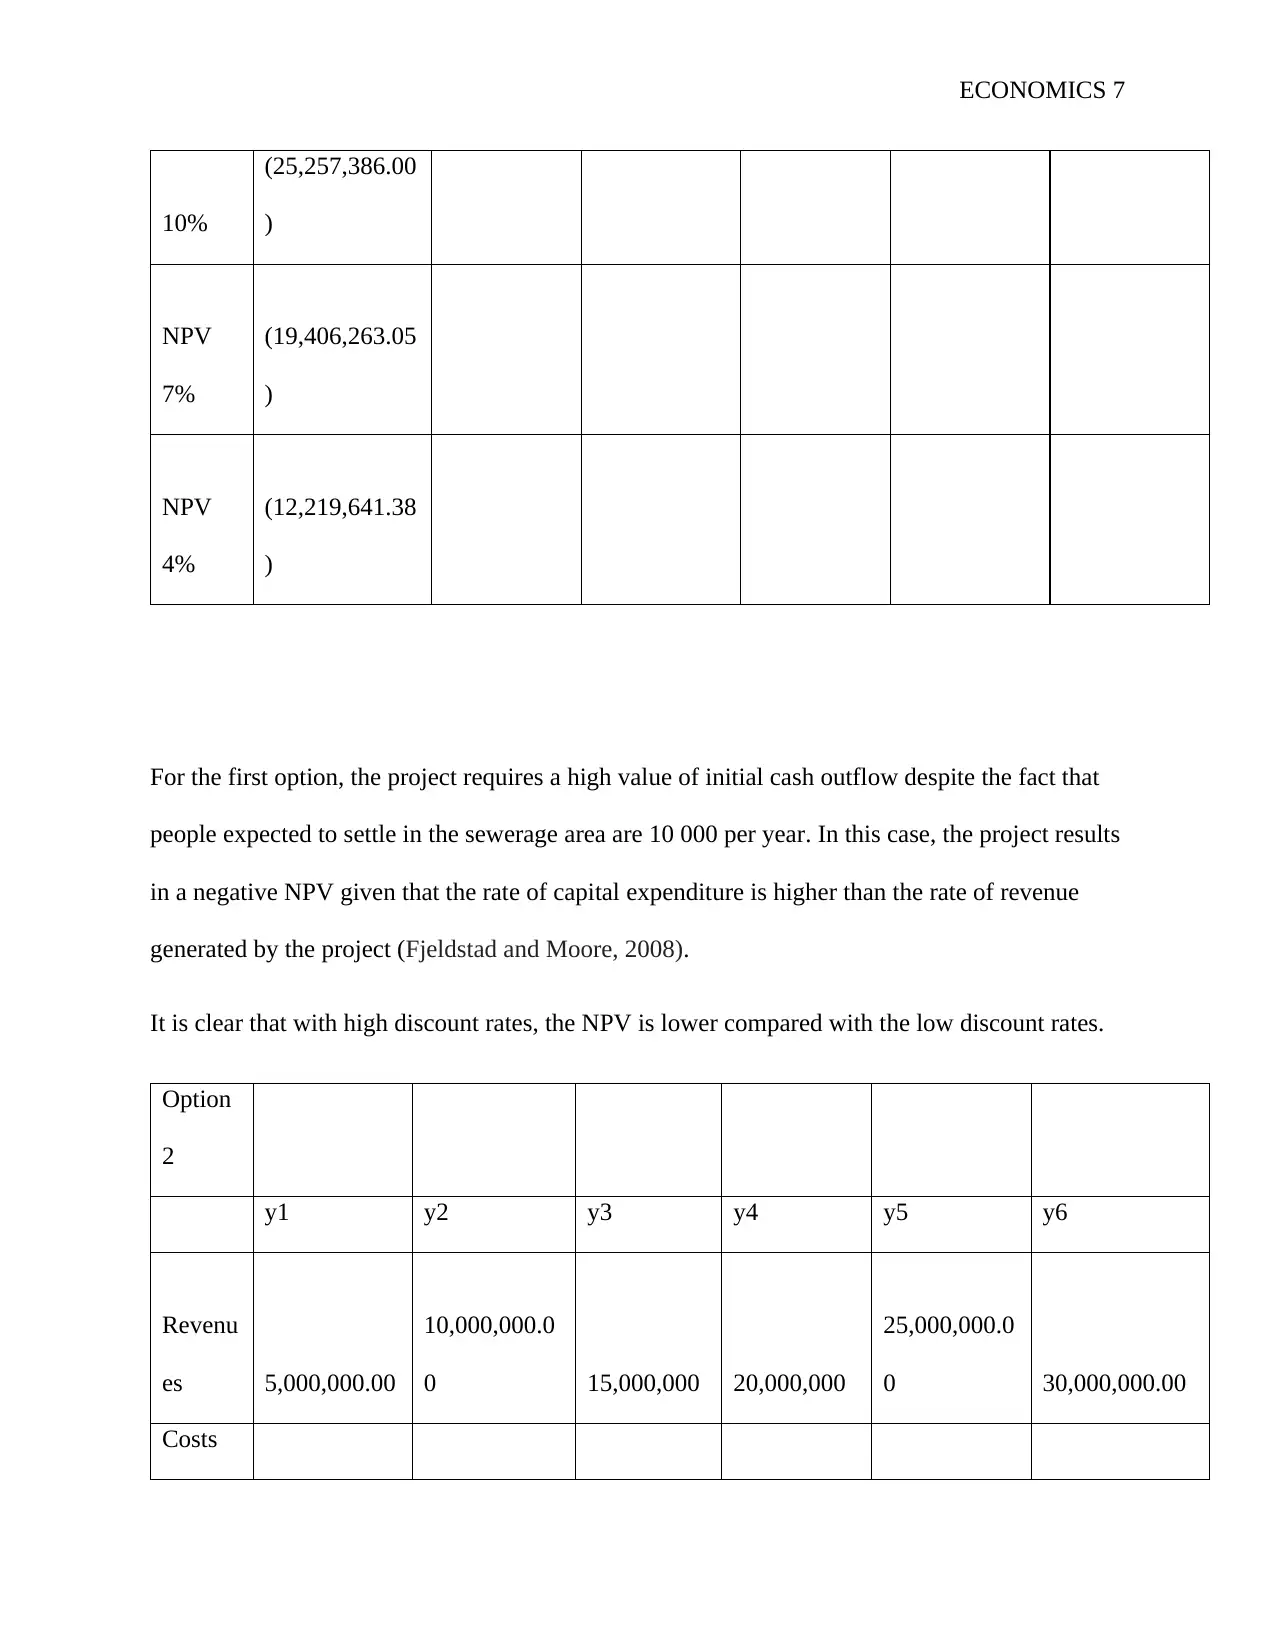
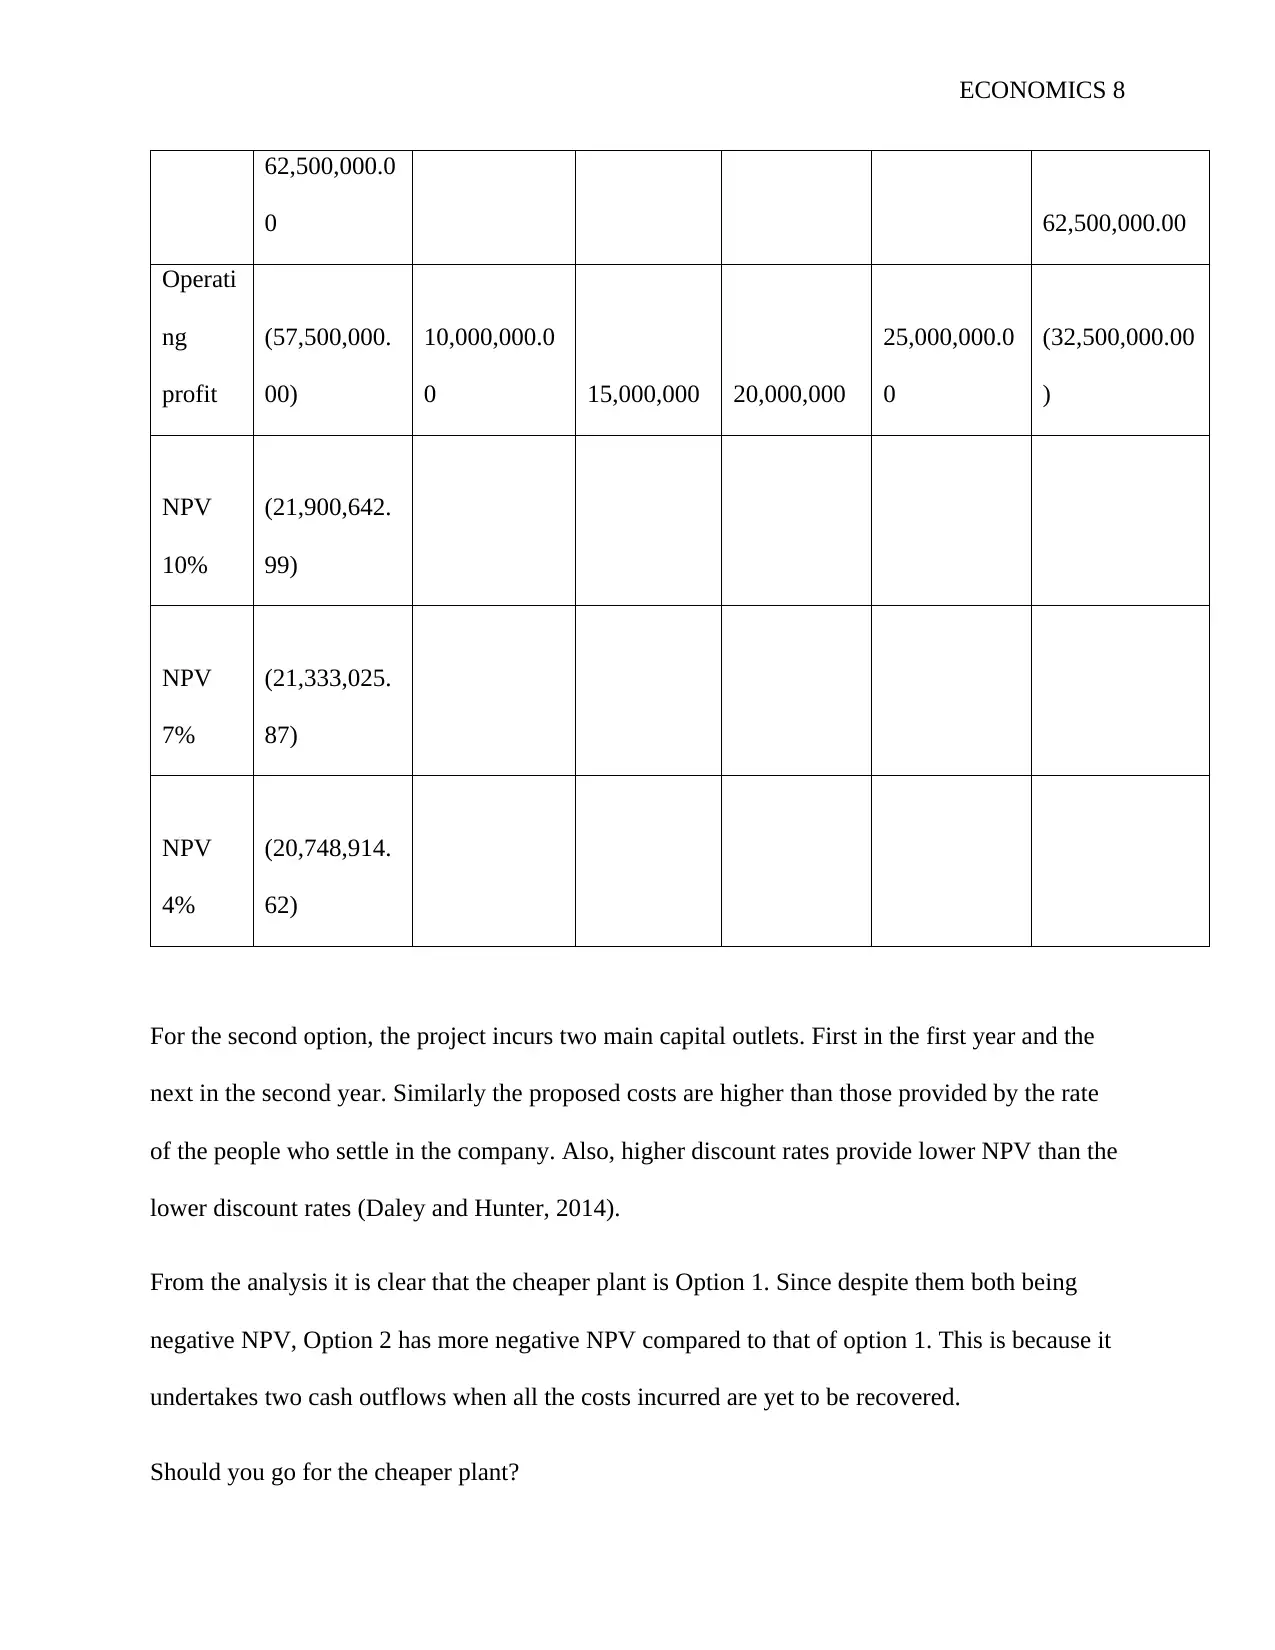
This report, prepared for an Economics 3 course, examines the budgetary differences between the federal, state, and local governments. It analyzes the allocation of funds, revenue sources (including taxes, levies, and licenses), and expenditure patterns of each level of government. The federal budget, primarily focused on defense and national programs, is contrasted with state budgets that emphasize social security, education, and health, and local government budgets which are focused on public transport and communication. The report highlights the varying proportions of allocations, revenue generation methods, and the implications of these differences. The analysis also includes a case study of two investment options, their pros and cons, and the decision-making process involved, considering factors like financial capacity and project feasibility. The report concludes by summarizing the key differences and providing references to support the analysis.
Document Page
ECONOMICS 1
Course
Name
Institution Affiliation
tabler-icon-diamond-filled.svg

Paraphrase This Document

Need a fresh take? Get an instant paraphrase of this document with our AI Paraphraser
Document Page
ECONOMICS 2
Federal Government Budget, State Government Budget and Local Government Budget
Differences
The federal budget in Sydney largely allocates funds for federal programs. These programs
include defense programs and at times it also includes funding for other programs which may be
operated at a state level such as public transport, hospitals and school education. It therefore has
more access to funding compared to the states. It is observable that the federal government
budget is higher than that of the state and local budget. Most of its allocations are to deal with
national defense facilities and other allocations to state agencies. Also, it may have a higher
allocation in order to deal with externa affairs as well as integration and pension (Wang, 2015).
Document Page
ECONOMICS 3
Looking at the revenues, it is clear that the federal government has more allocated funds by
nearly more than half compared to the combination of state allocations. The state allocations are
mostly retrieved from gambling taxes, vehicle tax, payroll taxes and property taxes. On the other
hand, the federal revenues are retrieved from the tax from individuals as well as corporate tax.
Document Page
ECONOMICS 4
The
headline expenses in the federal budget in Sydney in Sydney include the security and welfare
budget, education, defense, housing, transport and communications. Also, the budgetary
allocations are higher than those of the state budgets (Smith and Williams, 2013). The state
budgets largely deal with social security, housing, transport and communication, education and
health. Subject to a few special cases. Quite, area 90 of the Constitution gives the government
selective control over the lucrative income surges of traditions and extract obligations (imposes
on products, for example, liquor, tobacco and fuel). Until the Second World War, Australians
paid pay duty to both state and governments (Wanna and De Vries, 2015). However since 1942,
the government has been the sole authority of wage charge. The government has additionally
gathered organization assess for more than 100 years, and the GST since 2000. The states could
at present gather wage impose on the off chance that they needed to, yet pick not to for political
reasons. Segment 96 of the Constitution accommodates the national government to give a
tabler-icon-diamond-filled.svg

Paraphrase This Document

Need a fresh take? Get an instant paraphrase of this document with our AI Paraphraser
Document Page
ECONOMICS 5
noteworthy extent of its income to the states that the Parliament may allow money related help to
any State on such terms and conditions as the Parliament thinks fit. This circulation of income
takes two structures – general income help and installments for a particular reason. The
unfastened financing that states get from the central government is generally comprised of the
cash that the government gathers from the GST. The states can spend this cash as they see fit
(Rubin, 2013). Notwithstanding, the passing on of the GST income is not unqualified. It's
restrictive on the states surrendering the accumulation of a number various states charges. The
perplexing undertaking of cutting up the GST income between the states is left to the
Commonwealth Grants Commission. The yearly procedure dependably appears to leave a
minimum one state guaranteeing it ought to get a more prominent offer of the pie. The
government may likewise give subsidizing to the states to a particular reason. The states need to
agree to getting the subsidizing (which is not ordinarily an issue), but rather it means that the
government can't force programs on the states that they fervently restrict (Reddick and and
Puron-Cid, 2017).
100%
3%
97%
0%
63%
37%
commonwealth state local government
In general, the following differences are highlighted:
Document Page
ECONOMICS 6
The proportion of the allocations is highest in the federal budget in Sydney
followed by the state budget and the local government budget.
Also, the type of budget is different in the sense that the federal budget mostly
deals with defense issues while state budgets deal with welfare and the local
government budgets mostly deal with public transport and communication.
The other difference concerns the nature of revenues for the budget. It is clear that
while the federal budget obtains its revenues from individual and corporate taxes,
state revenues are obtained from trade excises and levies. The local government
obtains its revenues from licenses, rates and rent (L’Ecuyer and Huffman, 2015).
Option
1
y1 y2 y3 y4 y5 y6
Revenu
es 5,000,000.00
10,000,000.
0
15,000,000.0
0
20,000,000.
0
25,000,000.0
0
30,000,000.0
0
Costs
105,000,000.0
0
Operati
ng
profit
(100,000,000.0
0)
10,000,000.
0
15,000,000.0
0 20,000,000.
25,000,000.0
0
30,000,000.0
0
NPV
Document Page
ECONOMICS 7
10%
(25,257,386.00
)
NPV
7%
(19,406,263.05
)
NPV
4%
(12,219,641.38
)
For the first option, the project requires a high value of initial cash outflow despite the fact that
people expected to settle in the sewerage area are 10 000 per year. In this case, the project results
in a negative NPV given that the rate of capital expenditure is higher than the rate of revenue
generated by the project (Fjeldstad and Moore, 2008).
It is clear that with high discount rates, the NPV is lower compared with the low discount rates.
Option
2
y1 y2 y3 y4 y5 y6
Revenu
es 5,000,000.00
10,000,000.0
0 15,000,000 20,000,000
25,000,000.0
0 30,000,000.00
Costs
tabler-icon-diamond-filled.svg

Paraphrase This Document

Need a fresh take? Get an instant paraphrase of this document with our AI Paraphraser
Document Page
ECONOMICS 8
62,500,000.0
0 62,500,000.00
Operati
ng
profit
(57,500,000.
00)
10,000,000.0
0 15,000,000 20,000,000
25,000,000.0
0
(32,500,000.00
)
NPV
10%
(21,900,642.
99)
NPV
7%
(21,333,025.
87)
NPV
4%
(20,748,914.
62)
For the second option, the project incurs two main capital outlets. First in the first year and the
next in the second year. Similarly the proposed costs are higher than those provided by the rate
of the people who settle in the company. Also, higher discount rates provide lower NPV than the
lower discount rates (Daley and Hunter, 2014).
From the analysis it is clear that the cheaper plant is Option 1. Since despite them both being
negative NPV, Option 2 has more negative NPV compared to that of option 1. This is because it
undertakes two cash outflows when all the costs incurred are yet to be recovered.
Should you go for the cheaper plant?
Document Page
ECONOMICS 9
In this case, the cheaper plant is the larger plant. It depends on the financial capacity of
the firm. In case the firm has access to a large sum of funds in the beginning, they are able to
finance the project appropriately (Chubb, 2014). On the other hand, in case the firm has no
immediate finds the smaller project would be the best option. However, it would also be prudent
to deal with the project in a phase wise basis and therefore undertake the smaller project
(Andrews, 2014). This will enable the stakeholders involved to consider the impact of the project
and assess whether their projections for settlement are at par. In this way amendments can be
done along the way compared to have been undertaken a huge sum of money initially. The
cheaper plant may therefore not be a feasible option especially where the project only requires
testing for effective implementation (Bruno, 2015).
What are the pros and cons of each decision?
Option 1
Pros
The firm undertakes the initial cash outflow at once
The initial cash outflow is spread over the entire project in its duration
Cons
The initial cash outlay may be too expensive an undertaking
The project may not be feasible throughout the entire projected period
Option 2
Document Page
ECONOMICS 10
Pros
The firm’s cash outflow is incurred at different points of the project which allows for the
revenues recovered for the second part of the project.
The project can be stopped at any time
Cons
The company undertakes two cash outflows in the project
The project might underestimate the expected settlements in the project which limits the
revenues received.
How do you decide?
I decide on the basis of the feasibility of the project. This is because I believe that it being
a social project it should be able to generate sufficient revenue for the project to fund
itself. I therefore believe that option two is best suited to be selected since it gives the
management the option to opt out and select better alternatives if the method is not
feasible (Smith and Williams, 2013).
tabler-icon-diamond-filled.svg

Paraphrase This Document

Need a fresh take? Get an instant paraphrase of this document with our AI Paraphraser
Document Page
ECONOMICS 11
References
Andrews, M., 2014. Budget boost for Australian resources sector. Australia's Paydirt, 1(217),
p.10.
Bruno, R., 2015. Investments in Public Education, Investments in Public Infrastructure, and a
Balanced State Budget.
Chubb, I., 2014. Australia needs a strategy. Science, 345(6200), pp.985-985.
Daley, J., McGannon, C. and Hunter, A., 2014. Budget pressures on Australian governments
2014. Grattan Institute.
Fjeldstad, O.H. and Moore, M., 2008. Tax reform and state building in a globalized
world. Taxation and state-building in developing countries: Capacity and consent, pp.235-260.
L’Ecuyer, T.S., Beaudoing, H.K., Rodell, M., Olson, W., Lin, B., Kato, S., Clayson, C.A.,
Wood, E., Sheffield, J., Adler, R. and Huffman, G., 2015. The observed state of the energy
budget in the early twenty-first century. Journal of Climate, 28(21), pp.8319-8346.
Reddick, C.G., Chatfield, A.T. and Puron-Cid, G., 2017, June. Online Budget Transparency
Innovation in Government: A Case Study of the US State Governments. In Proceedings of the
18th Annual International Conference on Digital Government Research (pp. 232-241). ACM.
Document Page
ECONOMICS 12
Rubin, I., 2015. Past and future budget classics: A research agenda. Public Administration
Review, 75(1), pp.25-35.
Santamouris, M. ed., 2013. Energy and climate in the urban built environment. Routledge.
Smith, M., Whitelegg, J. and Williams, N.J., 2013. Greening the built environment. Routledge.
Wang, X.S., 2015. The Chinese economy in crisis: state capacity and tax reform. Routledge.
Wanna, J., Lindquist, E.A. and De Vries, J. eds., 2015. The Global Financial Crisis and Its
Budget Impacts in OECD Nations: Fiscal Responses and Future Challenges. Edward Elgar
Publishing.
chevron_up_icon
1 out of 12
circle_padding
hide_on_mobile
zoom_out_icon
[object Object]