MGT723 Research: Government Influence on CO2 Emissions in USA/UK Orgs
VerifiedAdded on 2023/06/04
|11
|3615
|462
Report
AI Summary
This research project, conducted as part of the MGT723 course, investigates the influence of government policies on the reduction of CO2 emissions by organizations in the United States and the United Kingdom. The study employs an independent samples t-test to compare CO2 emissions between the USA and UK, and paired samples t-tests to assess the impact of incorporating climate change strategies on emissions within each country. The results indicate no significant difference in CO2 emission rates between the USA and UK. However, the analysis reveals a significant reduction in CO2 emissions among companies that have integrated climate change strategies, compared to those that have not, in both nations. The study concludes that government influence positively impacts CO2 emission reduction by businesses in both the USA and UK, supporting the hypothesis that government intervention plays a crucial role in mitigating climate change. The research uses statistical analysis, including t-tests, to draw conclusions about the impact of government policies on carbon emissions and provides insights into the effectiveness of climate change strategies.

MGT723 Research Project
Semester 2 2018
Assessment Task 3: Data Analysis
Student Name: VISHAL SIKRI
Title: Government Impact and the reduction in CO2 emissions by organisations in USA &
United Kingdom.
Submission Date: 29/09/2018
Acknowledgement:
I certify that I have carefully reviewed the university’s academic misconduct policy. I
understand that the source of ideas must be referenced and that quotation marks and a
reference are required when directly quoting anyone else’s words.
Paraphrase This Document
Need a fresh take? Get an instant paraphrase of this document with our AI Paraphraser

Data Analysis – Inferential
Government influence on industries and reduction of carbon emissions in climate
In this section, the effect of government on industries in line with reduction of CO2 emissions
will be tested. It is normal for many governments to be majority shareholders of companies
offering national services (Dahan et al., 2015). For that reason, most of the governments
influence the regulations set on the operations of organizations (Yu & Choi, 2016). In such
cases therefore, the government has influence on strategies such as inclusion of climate
change governance measures. This study seeks to check whether government influence has
an impact on reduction of carbon dioxide emissions into the atmosphere, among
organizations in the United Kingdom and the United States of America. This will be through
comparing carbon emissions between USA and UK. In addition a comparison of the inclusion
of climate change strategies and reduction of carbon dioxide will be done. That is, the study
will check whether those companies which have included climate change into their business
strategies have significantly different rates of carbon dioxide emission compared to those
which have not included the strategies, in the UK and USA.
First, an independent samples t-test will be used to check whether there is a difference in
CO2 emissions between the USA and UK. An independent samples t-test relates the averages
of two independent sets, to check if there is a statistically significant difference between them
(Kim, 2015). In this case, means in CO2 emissions between the UK and USA are
independent and an independent samples t-test will be used to confirm if the means are
statistically different (Kumar, 2014).
A paired samples t-test will be used to check whether there is a difference in CO2 emissions
between companies which have included climate change in their business strategies and those
which have not, in the USA and UK (Mackey & Gass, 2015). This will in turn assist in
checking whether the government’s influence on business strategies has an impact in
reducing CO2 emissions in the two mentioned nations. A paired samples t-test checks
whether the averages of two independent sets of data are equal (Allum, 2015). Data on
companies that have incorporated climate change into their strategies and those that have not
incorporated it, in both the UK and USA, is paired. The paired samples t-test will therefore be
used to check whether there is a difference in CO2 emissions between the companies.
2 | P a g e
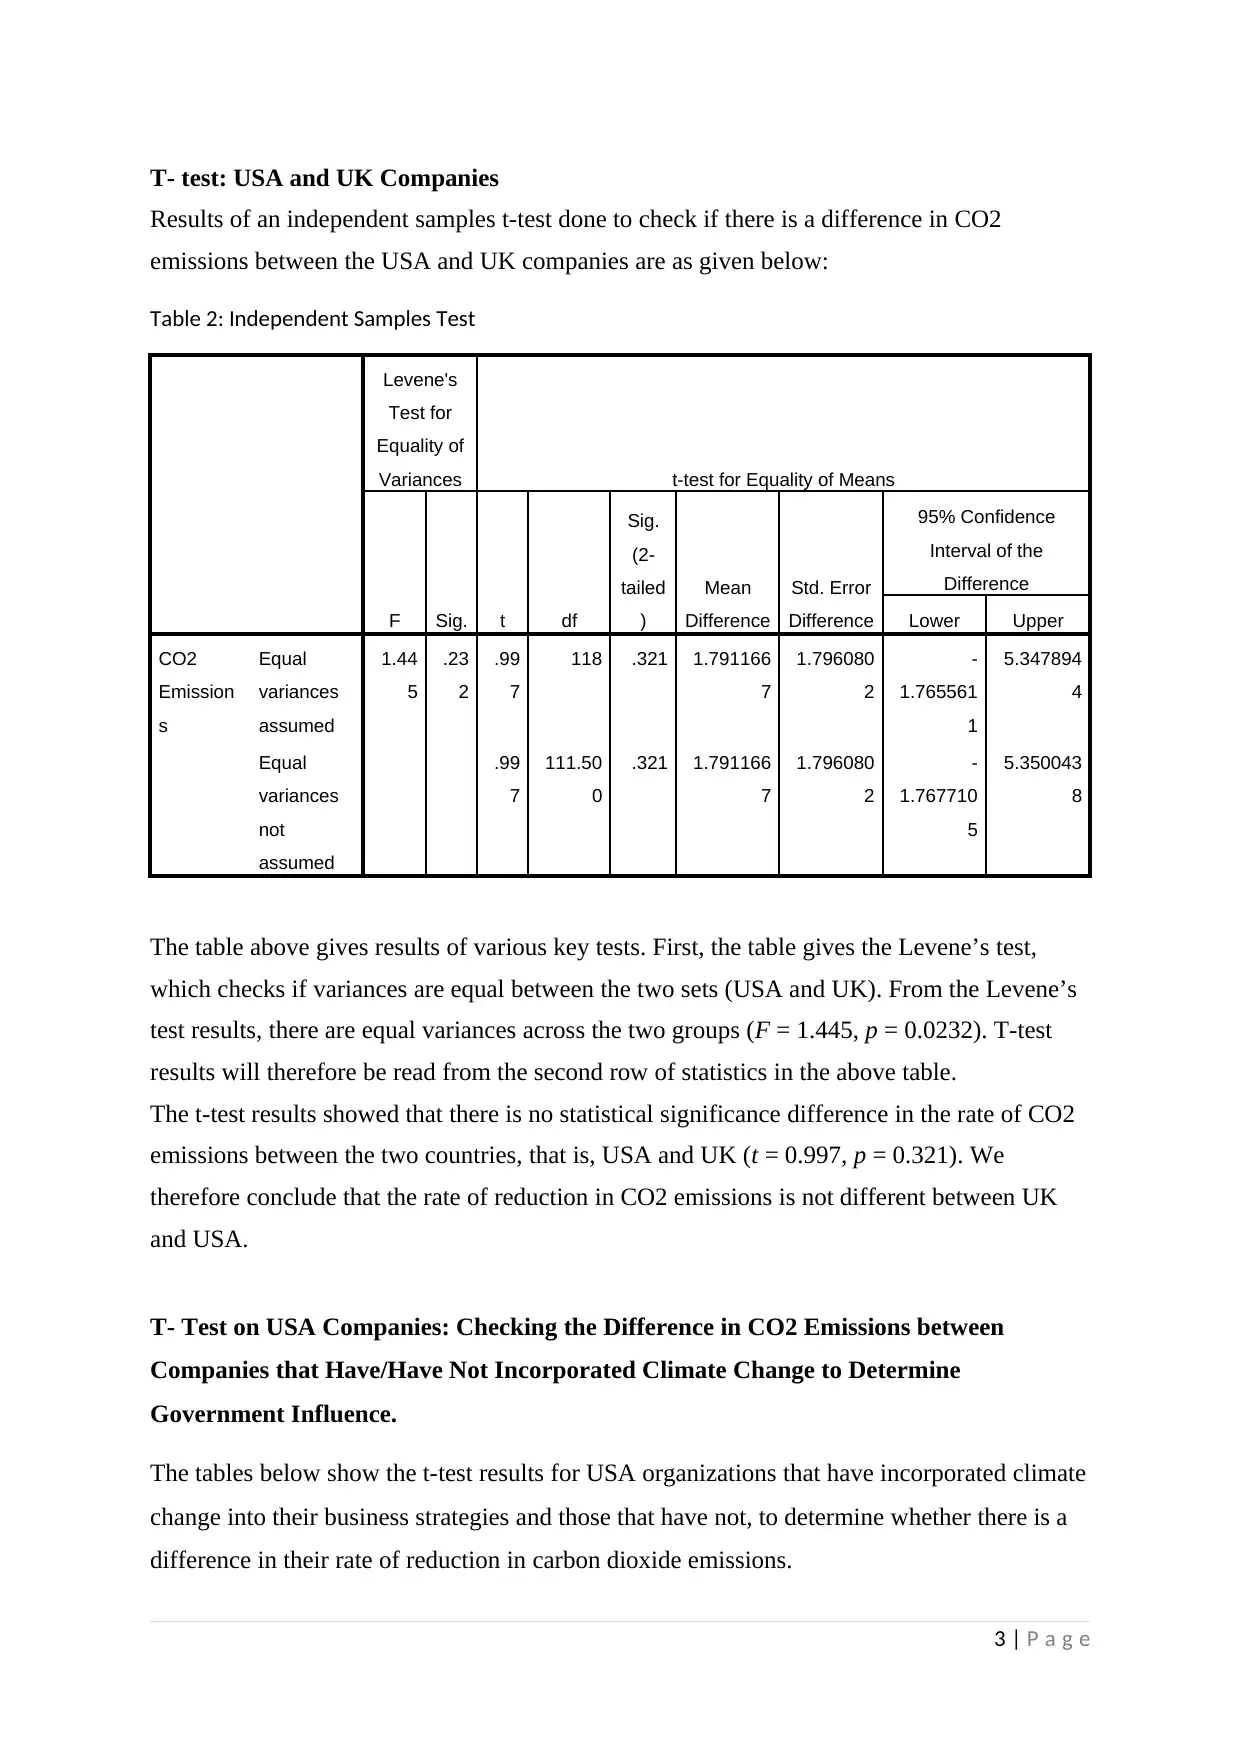
T- test: USA and UK Companies
Results of an independent samples t-test done to check if there is a difference in CO2
emissions between the USA and UK companies are as given below:
Table 2: Independent Samples Test
Levene's
Test for
Equality of
Variances t-test for Equality of Means
F Sig. t df
Sig.
(2-
tailed
)
Mean
Difference
Std. Error
Difference
95% Confidence
Interval of the
Difference
Lower Upper
CO2
Emission
s
Equal
variances
assumed
1.44
5
.23
2
.99
7
118 .321 1.791166
7
1.796080
2
-
1.765561
1
5.347894
4
Equal
variances
not
assumed
.99
7
111.50
0
.321 1.791166
7
1.796080
2
-
1.767710
5
5.350043
8
The table above gives results of various key tests. First, the table gives the Levene’s test,
which checks if variances are equal between the two sets (USA and UK). From the Levene’s
test results, there are equal variances across the two groups (F = 1.445, p = 0.0232). T-test
results will therefore be read from the second row of statistics in the above table.
The t-test results showed that there is no statistical significance difference in the rate of CO2
emissions between the two countries, that is, USA and UK (t = 0.997, p = 0.321). We
therefore conclude that the rate of reduction in CO2 emissions is not different between UK
and USA.
T- Test on USA Companies: Checking the Difference in CO2 Emissions between
Companies that Have/Have Not Incorporated Climate Change to Determine
Government Influence.
The tables below show the t-test results for USA organizations that have incorporated climate
change into their business strategies and those that have not, to determine whether there is a
difference in their rate of reduction in carbon dioxide emissions.
3 | P a g e
⊘ This is a preview!⊘
Do you want full access?
Subscribe today to unlock all pages.
Trusted by 1+ million students worldwide

Table 3: Paired Samples Statistics for USA Companies
Mean N Std. Deviation Std. Error Mean
Pair 1 CO2Emissions -8.477167 60 8.5679513 1.1061178
Integrating Climate Change
in Business Strategy
1.22 60 .415 .054
The table above shows summary statistics for the two main study variables on USA
companies. From the results, the companies have an average of -8.477 in the rate of CO2
reductions. This shows that the emission of CO2 reduced by -8.477 from the previous year.
Secondly the mean had a standard deviation of 8.567, which shows the amount of variation,
in the rate of CO2 emissions from each individual company, from the mean rate. On
integration of climate change in business strategies, the USA companies had a mean of 1.22.
This means that majority of the companies had incorporated climate change strategies into
their business operations. The standard deviation was 0.415, which shows the amount of
variation from the mean level of incorporating climate change into business strategies.
Table 4: Paired Samples Test for USA Companies
Paired Differences
t
d
f
Sig.
(2-
taile
d)Mean
Std.
Deviatio
n
Std.
Error
Mean
95% Confidence
Interval of the
Difference
Lower Upper
Pa
ir
1
CO2Emissions – Integrating Climate
Change in Business Strategy
-
9.69383
33
8.51781
25
1.09964
49
-
11.8942
176
-
7.49344
91
-
8.8
15
5
9
.000
The table above shows results of the paired samples t- test for USA companies. From the
results, it is evident that there was a significant difference in the amount of CO2 emissions
between companies that have integrated climate change in business strategy and those that
have not incorporated climate change strategies in the United States of America, t = 8.815, p
< 0.0001. The obtained p- value is less than the level of significance, that is, 0.05. Therefore,
the 50 companies that integrated climate change had a higher rate in reduction of CO2
emissions compared to the 10 that did not integrate climate change.
4 | P a g e
Paraphrase This Document
Need a fresh take? Get an instant paraphrase of this document with our AI Paraphraser

T- Test on UK Companies: Checking the Difference in CO2 Emissions between
Companies that Have/Have Not Incorporated Climate Change to Determine
Government Influence.
The tables below show the t-test results for UK organizations that have incorporated climate
change into their business strategies and those that have not, to determine whether there is a
difference in their rate of reduction in carbon dioxide emissions.
Table 5: Paired Samples Statistics for UK Companies
Mean N Std. Deviation Std. Error Mean
Pair 1 CO2Emissions -10.268333 60 10.9610426 1.4150645
Integrating Climate Change
in Business Strategy
1.03 60 .181 .023
The table above shows summary statistics for the two main study variables on UK
companies. From the results, the companies have an average of -10.268 in the rate of CO2
reductions. This shows that the emission of CO2 reduced by -10.268 from the previous year.
Secondly the mean had a standard deviation of 10.961, which shows the amount of variation,
in the rate of CO2 emissions from each individual company, from the mean rate. On
integration of climate change in business strategies, the United Kingdom companies had a
mean of 1.03. This means that majority of the companies had incorporated climate change
strategies into their business operations. The standard deviation was 0.181, which shows the
amount of variation from the mean level of incorporating climate change into business
strategies.
Table 6: Paired Samples Test for UK Companies
Paired Differences
t
d
f
Sig.
(2-
taile
d)Mean
Std.
Deviatio
n
Std.
Error
Mean
95% Confidence
Interval of the
Difference
Lower Upper
P
air
1
CO2Emissions – Integrating Climate
Change in Business Strategy
-
11.3016
667
10.9600
684
1.4149
387
-
14.1329
526
-
8.4703
808
-
7.9
87
5
9
.000
5 | P a g e

The table above shows results of the paired samples t- test for UK companies. From the
results, it is evident that there was a significant difference in the amount of CO2 emissions
between companies that have integrated climate change in business strategy and those that
have not incorporated climate change strategies in the United Kingdom, t = 7.987, p <
0.0001. The obtained p- value is less than the selected level of significance, that is, 0.05.
Therefore, the 58 companies that integrated climate change had a higher rate in reduction of
CO2 emissions compared to the 2 that did not integrate climate change.
Hypothesis Testing
In this section, the study hypotheses were checked in line with the obtained data analysis
results. The hypotheses are as given below:
H0: There is no positive relationship between government influence on industries and
reduction of carbon emissions in climate.
H1: There is a positive relationship between government influence on industries and
reduction of carbon emissions in climate.
The t-test results first revealed that there was no significant difference in carbon dioxide
emissions between the USA and UK companies. This therefore means that the reduction in
CO2 emissions was approximately similar in both countries.
Moreover, the t-test results revealed significant differences in the amount of CO2 emissions
between companies that have integrated climate change in business strategy and those that
have not incorporated climate change strategies in both the UK and USA.
From the results obtained in the section above, there is enough evidence to reject the null
hypothesis in favour of the alternative hypothesis that states: There is a positive relationship
between government influence on industries and reduction of carbon emissions in climate.
From these deliberations, the conclusion is that government influence on businesses
significantly reduces the rate of CO2 emissions by companies in the United States of America
and the United Kingdom.
6 | P a g e
⊘ This is a preview!⊘
Do you want full access?
Subscribe today to unlock all pages.
Trusted by 1+ million students worldwide

Discussion
The research study sought to check whether there is a significant connection between
government influence on business and the rate of CO2 emissions by business in the United
States of America and the United Kingdom. An independent samples t-test was carried out
between the USA and UK companies, to check whether there was a difference in their CO2
emissions. Additionally, paired samples t-tests were carried out for companies that have
integrated climate change in their strategies and those that have not in both the countries.
Findings from data analysis on the independent samples t-test showed that there was no
significant difference in the rate of reductions of CO2 emissions between the United States of
America and the United Kingdom.
These findings are in line with studies on the fight directed towards carbon emissions by
developed nations in the world. Research studies have shown that many of the developed
countries generally dedicate a similar amount of budget towards governing climate change
(Peters et al., 2015). It is therefore right to deduce that the rate of emissions is fairly the same
between the Unites States of America and the United Kingdom.
In addition, the finding from data analysis revealed that there were significant differences in
the rate of CO2 emissions between the two sets of companies in each country (that is,
companies that have integrated climate change in their business strategies and those that have
not integrated it). This clearly showed that the government had significant impacts on the
reduction in CO2 emissions by organisations in USA & United Kingdom.
Many governments are actively involved with the fight towards reducing and ultimately
curbing climate change. Research has shown that with steady government influence on the
strategies set against carbon emissions, there has been positive improvements since the
emissions have significantly reduced in such countries (Doppelt, 2017).
Further analysis of the data revealed that for both countries, the rate of CO2 emissions
reduced from the previous years. The variability of the reductions rates however was large
from the means in both nations. Additionally, the analysis results showed that most of the
selected companies had incorporated climate change in their business strategies in both the
USA and the UK.
The analysis findings for both nations reveal the importance of government involvement in
setting regulations aimed at governing climate change. Other studies have also proved that
7 | P a g e
Paraphrase This Document
Need a fresh take? Get an instant paraphrase of this document with our AI Paraphraser

government involvement in curbing climate change through company strategies has a strong
impact in reducing emissions to the atmosphere (Garmann, 2014).
Governance of climate change has been assimilated in many business strategies in a bid to
reduce CO2 emissions as per the results in the sections above. However, enough research has
not been done to check whether there are other ways which should be considered in a bid to
reduce emissions all over the globe. Therefore, it is important that more funding is directed
towards this research gap, in order to reduce the global emissions of CO2 into the
environment. This will in turn assist in governing climate change worldwide (Bryman & Bell,
2011).
From the finding of this research study, other ways of governing climate change should be
considered. A research study by Andonova et al., (2014), revealed that one of the ways of
governing climatic change is through multinational governance. The study proposed that
different factors leading to reduction of emissions should be considered collectively by
different nations, in a bid to govern the global emissions. This way, the emissions will be
governed worldwide, rather that independently by each nation. This approach might have an
impact since reduction of emission in only a few parts of the globe is not a fruitful approach.
This is because other nations with weak or no governance will continue emitting uncontrolled
CO2 and other pollutants thus increasing climate change. However, if nations come together
to govern climate change, emissions will be reduced and therefore climate change will be
significantly governed (Burnett, 2013).
Limitations of the Study
The selected sample size was large enough to detect differences between groups and
relationships between variables. However, it would be better to target more businesses that
have incorporated climate change in both UK and USA, in order to get a clearer picture of the
target population of companies (Kaplan et al., 2014).
The CDP data was collected by targeting businesses that have incorporated climate change
into their business strategies in a bid to reduce CO2 emissions. For better generalizability, the
data should also capture other factors that might lead to reduction of CO2 emissions globally.
The obtained research findings give a picture of relationship between government impact on
businesses and the reduction of CO2 emissions. These results are generalizable to other
8 | P a g e
developed nations globally. However, in order to have a picture of other developing nations
and also under- developed nations, it would be critical to include companies from such
nations (Wang & Zhao, 2015). In this way, we would have a global picture of the relationship
between governments’ influence on businesses and reduction of CO2 emissions around the
world.
Further Research
For further research, other factors apart from government influence on businesses should be
considered as predictor variables. This will help in identifying other significant factors that
explain the variation in reduction of CO2 emissions globally (Yao et al., 2015).
Additionally, while collecting data, primary data might be used in addition to secondary data
(Stewart & Kamins, 2013). Such data could be obtained through case studies of businesses
with interests in governing climate change. Such data could also be generated through
interviews or experiments targeting the aforementioned businesses across the globe.
This research study’s theoretical framework considered two developed countries as control
variables in studying the relationship between government impact on businesses and the
reduction of CO2 emissions. For further research, other intervening or control variables such
as the type of industry that a business operates in should be considered (Feng et al., 2015).
9 | P a g e
⊘ This is a preview!⊘
Do you want full access?
Subscribe today to unlock all pages.
Trusted by 1+ million students worldwide
References
Allum, N., 2015. Paired Samples T-test and the Time Sharing Experiments for the Social
Sciences (2010): Attitudes to Immigration in the USA. New York: SAGE.
Andonova, L., Betsill, M.M., Bulkeley, H., Compagnon, D., Hale, T., Hoffmann, M.J.,
Newell, P., Paterson, M., Roger, C. and VanDeveer, S.D., 2014. Transnational climate
change governance. New York: Cambridge University Press.
Bryman, A. and Bell, E. (2011) Business Research Methods 3e. London: Oxford University
Press.
Burnett, J. W. (2013) Economic Growth and Environmental Degradation. Athens: Maypop
Books.
Dahan, N.M., Doh, J.P. and Raelin, J.D., 2015. Pivoting the role of government in the
business and society interface: A stakeholder perspective. Journal of Business ethics, 131(3),
pp.665-680. New York: Springer.
Doppelt, B., 2017. Leading change toward sustainability: A change-management guide for
business, government and civil society. London: Routledge.
Feng, K., Davis, S.J., Sun, L. and Hubacek, K., (2015). Drivers of the US CO2 emissions
1997–2013. Nature communications, 6, p.7714. New York: Elsevier.
Garmann, S., 2014. Do government ideology and fragmentation matter for reducing CO2-
emissions? Empirical evidence from OECD countries. Ecological Economics, 105, pp.1-10.
New York : Elsevier.
Kaplan, R.M., Chambers, D.A. and Glasgow, R.E., 2014. Big data and large sample size: a
cautionary note on the potential for bias. Clinical and translational science, 7(4), pp.342-346.
London: Routledge.
Kim, T.K., 2015. T test as a parametric statistic. Korean journal of anesthesiology, 68(6),
pp.540-546. Korea: Seoul.
Kumar, R. (2014) Research Methodology: A Step-by-Step Guide for Beginners. India: SAGE
Publications.
10 | P a g e
Paraphrase This Document
Need a fresh take? Get an instant paraphrase of this document with our AI Paraphraser
Mackey, A. and Gass, S.M., 2015. Second language research: Methodology and design.
London: Routledge.
Peters, G.P., Le Quéré, C., Moriarty, R., Andrew, R.M., Ciais, P., Friedlingstein, P., Jones,
S.D., Sitch, S., Tans, P., Arneth, A. and Boden, T.A., 2015. Global carbon budget
2014. Earth System Science Data, 7(1), pp.47-85.
Saunders, M., Lewis, P. and Thornhill, A. (2007) Research methods for business students
fifth edition. 3rd edn. Harlow: Prentice Hall.
Stewart, D. W. and Kamins, M. A. (2013) Secondary Research: Information Sources and
Methods. 2nd edn. Newbury Park, CA: SAGE
Wang, Y. and Zhao, T., 2015. Impacts of energy-related CO2 emissions: evidence from
under developed, developing and highly developed regions in China. Ecological
Indicators, 50, pp.186-195.
Yao, C., Feng, K. and Hubacek, K., 2015. Driving forces of CO2 emissions in the G20
countries: An index decomposition analysis from 1971 to 2010. Ecological informatics, 26,
pp.93-100. New York: Elsevier.
Yu, Y. and Choi, Y., 2016. Stakeholder pressure and CSR adoption: The mediating role of
organizational culture for Chinese companies. The social science journal, 53(2), pp.226-235.
Beijing: Elsevier.
11 | P a g e
1 out of 11
Related Documents


Your All-in-One AI-Powered Toolkit for Academic Success.
+13062052269
info@desklib.com
Available 24*7 on WhatsApp / Email
![[object Object]](/_next/static/media/star-bottom.7253800d.svg)
Unlock your academic potential
Copyright © 2020–2026 A2Z Services. All Rights Reserved. Developed and managed by ZUCOL.