Economics and Quantitative Analysis: Graduation Rate Regression
VerifiedAdded on  2023/04/24
|10
|1967
|73
Report
AI Summary
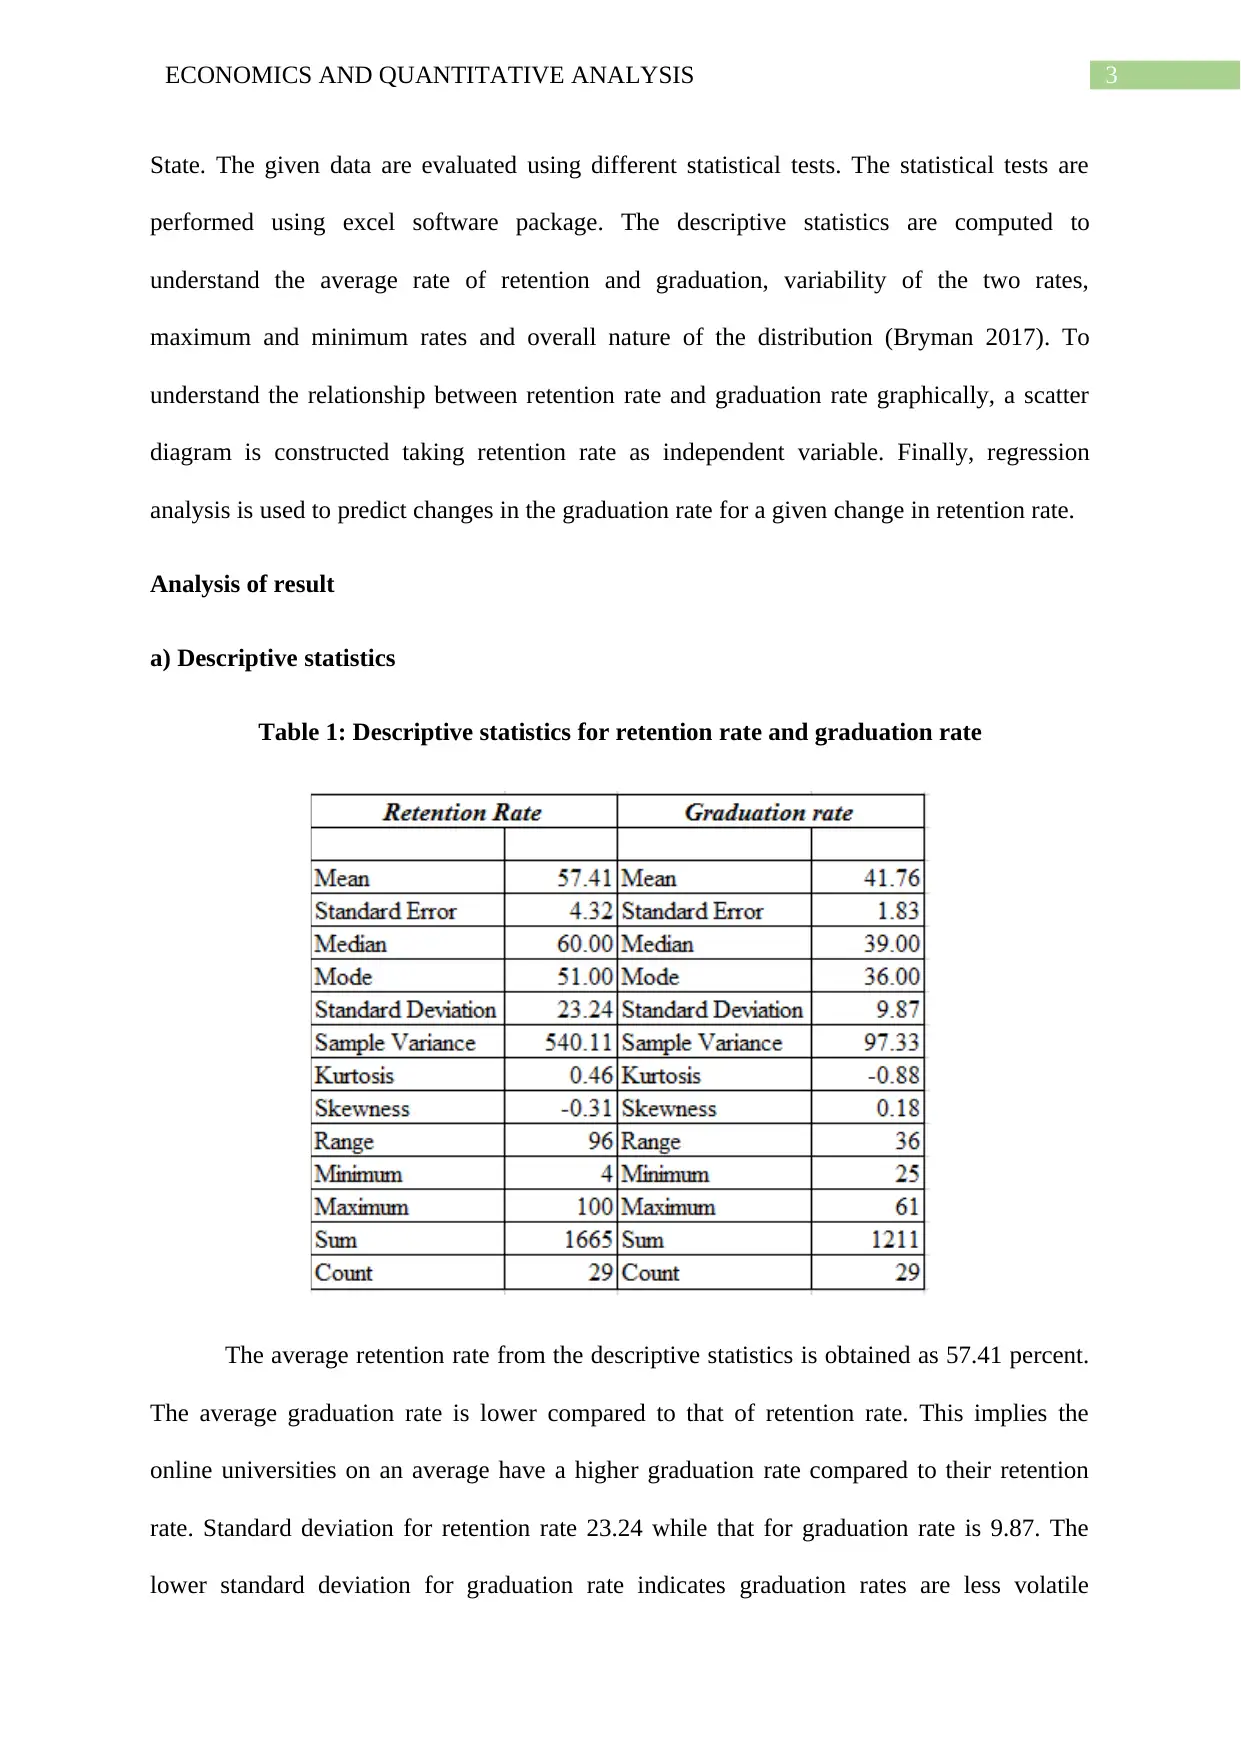
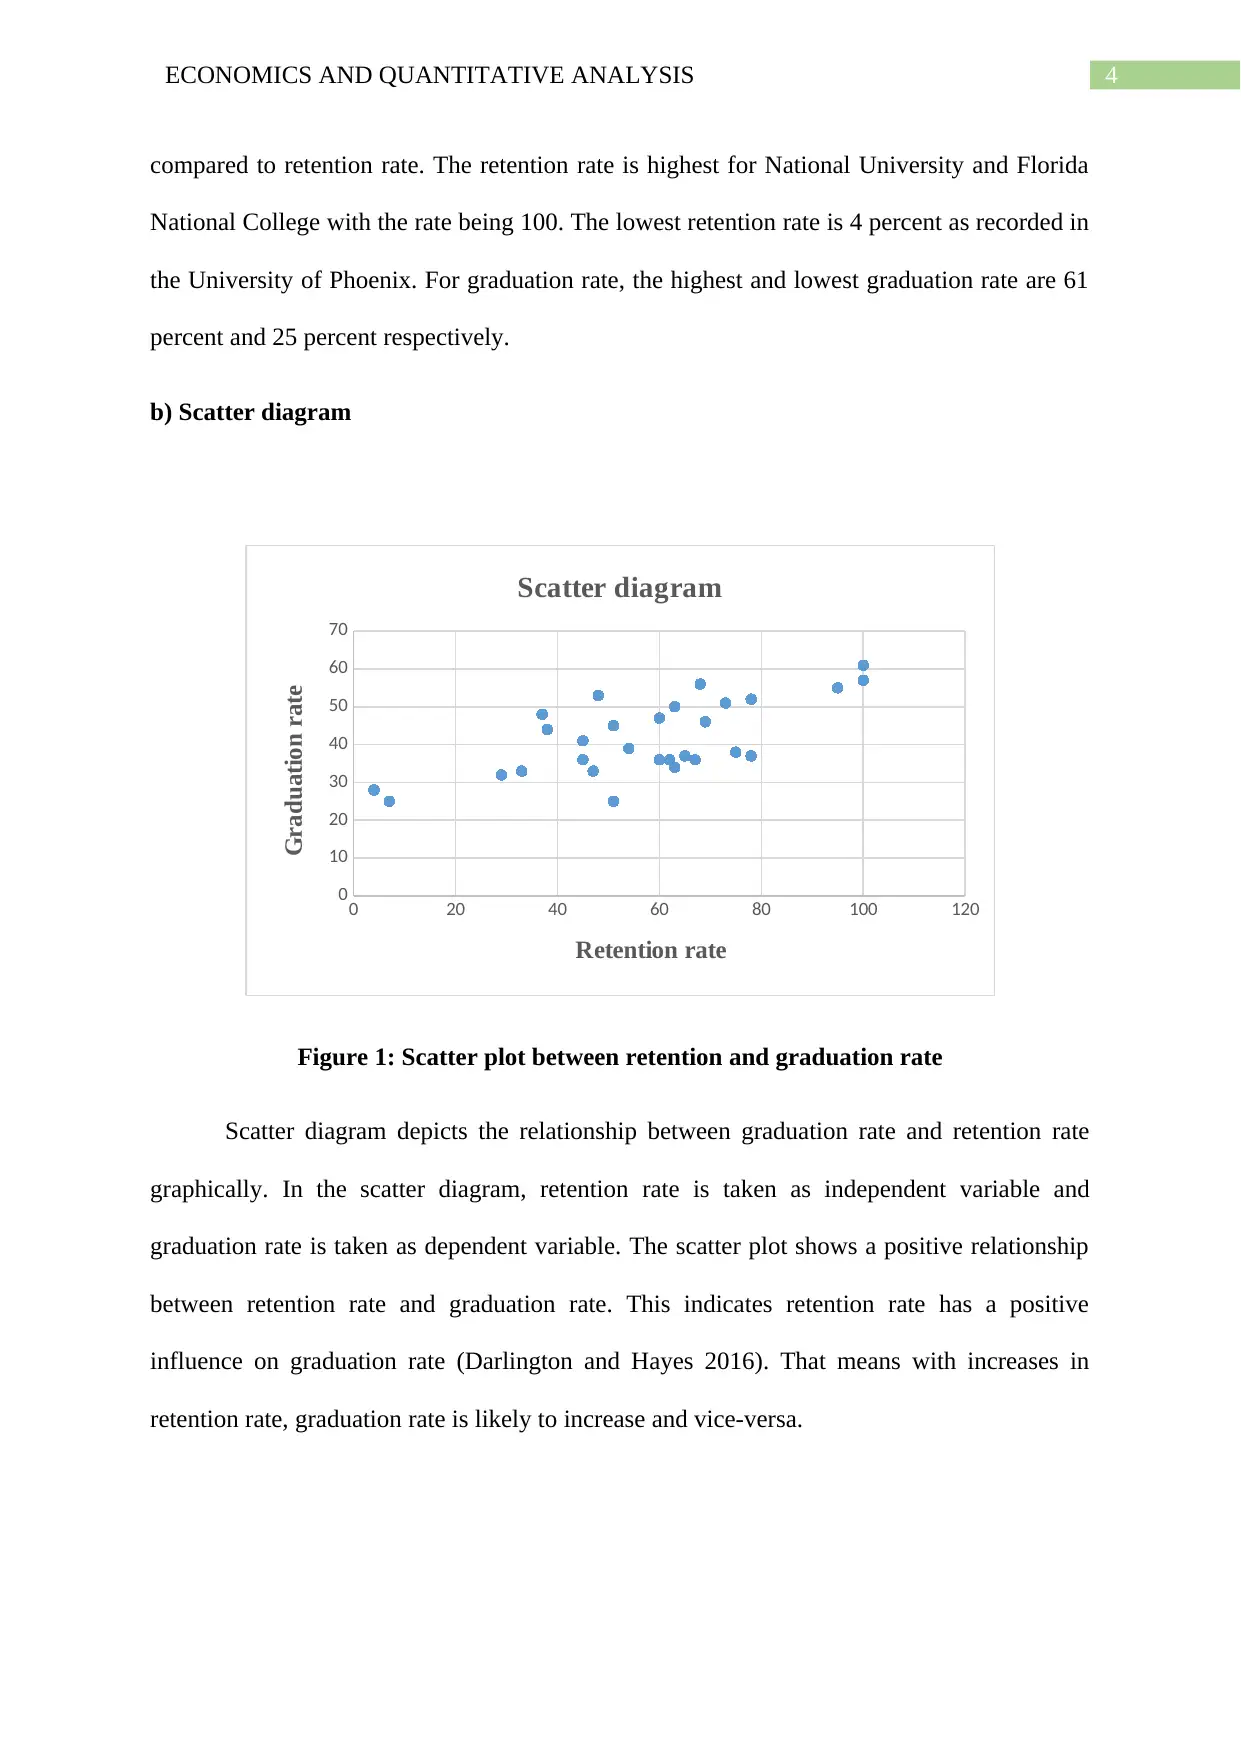
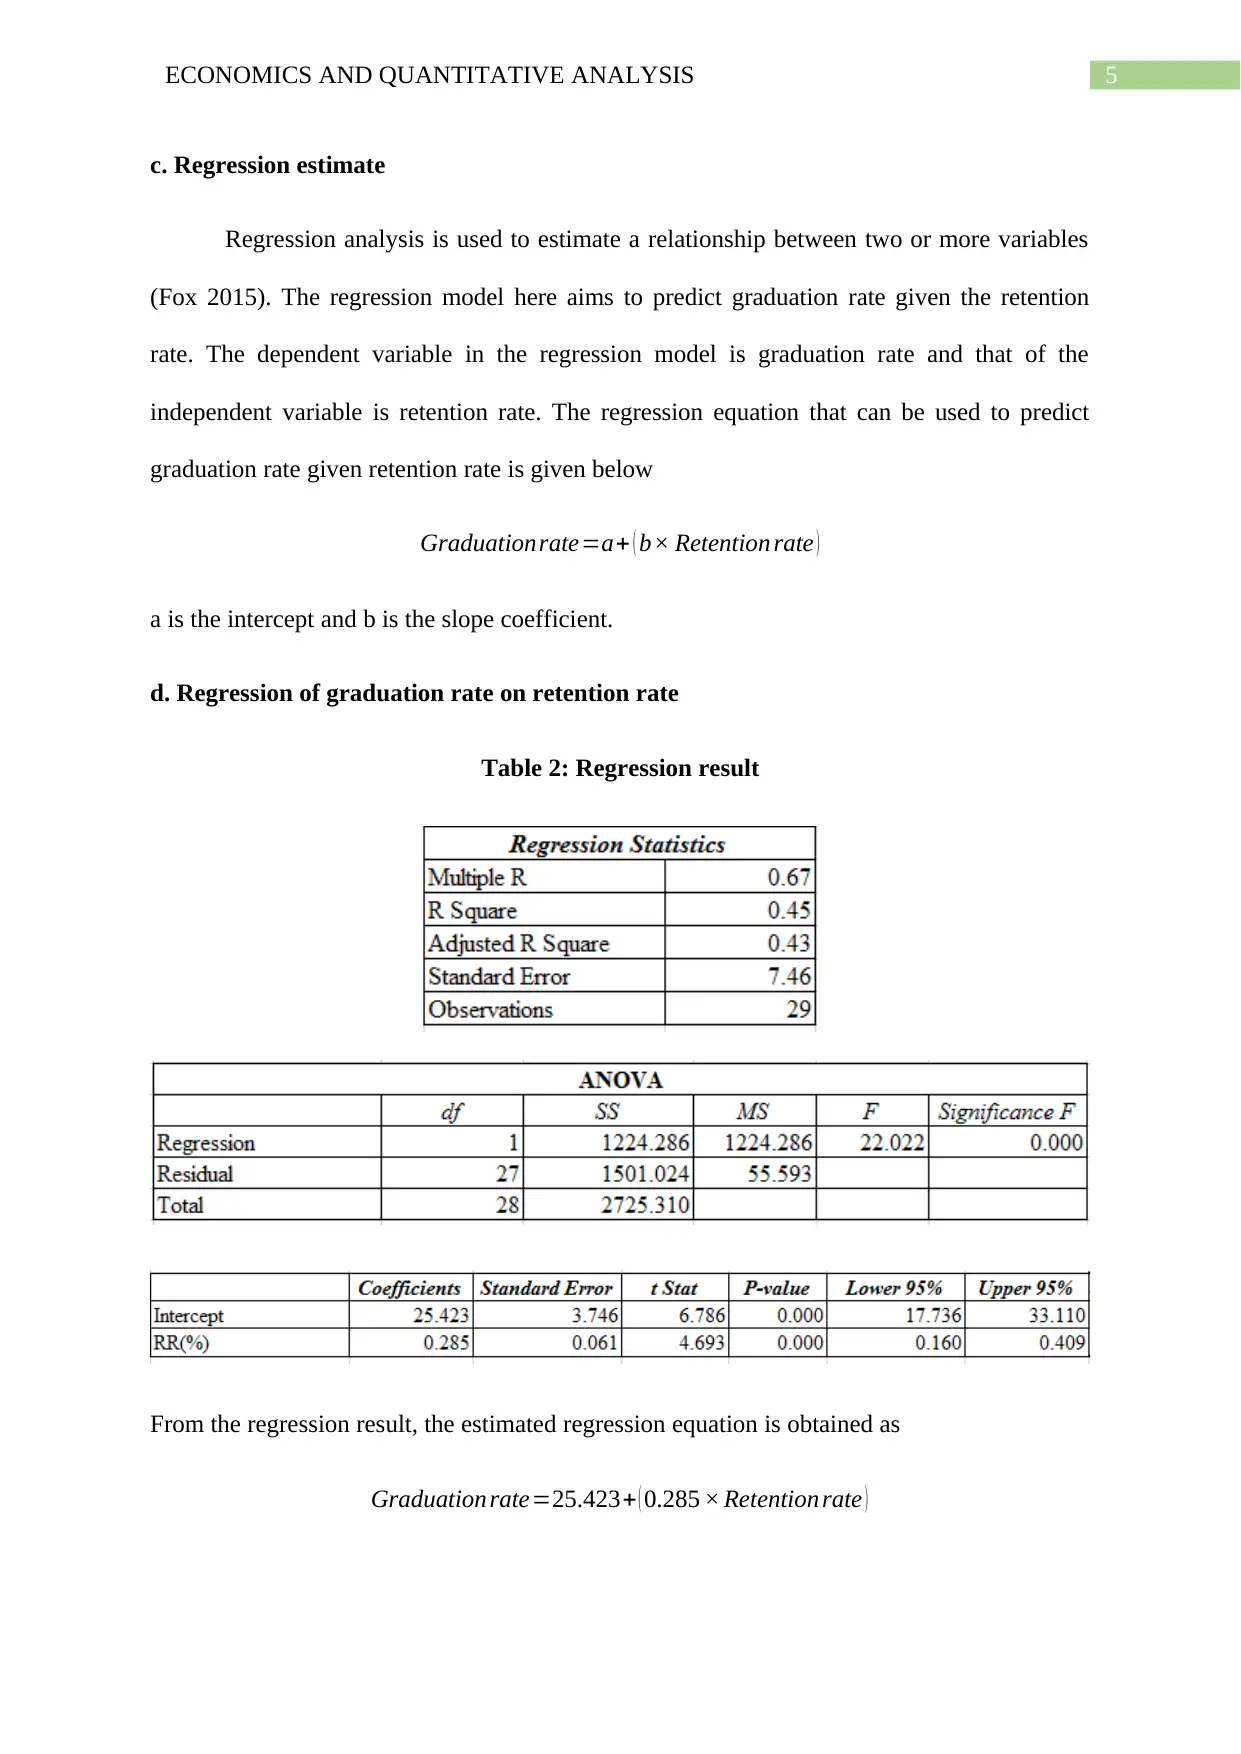
This report investigates the relationship between retention and graduation rates in online colleges using linear regression analysis. The study utilizes data from 29 online colleges in the United States to examine how retention rates influence graduation rates. Descriptive statistics are presented, revealing average retention and graduation rates, along with their variability. A scatter diagram illustrates the positive association between the two variables, and regression analysis provides an equation to predict graduation rates based on retention rates. The results indicate a significant positive relationship, with retention rate explaining a substantial portion of the variation in graduation rate. Specific cases, such as South University and the University of Phoenix, are discussed in relation to their retention and graduation rates. The report concludes with recommendations for universities to enhance retention rates in order to improve graduation rates, emphasizing the importance of transparent expectations, innovative teaching methods, and effective evaluation systems. Desklib provides access to this report and many other solved assignments to help students study effectively.

Running head: ECONOMICS AND QUANTITATIVE ANALYSIS
Economics And Quantitative Analysis
Name of the Student
Name of the University
Course ID
Economics And Quantitative Analysis
Name of the Student
Name of the University
Course ID
Paraphrase This Document
Need a fresh take? Get an instant paraphrase of this document with our AI Paraphraser

1ECONOMICS AND QUANTITATIVE ANALYSIS
Table of Contents
Purpose of the report..................................................................................................................2
Background of the study............................................................................................................2
Methodology..............................................................................................................................2
Analysis of result........................................................................................................................3
a) Descriptive statistics..........................................................................................................3
b) Scatter diagram..................................................................................................................4
c. Regression estimate............................................................................................................5
d. Regression of graduation rate on retention rate.................................................................5
e. Association between graduation rate and attention rate.....................................................6
f. Goodness of fit....................................................................................................................6
g. South University.................................................................................................................6
h. University of Phoenix........................................................................................................7
Discussion..................................................................................................................................7
Recommendation........................................................................................................................8
References..................................................................................................................................9

2ECONOMICS AND QUANTITATIVE ANALYSIS
Purpose of the report
. Retention rate represents the percentage of students who continue their education in
the institute. Graduation rate is the percentage of students completing specific graduation
degree (Olbrecht, Romano and Teigen 2016). The main purpose of this report is to evaluate
the relationship between retention and graduation rate for online college students. More
specifically, the report aims to find how retention rate influences graduation rate.
Background of the study
In the field of education, retention rate and graduation rate are the two important
concept. Retention refers to a situation where students continue their studies until successful
completion. It is defined as the strategies and effort to identify and anticipate need of the
students prior to enrollment to higher studies (Pike and Graunke 2015). Graduation rate on
the other hand refers to the rate of completion of graduation degree in the university.
Retention rate likely to have a positive impact on higher studies and hence increases
graduation rates. This is because high retention rate helps to connect high school student to
academically challenging and learning environment. The proposed relation between retention
and graduation encourage economist to undertake different studies in this field (Raju and
Schumacker 2015). Policymaker are particularly interested in evaluating the relationship and
design strategy for student retention accordingly.
Methodology
The paper employs quantitative data analysis method to estimate the relation between
retention and graduation rate. The quantitative data analysis method transforms raw numbers
into meaningful data by application of critical and rational thinking. Such an approach is used
in order to find evidences for either accepting or rejecting hypotheses (Brannen 2017). Data
has been provided for retention and graduation rate of twenty-nine online colleges in United
⊘ This is a preview!⊘
Do you want full access?
Subscribe today to unlock all pages.

Trusted by 1+ million students worldwide

3ECONOMICS AND QUANTITATIVE ANALYSIS
State. The given data are evaluated using different statistical tests. The statistical tests are
performed using excel software package. The descriptive statistics are computed to
understand the average rate of retention and graduation, variability of the two rates,
maximum and minimum rates and overall nature of the distribution (Bryman 2017). To
understand the relationship between retention rate and graduation rate graphically, a scatter
diagram is constructed taking retention rate as independent variable. Finally, regression
analysis is used to predict changes in the graduation rate for a given change in retention rate.
Analysis of result
a) Descriptive statistics
Table 1: Descriptive statistics for retention rate and graduation rate
The average retention rate from the descriptive statistics is obtained as 57.41 percent.
The average graduation rate is lower compared to that of retention rate. This implies the
online universities on an average have a higher graduation rate compared to their retention
rate. Standard deviation for retention rate 23.24 while that for graduation rate is 9.87. The
lower standard deviation for graduation rate indicates graduation rates are less volatile
Paraphrase This Document
Need a fresh take? Get an instant paraphrase of this document with our AI Paraphraser

4ECONOMICS AND QUANTITATIVE ANALYSIS
compared to retention rate. The retention rate is highest for National University and Florida
National College with the rate being 100. The lowest retention rate is 4 percent as recorded in
the University of Phoenix. For graduation rate, the highest and lowest graduation rate are 61
percent and 25 percent respectively.
b) Scatter diagram
0 20 40 60 80 100 120
0
10
20
30
40
50
60
70
Scatter diagram
Retention rate
Graduation rate
Figure 1: Scatter plot between retention and graduation rate
Scatter diagram depicts the relationship between graduation rate and retention rate
graphically. In the scatter diagram, retention rate is taken as independent variable and
graduation rate is taken as dependent variable. The scatter plot shows a positive relationship
between retention rate and graduation rate. This indicates retention rate has a positive
influence on graduation rate (Darlington and Hayes 2016). That means with increases in
retention rate, graduation rate is likely to increase and vice-versa.

5ECONOMICS AND QUANTITATIVE ANALYSIS
c. Regression estimate
Regression analysis is used to estimate a relationship between two or more variables
(Fox 2015). The regression model here aims to predict graduation rate given the retention
rate. The dependent variable in the regression model is graduation rate and that of the
independent variable is retention rate. The regression equation that can be used to predict
graduation rate given retention rate is given below
Graduationrate=a+ ( b× Retention rate )
a is the intercept and b is the slope coefficient.
d. Regression of graduation rate on retention rate
Table 2: Regression result
From the regression result, the estimated regression equation is obtained as
Graduation rate=25.423+ ( 0.285 × Retention rate )
⊘ This is a preview!⊘
Do you want full access?
Subscribe today to unlock all pages.

Trusted by 1+ million students worldwide

6ECONOMICS AND QUANTITATIVE ANALYSIS
The slope coefficient here measure unit change in graduation rate for a given unit
change in retention rate. The obtained slope coefficient is 0.285. The coefficient implies that
for 1 percent change in retention rate, graduation rate increases by 0.29 percent.
e. Association between graduation rate and attention rate
The regression result shows a positive association between graduation and retention
rate. Obtained p value for the regression coefficient is 0.000. As the p value is less than the
significance value of 0.05, the null hypothesis of no significant relation between graduation
rate and retention rate are rejected (Chatterjee and Hadi 2015). There is thus a significant
association between the two variables.
f. Goodness of fit
The good-fitted regression model indicates that predicted values from the model are
closer to observed values. In the linear regression model, R-squared is used as a measure of
goodness of fit. It is a statistical measure indicating percentage of variation in the dependent
variable as explained by the independent variables. It actually measures strength of estimated
relationship (Darlington and Hayes 2016). The value of R square in the regression model is
0.67. This explains retention rate can explain 67 percent variation in the graduation rate. As
the R square value is quite high it indicates a strong relationship between retention rate and
graduation rate and the model is a good fit model.
g. South University
For South University, the retention rate is 51 percent and the graduation rate is 25
percent. In case of retention rate, there is not much concern as retention rate is almost close to
average retention rate in all the universities. However, graduation rate in the University is the
lowest among all the online universities. The lower graduation rate is a cause of concern for
South University.
Paraphrase This Document
Need a fresh take? Get an instant paraphrase of this document with our AI Paraphraser

7ECONOMICS AND QUANTITATIVE ANALYSIS
h. University of Phoenix
For University of Phoenix the respective rate of retention and graduation are 4 percent
and 28 percent respectively. Both retention and graduation rate in the University of Phoenix
is relatively low when compared to other online universities. Retention rate of the university
is the lowest and the graduation rate is the second lowest. The relatively lower rate of both
retention and graduation rate are cause of concern for the University.
Discussion
The results suggest that average retention rate in the chosen online universities are
higher compared to the graduation rate. The higher average retention rate is associated with a
higher variability in the rate. The regression estimate suggests a positive significant
association between retention rate and graduation rate. The mode is also a good-fitted model.
The main strength of quantitative data analysis method is it is comparatively easy to
interpret the result if data are collected from reliable sources. The results obtained from
sample data can be generalized for the entire population (Sutter and Paulson 2017).
Therefore, the estimated relationship between retention rate and graduation rate for the
selected online universities can be generalized for all the online universities.
Relatively small sample size is the first limitation of the model. Additionally, the
paper considers retention rate as the only independent variable for predicting graduation rate.
Other variables that might influence graduation rate are not considered.
Result of this report is consistent with findings of past literature suggesting a positive
association between retention rate and graduation rate (Crawford 2015). Finding of this paper
together with other related literatures have strong policy implication for the education system.

8ECONOMICS AND QUANTITATIVE ANALYSIS
Recommendation
The report shows a positive association between retention and graduation. Higher
retention rate thus ensures higher graduation rate. Policies therefore should be taken to
enhance the retention rate to increase graduation rate.
The universities should focus on setting expectations with the transparency.
The university should employ new and innovating teaching and research method to increase
the retention rate.
Finally, the universities should adapt an appropriate evaluation system and improve the
teaching mechanism using responses from the student.
⊘ This is a preview!⊘
Do you want full access?
Subscribe today to unlock all pages.

Trusted by 1+ million students worldwide

9ECONOMICS AND QUANTITATIVE ANALYSIS
References
Brannen, J., 2017. Mixing methods: Qualitative and quantitative research. Routledge.
Bryman, A., 2017. Quantitative and qualitative research: further reflections on their
integration. In Mixing methods: Qualitative and quantitative research (pp. 57-78). Routledge.
Chatterjee, S. and Hadi, A.S., 2015. Regression analysis by example. John Wiley & Sons.
Crawford, G.A., 2015. The academic library and student retention and graduation: An
exploratory study. portal: Libraries and the Academy, 15(1), pp.41-57.
Darlington, R.B. and Hayes, A.F., 2016. Regression analysis and linear models: Concepts,
applications, and implementation. Guilford Publications.
Fox, J., 2015. Applied regression analysis and generalized linear models. Sage Publications.
Olbrecht, A.M., Romano, C. and Teigen, J., 2016. How money helps keep students in
college: The relationship between family finances, merit-based aid, and retention in higher
education. Journal of Student Financial Aid, 46(1), p.2.
Pike, G.R. and Graunke, S.S., 2015. Examining the effects of institutional and cohort
characteristics on retention rates. Research in Higher Education, 56(2), pp.146-165.
Raju, D. and Schumacker, R., 2015. Exploring student characteristics of retention that lead to
graduation in higher education using data mining models. Journal of College Student
Retention: Research, Theory & Practice, 16(4), pp.563-591.
Sutter, N. and Paulson, S., 2017. Predicting college students' intention to graduate: a test of
the theory of planned behavior. College Student Journal, 50(3), pp.409-421.
1 out of 10
Related Documents

Your All-in-One AI-Powered Toolkit for Academic Success.
 +13062052269
info@desklib.com
Available 24*7 on WhatsApp / Email
Unlock your academic potential
Copyright © 2020–2025 A2Z Services. All Rights Reserved. Developed and managed by ZUCOL.