Grand Canyon University PSY-380, Spring 2020: Topic One Homework
VerifiedAdded on 2022/08/16
|11
|1860
|3
Homework Assignment
AI Summary
This document presents the complete solution for the PSY-380 Topic One Homework assignment, completed for Grand Canyon University in Spring 2020. The assignment covers fundamental concepts in statistics and research methods, including identifying independent and dependent variables, distinguishing between qualitative and quantitative variables, and understanding descriptive and inferential statistics. The solution includes answers to questions on data scales, continuous and discrete data, samples versus populations, cumulative frequency distributions, percentile ranks, stem-and-leaf displays, frequency distributions, and bar graphs. The assignment also involves interpreting data from real-world scenarios, such as the number of commercials shown during children's programming and opinions on same-sex marriage. This resource is designed to assist students in understanding and mastering the core principles of statistical analysis and research design within the field of psychology.
2/5/2020 Topic One Homework - PSY-380, section LS02/03/20, Spring 2020 | WebAssign
https://www.webassign.net/web/Student/Assignment-Responses/submit?dep=23286304&tags=autosave 1/11
jjjtong23@gmail.com
(sign out)
PSY-380, section LS02/03/20, Spring 2020
Topic One Homework (Homework)
INSTRUCTOR
Lindsey Scholta
Grand Canyon University, AZ
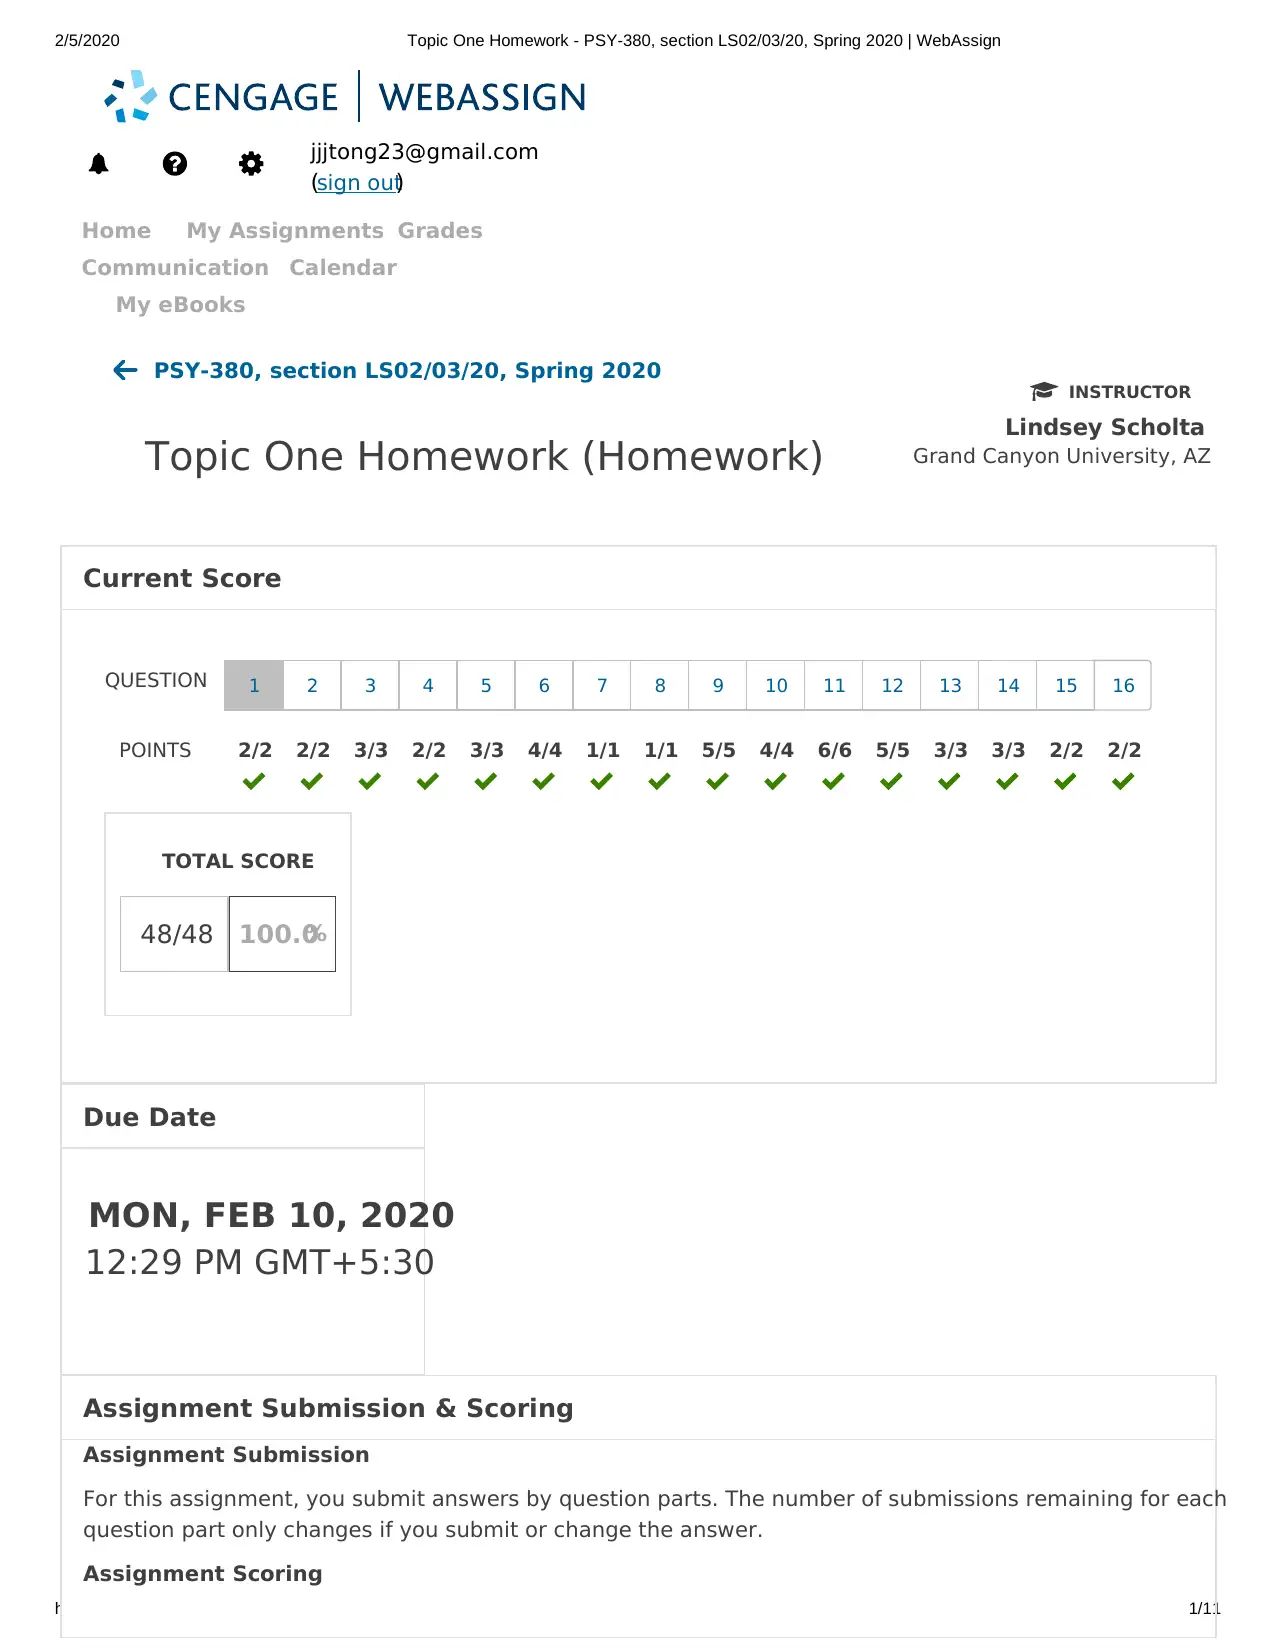
Current Score
QUESTION
POINTS
1 2 3 4 5 6 7 8 9 10 11 12 13 14 15 16
TOTAL SCORE
48/48 100.0%
MON, FEB 10, 2020
12:29 PM GMT+5:30
Assignment Submission & Scoring
Assignment Submission
For this assignment, you submit answers by question parts. The number of submissions remaining for each
question part only changes if you submit or change the answer.
Assignment Scoring
Home My Assignments Grades
Communication Calendar
My eBooks
2/2 2/2 3/3 2/2 3/3 4/4 1/1 1/1 5/5 4/4 6/6 5/5 3/3 3/3 2/2 2/2
Due Date
https://www.webassign.net/web/Student/Assignment-Responses/submit?dep=23286304&tags=autosave 1/11
jjjtong23@gmail.com
(sign out)
PSY-380, section LS02/03/20, Spring 2020
Topic One Homework (Homework)
INSTRUCTOR
Lindsey Scholta
Grand Canyon University, AZ
Current Score
QUESTION
POINTS
1 2 3 4 5 6 7 8 9 10 11 12 13 14 15 16
TOTAL SCORE
48/48 100.0%
MON, FEB 10, 2020
12:29 PM GMT+5:30
Assignment Submission & Scoring
Assignment Submission
For this assignment, you submit answers by question parts. The number of submissions remaining for each
question part only changes if you submit or change the answer.
Assignment Scoring
Home My Assignments Grades
Communication Calendar
My eBooks
2/2 2/2 3/3 2/2 3/3 4/4 1/1 1/1 5/5 4/4 6/6 5/5 3/3 3/3 2/2 2/2
Due Date
Paraphrase This Document
Need a fresh take? Get an instant paraphrase of this document with our AI Paraphraser
2/5/2020 Topic One Homework - PSY-380, section LS02/03/20, Spring 2020 | WebAssign
https://www.webassign.net/web/Student/Assignment-Responses/submit?dep=23286304&tags=autosave 2/11
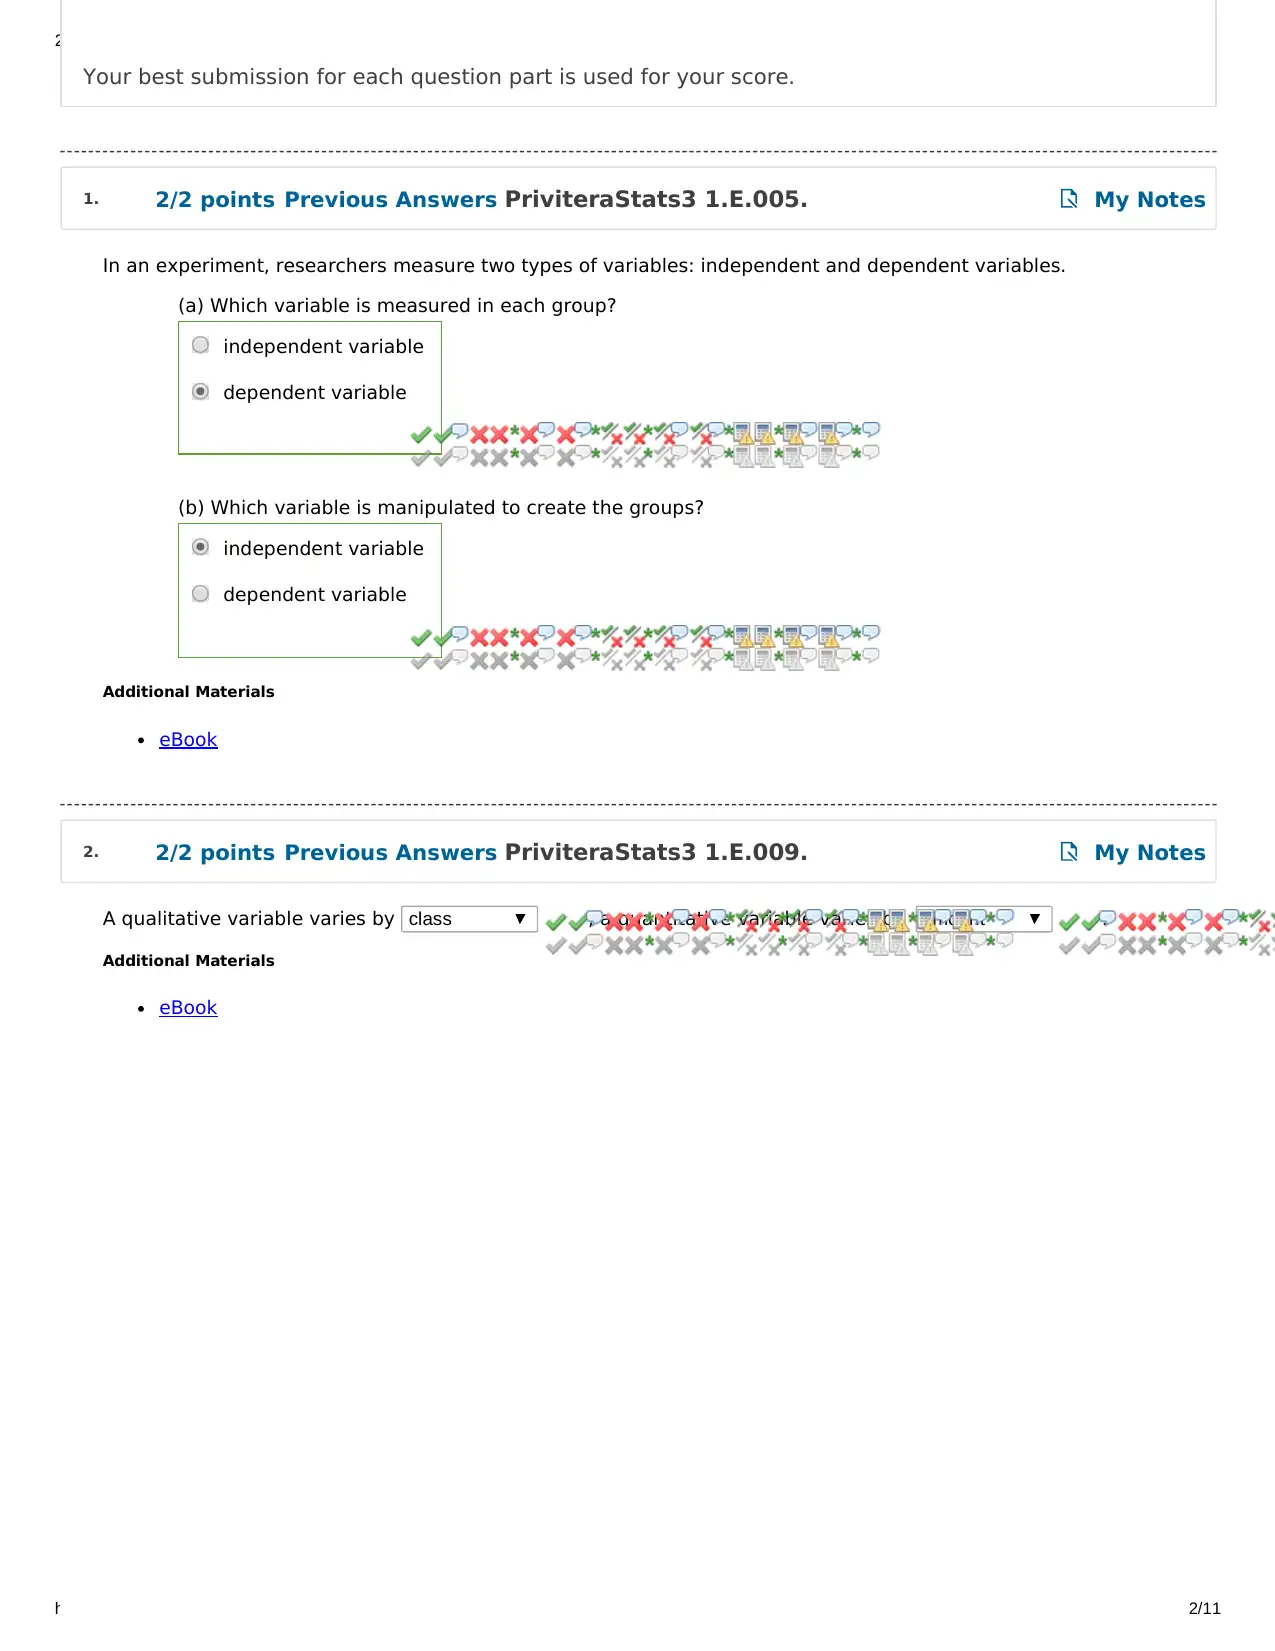
In an experiment, researchers measure two types of variables: independent and dependent variables.
(a) Which variable is measured in each group?
(b) Which variable is manipulated to create the groups?
Additional Materials
eBook
A qualitative variable varies by class ; a quantitative variable varies by amount .
Additional Materials
eBook
Your best submission for each question part is used for your score.
independent variable
dependent variable
independent variable
dependent variable
1. 2/2 points Previous Answers PriviteraStats3 1.E.005. My Notes
2. 2/2 points Previous Answers PriviteraStats3 1.E.009. My Notes
https://www.webassign.net/web/Student/Assignment-Responses/submit?dep=23286304&tags=autosave 2/11
In an experiment, researchers measure two types of variables: independent and dependent variables.
(a) Which variable is measured in each group?
(b) Which variable is manipulated to create the groups?
Additional Materials
eBook
A qualitative variable varies by class ; a quantitative variable varies by amount .
Additional Materials
eBook
Your best submission for each question part is used for your score.
independent variable
dependent variable
independent variable
dependent variable
1. 2/2 points Previous Answers PriviteraStats3 1.E.005. My Notes
2. 2/2 points Previous Answers PriviteraStats3 1.E.009. My Notes
2/5/2020 Topic One Homework - PSY-380, section LS02/03/20, Spring 2020 | WebAssign
https://www.webassign.net/web/Student/Assignment-Responses/submit?dep=23286304&tags=autosave 3/11
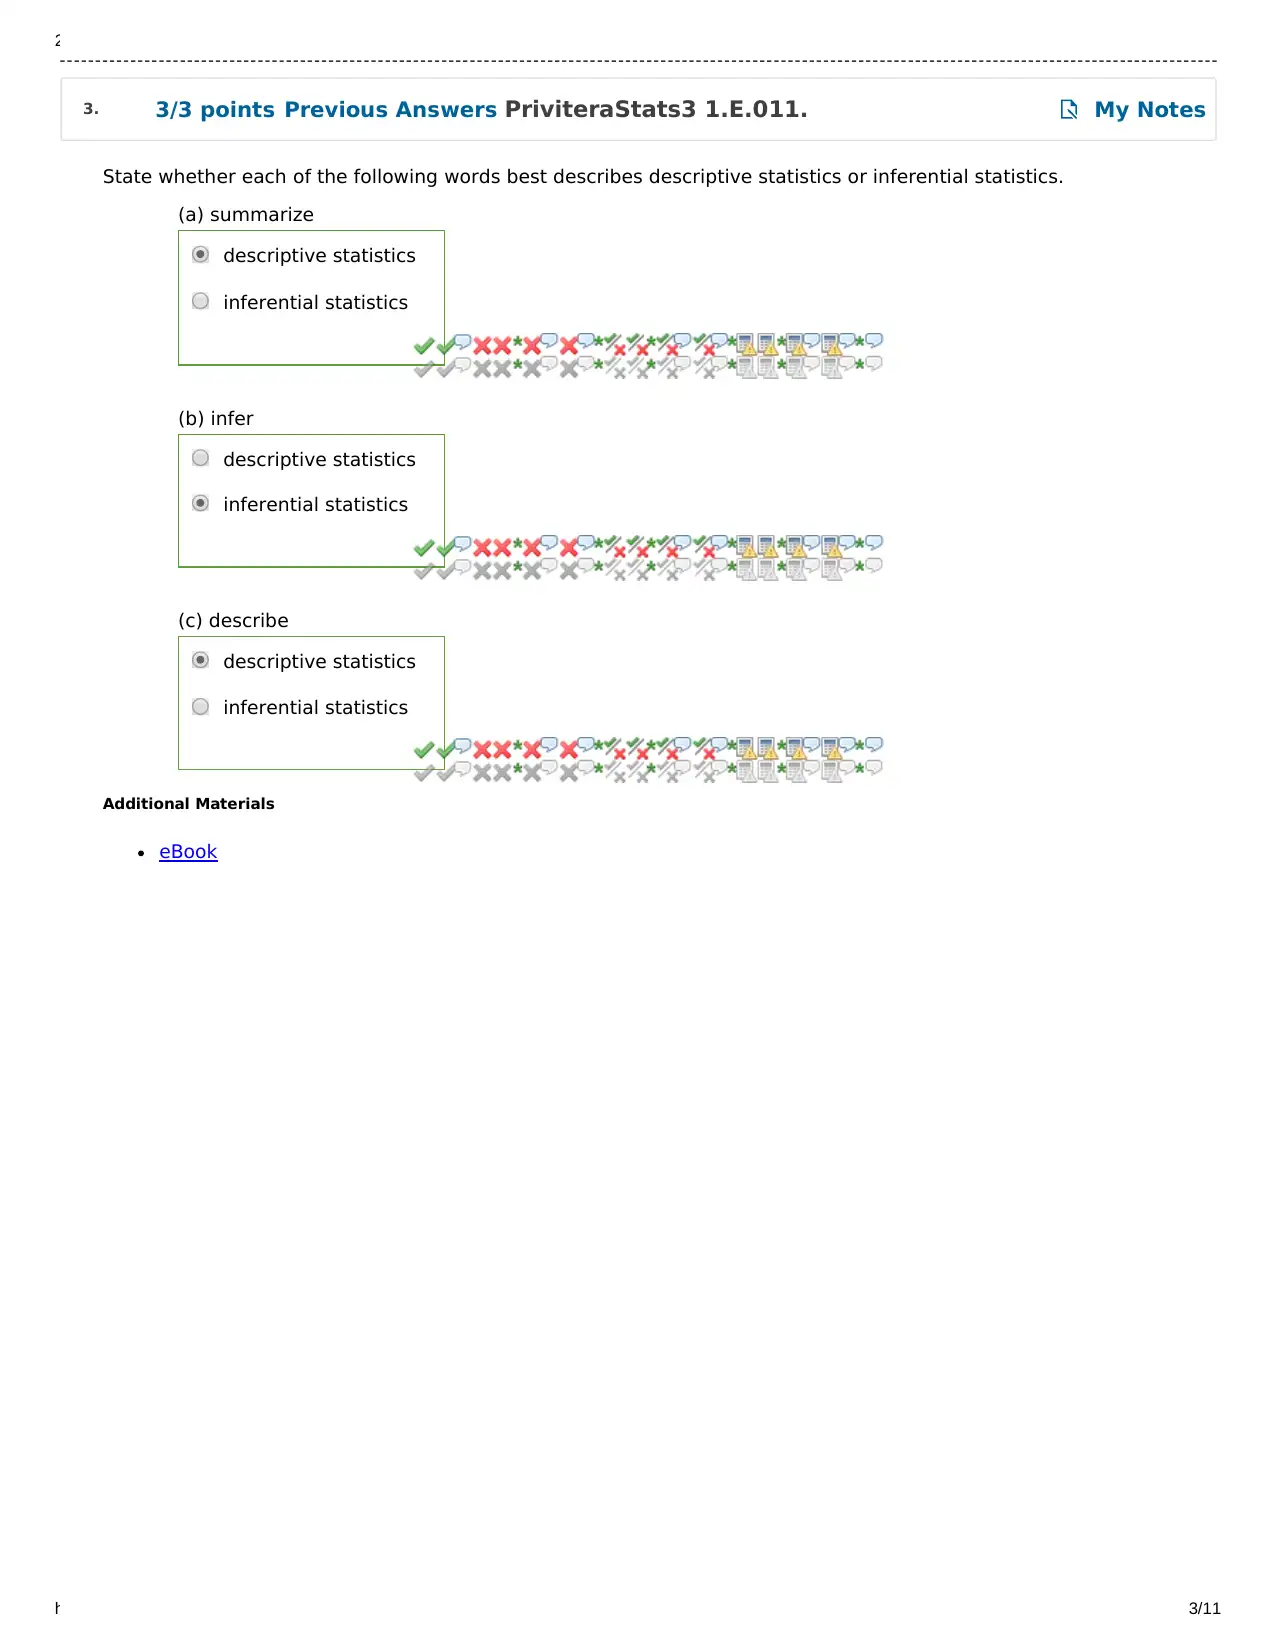
State whether each of the following words best describes descriptive statistics or inferential statistics.
(a) summarize
(b) infer
(c) describe
Additional Materials
eBook
descriptive statistics
inferential statistics
descriptive statistics
inferential statistics
descriptive statistics
inferential statistics
3. 3/3 points Previous Answers PriviteraStats3 1.E.011. My Notes
https://www.webassign.net/web/Student/Assignment-Responses/submit?dep=23286304&tags=autosave 3/11
State whether each of the following words best describes descriptive statistics or inferential statistics.
(a) summarize
(b) infer
(c) describe
Additional Materials
eBook
descriptive statistics
inferential statistics
descriptive statistics
inferential statistics
descriptive statistics
inferential statistics
3. 3/3 points Previous Answers PriviteraStats3 1.E.011. My Notes
⊘ This is a preview!⊘
Do you want full access?
Subscribe today to unlock all pages.
Trusted by 1+ million students worldwide
2/5/2020 Topic One Homework - PSY-380, section LS02/03/20, Spring 2020 | WebAssign
https://www.webassign.net/web/Student/Assignment-Responses/submit?dep=23286304&tags=autosave 4/11
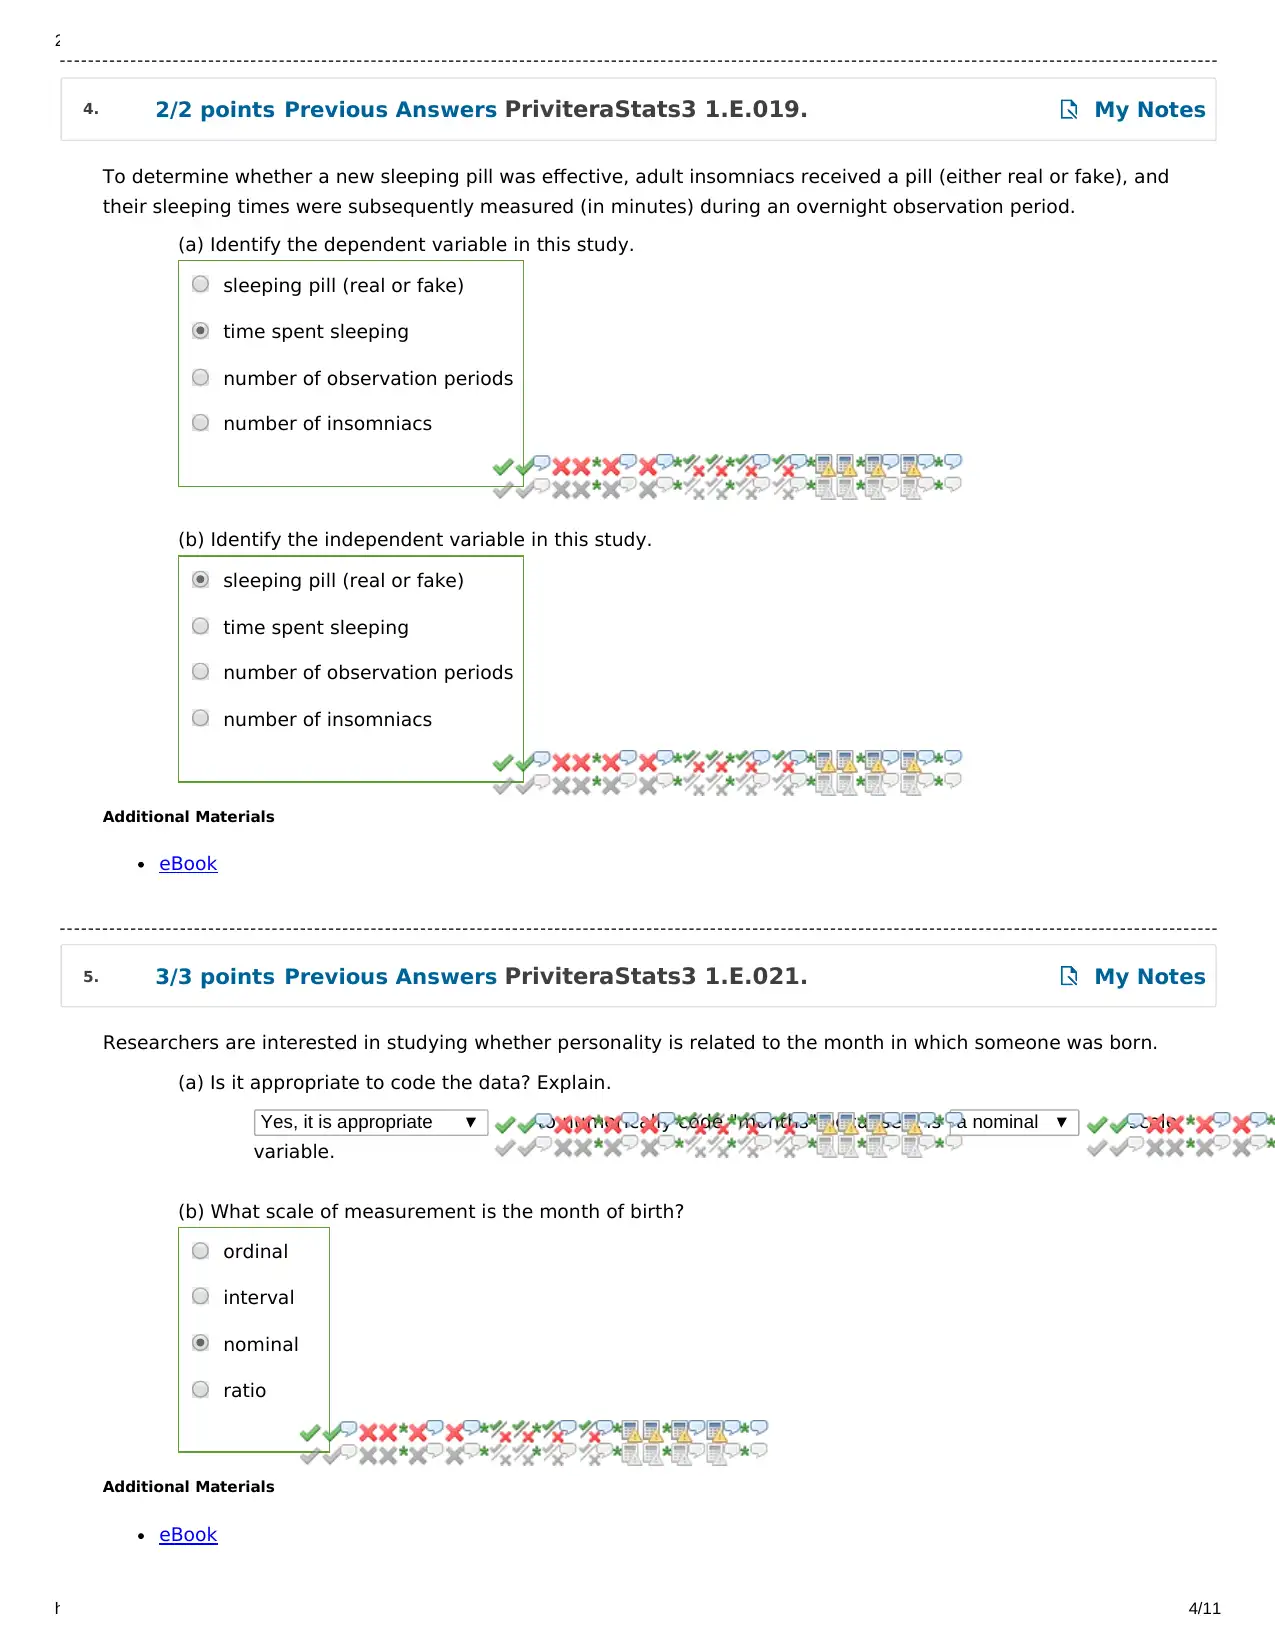
To determine whether a new sleeping pill was effective, adult insomniacs received a pill (either real or fake), and
their sleeping times were subsequently measured (in minutes) during an overnight observation period.
(a) Identify the dependent variable in this study.
(b) Identify the independent variable in this study.
Additional Materials
eBook
Researchers are interested in studying whether personality is related to the month in which someone was born.
(a) Is it appropriate to code the data? Explain.
Yes, it is appropriate to numerically code "months" because it is a nominal scale
variable.
(b) What scale of measurement is the month of birth?
Additional Materials
eBook
sleeping pill (real or fake)
time spent sleeping
number of observation periods
number of insomniacs
sleeping pill (real or fake)
time spent sleeping
number of observation periods
number of insomniacs
ordinal
interval
nominal
ratio
4. 2/2 points Previous Answers PriviteraStats3 1.E.019. My Notes
5. 3/3 points Previous Answers PriviteraStats3 1.E.021. My Notes
https://www.webassign.net/web/Student/Assignment-Responses/submit?dep=23286304&tags=autosave 4/11
To determine whether a new sleeping pill was effective, adult insomniacs received a pill (either real or fake), and
their sleeping times were subsequently measured (in minutes) during an overnight observation period.
(a) Identify the dependent variable in this study.
(b) Identify the independent variable in this study.
Additional Materials
eBook
Researchers are interested in studying whether personality is related to the month in which someone was born.
(a) Is it appropriate to code the data? Explain.
Yes, it is appropriate to numerically code "months" because it is a nominal scale
variable.
(b) What scale of measurement is the month of birth?
Additional Materials
eBook
sleeping pill (real or fake)
time spent sleeping
number of observation periods
number of insomniacs
sleeping pill (real or fake)
time spent sleeping
number of observation periods
number of insomniacs
ordinal
interval
nominal
ratio
4. 2/2 points Previous Answers PriviteraStats3 1.E.019. My Notes
5. 3/3 points Previous Answers PriviteraStats3 1.E.021. My Notes
Paraphrase This Document
Need a fresh take? Get an instant paraphrase of this document with our AI Paraphraser
2/5/2020 Topic One Homework - PSY-380, section LS02/03/20, Spring 2020 | WebAssign
https://www.webassign.net/web/Student/Assignment-Responses/submit?dep=23286304&tags=autosave 5/11
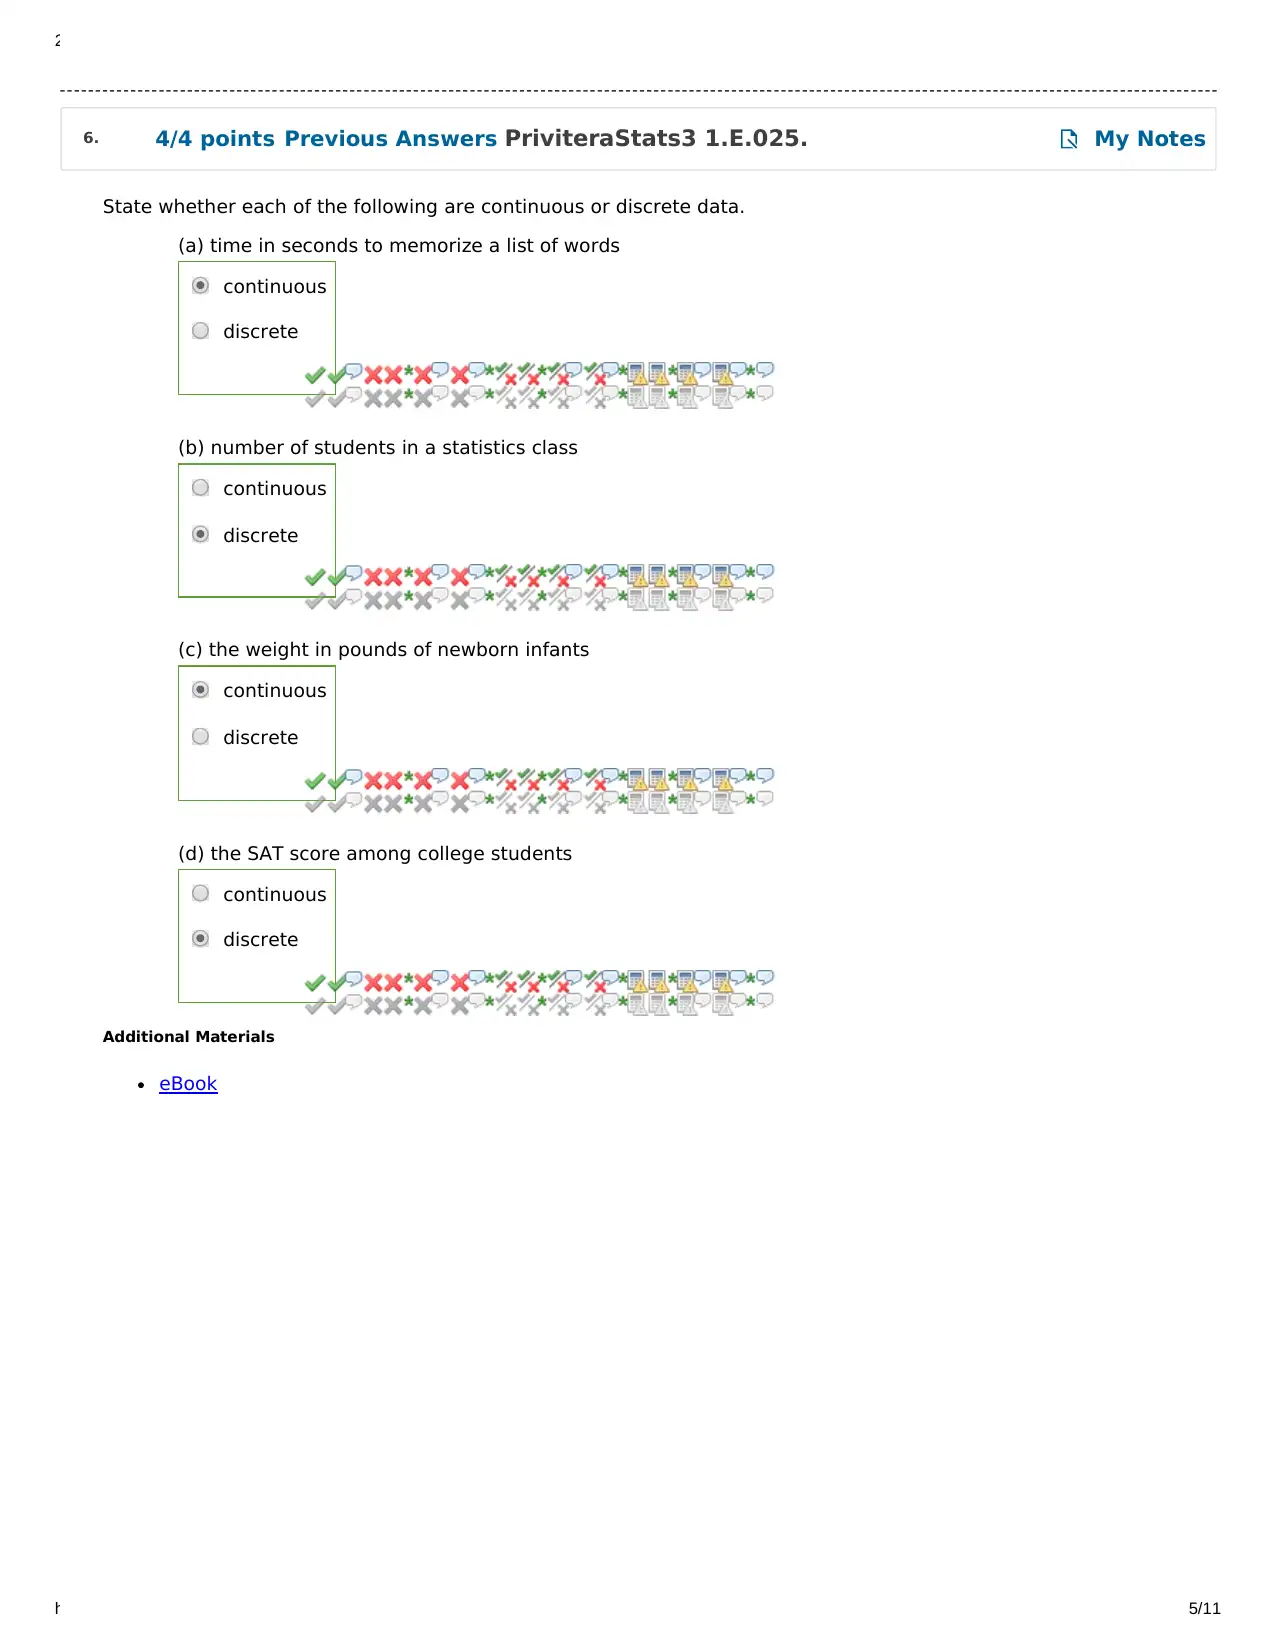
State whether each of the following are continuous or discrete data.
(a) time in seconds to memorize a list of words
(b) number of students in a statistics class
(c) the weight in pounds of newborn infants
(d) the SAT score among college students
Additional Materials
eBook
continuous
discrete
continuous
discrete
continuous
discrete
continuous
discrete
6. 4/4 points Previous Answers PriviteraStats3 1.E.025. My Notes
https://www.webassign.net/web/Student/Assignment-Responses/submit?dep=23286304&tags=autosave 5/11
State whether each of the following are continuous or discrete data.
(a) time in seconds to memorize a list of words
(b) number of students in a statistics class
(c) the weight in pounds of newborn infants
(d) the SAT score among college students
Additional Materials
eBook
continuous
discrete
continuous
discrete
continuous
discrete
continuous
discrete
6. 4/4 points Previous Answers PriviteraStats3 1.E.025. My Notes
2/5/2020 Topic One Homework - PSY-380, section LS02/03/20, Spring 2020 | WebAssign
https://www.webassign.net/web/Student/Assignment-Responses/submit?dep=23286304&tags=autosave 6/11
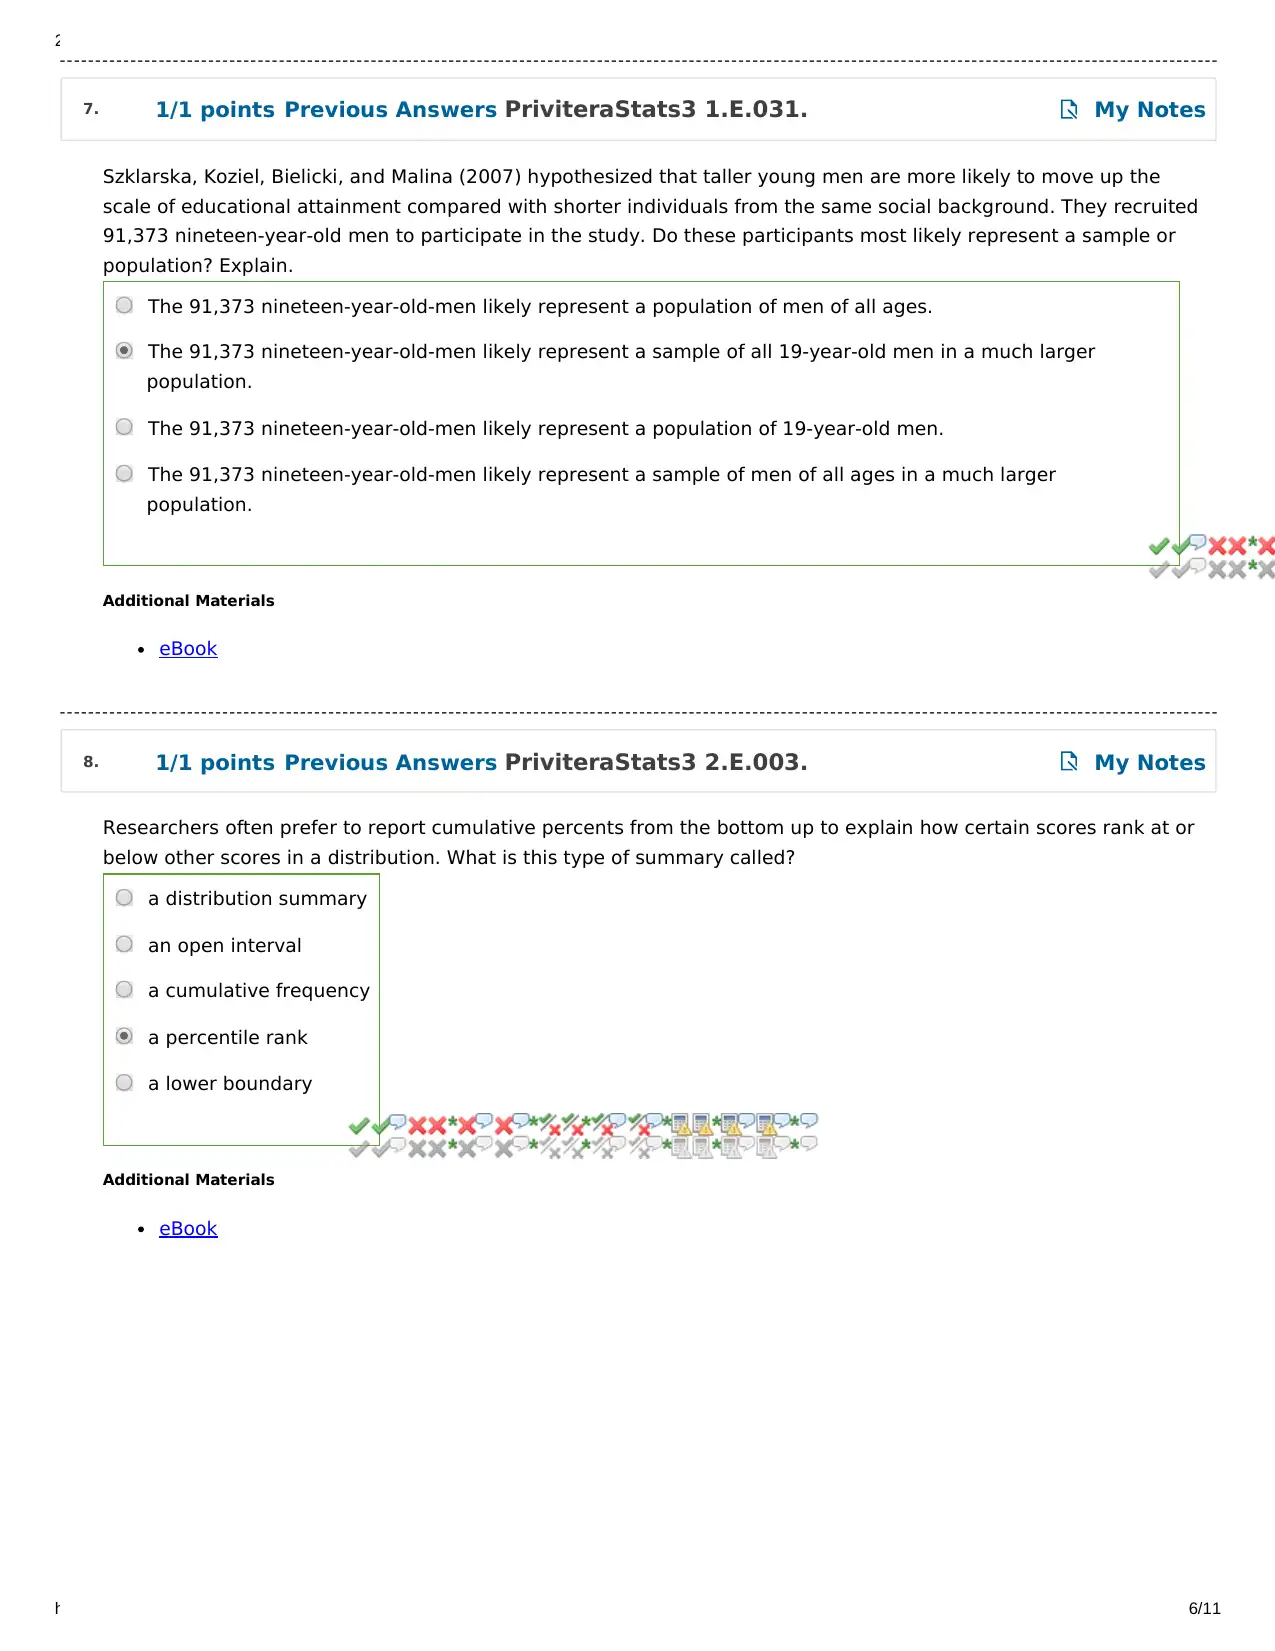
Szklarska, Koziel, Bielicki, and Malina (2007) hypothesized that taller young men are more likely to move up the
scale of educational attainment compared with shorter individuals from the same social background. They recruited
91,373 nineteen-year-old men to participate in the study. Do these participants most likely represent a sample or
population? Explain.
Additional Materials
eBook
Researchers often prefer to report cumulative percents from the bottom up to explain how certain scores rank at or
below other scores in a distribution. What is this type of summary called?
Additional Materials
eBook
The 91,373 nineteen-year-old-men likely represent a population of men of all ages.
The 91,373 nineteen-year-old-men likely represent a sample of all 19-year-old men in a much larger
population.
The 91,373 nineteen-year-old-men likely represent a population of 19-year-old men.
The 91,373 nineteen-year-old-men likely represent a sample of men of all ages in a much larger
population.
a distribution summary
an open interval
a cumulative frequency
a percentile rank
a lower boundary
7. 1/1 points Previous Answers PriviteraStats3 1.E.031. My Notes
8. 1/1 points Previous Answers PriviteraStats3 2.E.003. My Notes
https://www.webassign.net/web/Student/Assignment-Responses/submit?dep=23286304&tags=autosave 6/11
Szklarska, Koziel, Bielicki, and Malina (2007) hypothesized that taller young men are more likely to move up the
scale of educational attainment compared with shorter individuals from the same social background. They recruited
91,373 nineteen-year-old men to participate in the study. Do these participants most likely represent a sample or
population? Explain.
Additional Materials
eBook
Researchers often prefer to report cumulative percents from the bottom up to explain how certain scores rank at or
below other scores in a distribution. What is this type of summary called?
Additional Materials
eBook
The 91,373 nineteen-year-old-men likely represent a population of men of all ages.
The 91,373 nineteen-year-old-men likely represent a sample of all 19-year-old men in a much larger
population.
The 91,373 nineteen-year-old-men likely represent a population of 19-year-old men.
The 91,373 nineteen-year-old-men likely represent a sample of men of all ages in a much larger
population.
a distribution summary
an open interval
a cumulative frequency
a percentile rank
a lower boundary
7. 1/1 points Previous Answers PriviteraStats3 1.E.031. My Notes
8. 1/1 points Previous Answers PriviteraStats3 2.E.003. My Notes
⊘ This is a preview!⊘
Do you want full access?
Subscribe today to unlock all pages.
Trusted by 1+ million students worldwide
2/5/2020 Topic One Homework - PSY-380, section LS02/03/20, Spring 2020 | WebAssign
https://www.webassign.net/web/Student/Assignment-Responses/submit?dep=23286304&tags=autosave 7/11
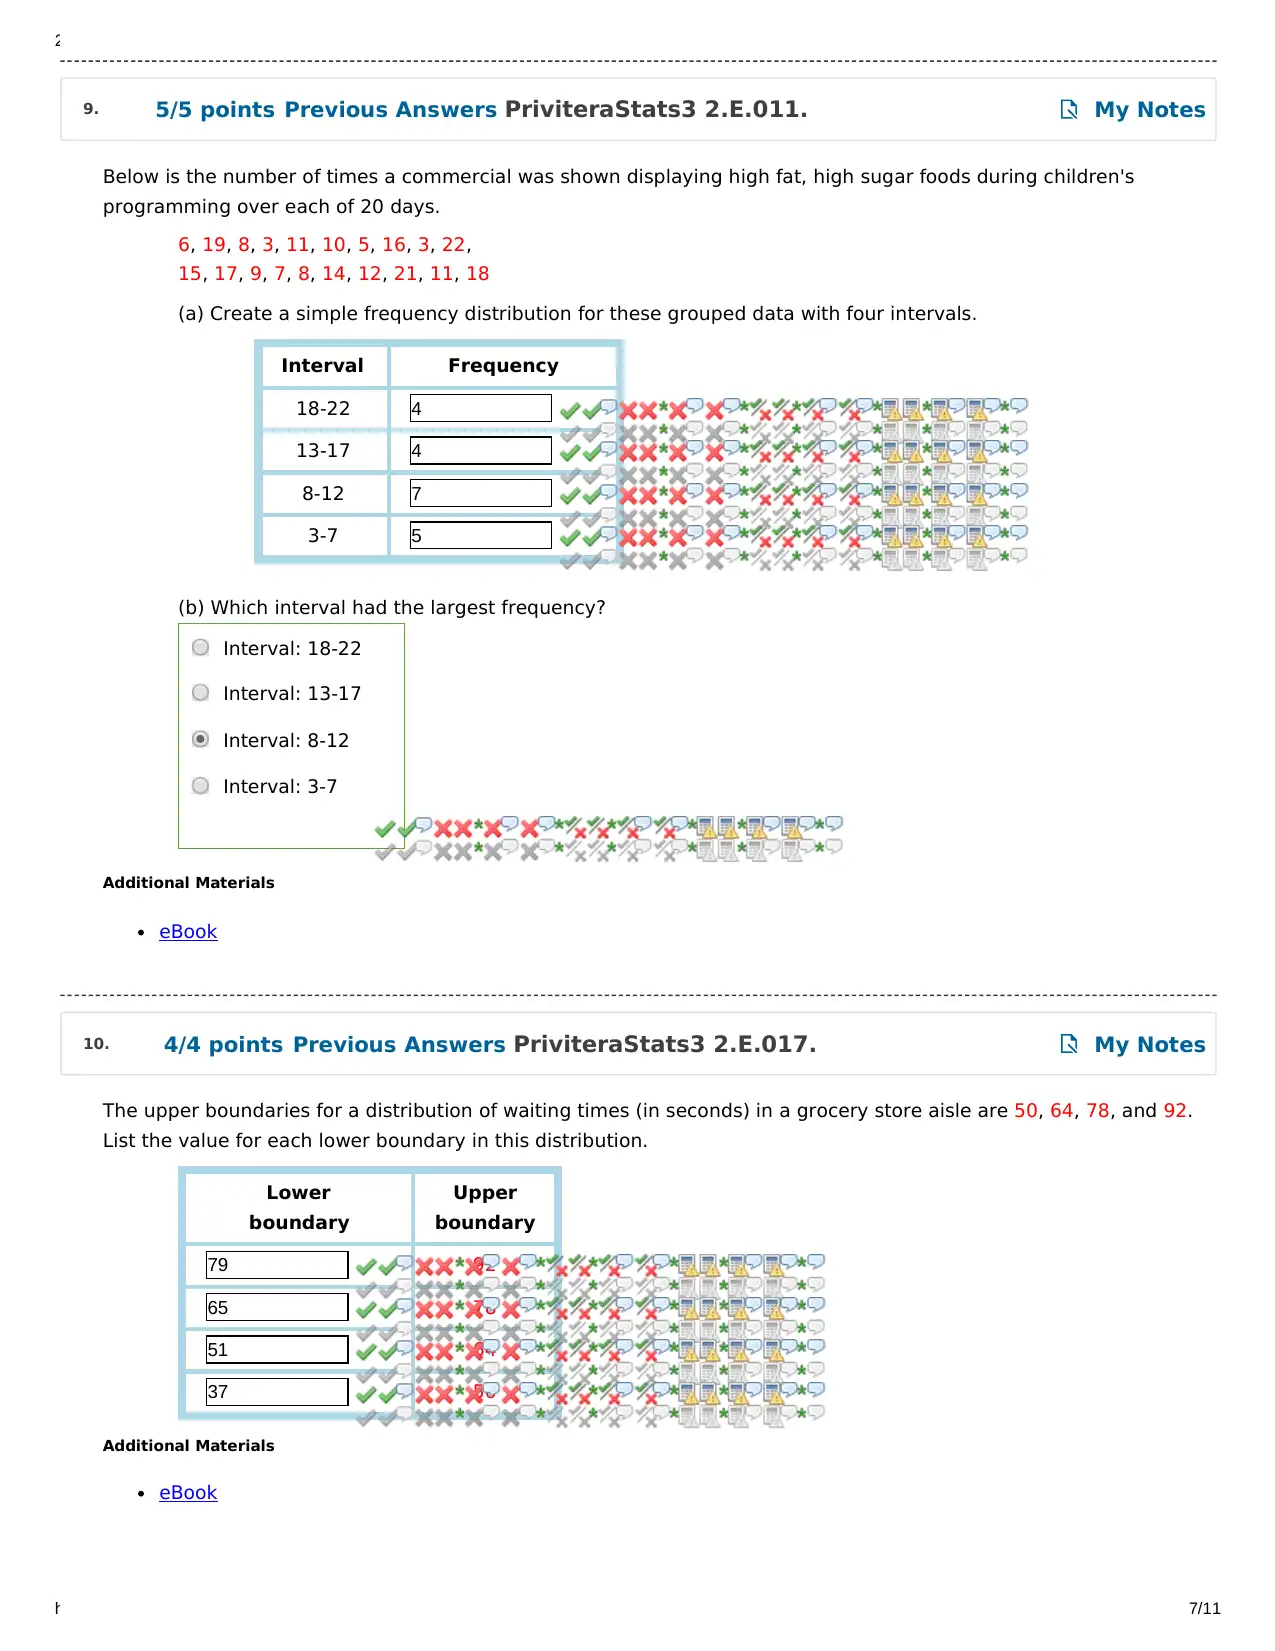
Below is the number of times a commercial was shown displaying high fat, high sugar foods during children's
programming over each of 20 days.
6, 19, 8, 3, 11, 10, 5, 16, 3, 22,
15, 17, 9, 7, 8, 14, 12, 21, 11, 18
(a) Create a simple frequency distribution for these grouped data with four intervals.
Interval Frequency
18-22 4
13-17 4
8-12 7
3-7 5
(b) Which interval had the largest frequency?
Additional Materials
eBook
The upper boundaries for a distribution of waiting times (in seconds) in a grocery store aisle are 50, 64, 78, and 92.
List the value for each lower boundary in this distribution.
Lower
boundary
Upper
boundary
79 92
65 78
51 64
37 50
Additional Materials
eBook
Interval: 18-22
Interval: 13-17
Interval: 8-12
Interval: 3-7
9. 5/5 points Previous Answers PriviteraStats3 2.E.011. My Notes
10. 4/4 points Previous Answers PriviteraStats3 2.E.017. My Notes
https://www.webassign.net/web/Student/Assignment-Responses/submit?dep=23286304&tags=autosave 7/11
Below is the number of times a commercial was shown displaying high fat, high sugar foods during children's
programming over each of 20 days.
6, 19, 8, 3, 11, 10, 5, 16, 3, 22,
15, 17, 9, 7, 8, 14, 12, 21, 11, 18
(a) Create a simple frequency distribution for these grouped data with four intervals.
Interval Frequency
18-22 4
13-17 4
8-12 7
3-7 5
(b) Which interval had the largest frequency?
Additional Materials
eBook
The upper boundaries for a distribution of waiting times (in seconds) in a grocery store aisle are 50, 64, 78, and 92.
List the value for each lower boundary in this distribution.
Lower
boundary
Upper
boundary
79 92
65 78
51 64
37 50
Additional Materials
eBook
Interval: 18-22
Interval: 13-17
Interval: 8-12
Interval: 3-7
9. 5/5 points Previous Answers PriviteraStats3 2.E.011. My Notes
10. 4/4 points Previous Answers PriviteraStats3 2.E.017. My Notes
Paraphrase This Document
Need a fresh take? Get an instant paraphrase of this document with our AI Paraphraser
2/5/2020 Topic One Homework - PSY-380, section LS02/03/20, Spring 2020 | WebAssign
https://www.webassign.net/web/Student/Assignment-Responses/submit?dep=23286304&tags=autosave 8/11
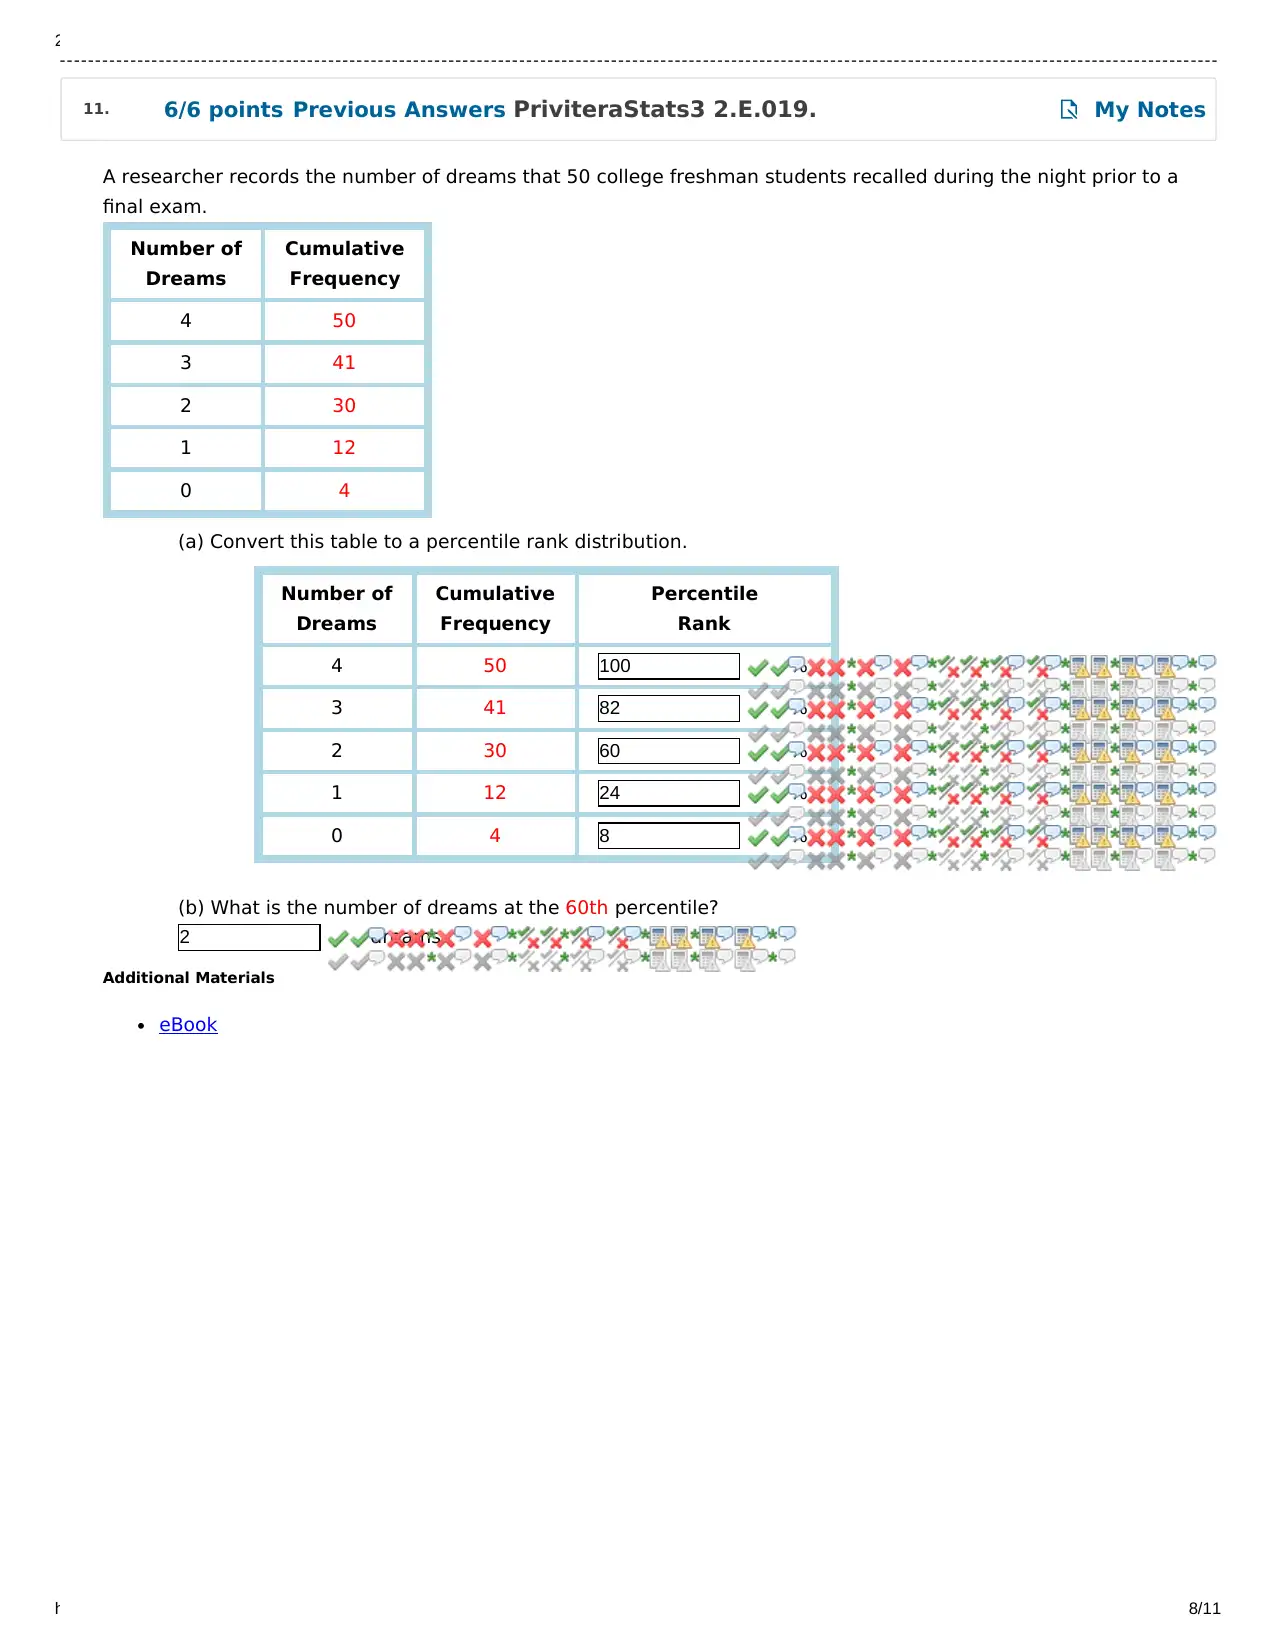
A researcher records the number of dreams that 50 college freshman students recalled during the night prior to a
final exam.
Number of
Dreams
Cumulative
Frequency
4 50
3 41
2 30
1 12
0 4
(a) Convert this table to a percentile rank distribution.
Number of
Dreams
Cumulative
Frequency
Percentile
Rank
4 50 100 %
3 41 82 %
2 30 60 %
1 12 24 %
0 4 8 %
(b) What is the number of dreams at the 60th percentile?
2 dreams
Additional Materials
eBook
11. 6/6 points Previous Answers PriviteraStats3 2.E.019. My Notes
https://www.webassign.net/web/Student/Assignment-Responses/submit?dep=23286304&tags=autosave 8/11
A researcher records the number of dreams that 50 college freshman students recalled during the night prior to a
final exam.
Number of
Dreams
Cumulative
Frequency
4 50
3 41
2 30
1 12
0 4
(a) Convert this table to a percentile rank distribution.
Number of
Dreams
Cumulative
Frequency
Percentile
Rank
4 50 100 %
3 41 82 %
2 30 60 %
1 12 24 %
0 4 8 %
(b) What is the number of dreams at the 60th percentile?
2 dreams
Additional Materials
eBook
11. 6/6 points Previous Answers PriviteraStats3 2.E.019. My Notes
2/5/2020 Topic One Homework - PSY-380, section LS02/03/20, Spring 2020 | WebAssign
https://www.webassign.net/web/Student/Assignment-Responses/submit?dep=23286304&tags=autosave 9/11
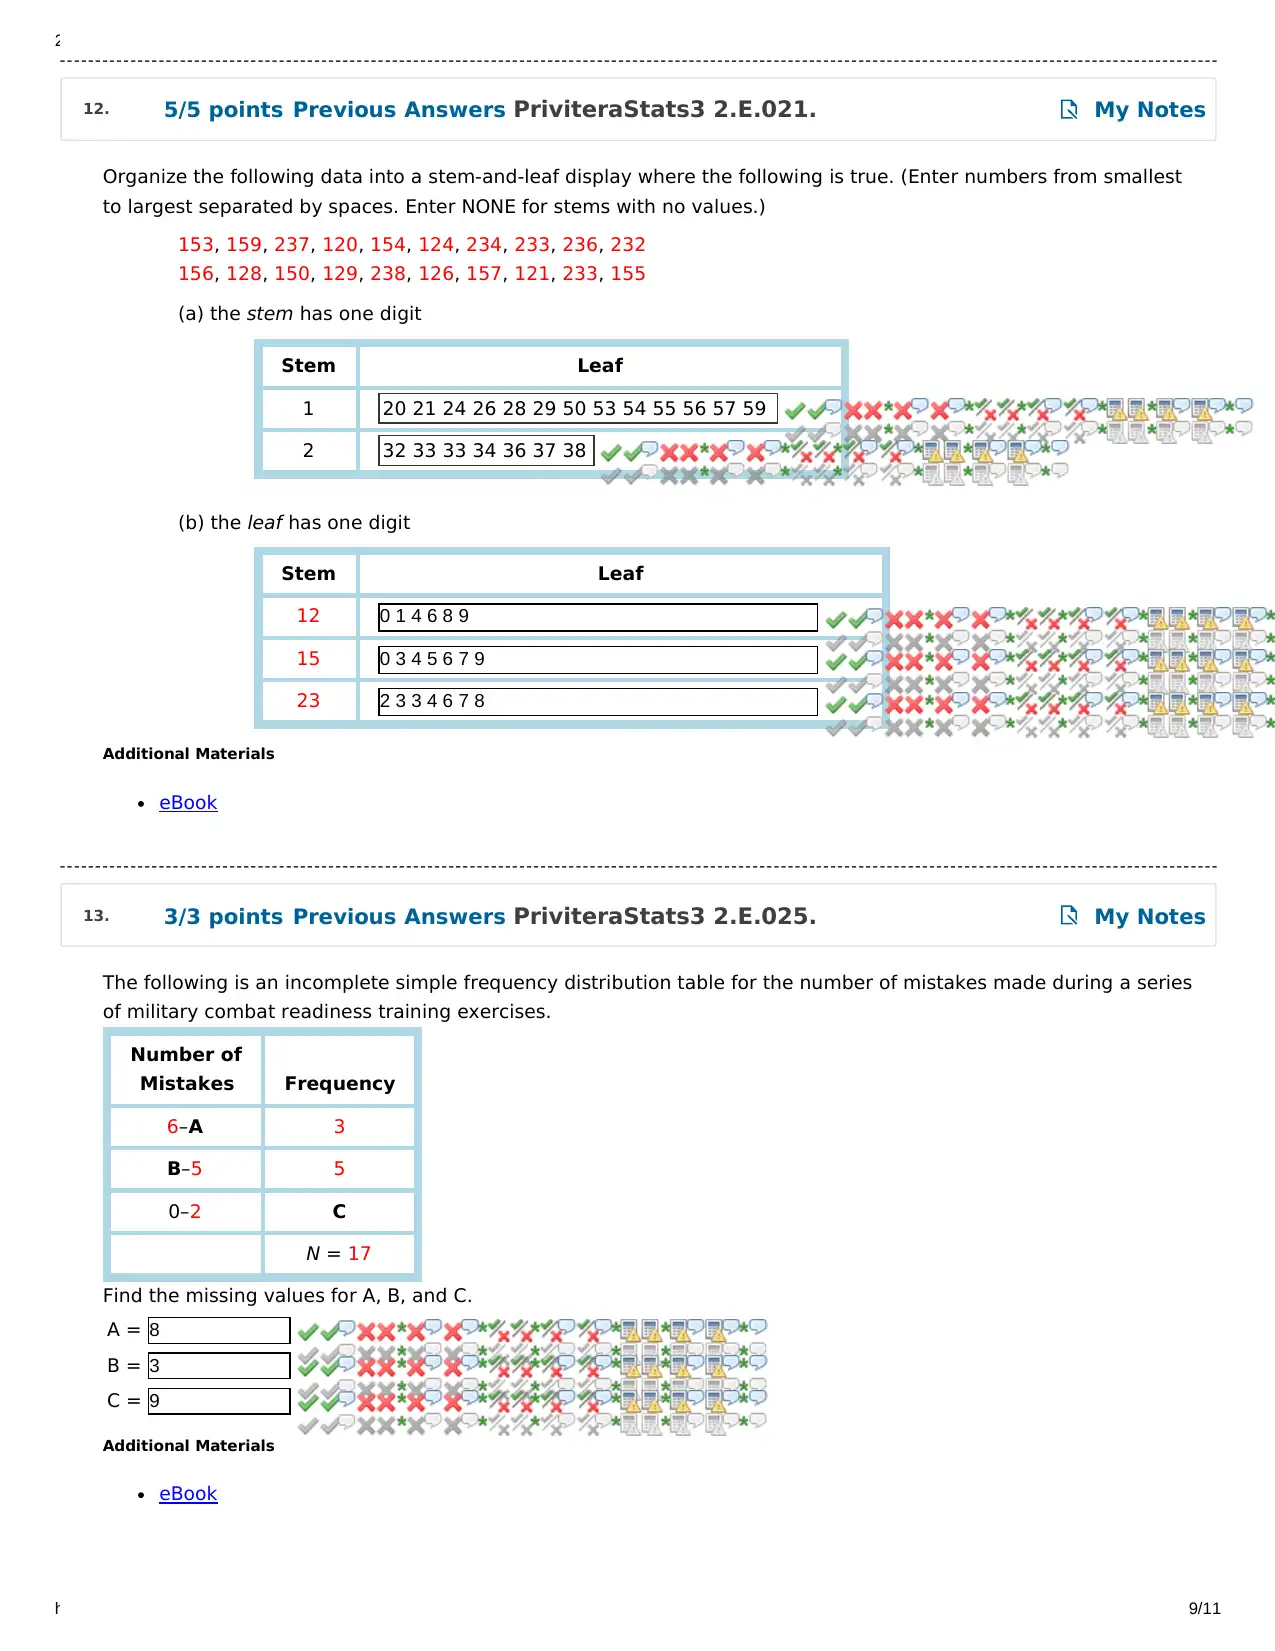
Organize the following data into a stem-and-leaf display where the following is true. (Enter numbers from smallest
to largest separated by spaces. Enter NONE for stems with no values.)
153, 159, 237, 120, 154, 124, 234, 233, 236, 232
156, 128, 150, 129, 238, 126, 157, 121, 233, 155
(a) the stem has one digit
Stem Leaf
1 20 21 24 26 28 29 50 53 54 55 56 57 59
2 32 33 33 34 36 37 38
(b) the leaf has one digit
Stem Leaf
12 0 1 4 6 8 9
15 0 3 4 5 6 7 9
23 2 3 3 4 6 7 8
Additional Materials
eBook
The following is an incomplete simple frequency distribution table for the number of mistakes made during a series
of military combat readiness training exercises.
Number of
Mistakes Frequency
6–A 3
B–5 5
0–2 C
N = 17
Find the missing values for A, B, and C.
A = 8
B = 3
C = 9
Additional Materials
eBook
12. 5/5 points Previous Answers PriviteraStats3 2.E.021. My Notes
13. 3/3 points Previous Answers PriviteraStats3 2.E.025. My Notes
https://www.webassign.net/web/Student/Assignment-Responses/submit?dep=23286304&tags=autosave 9/11
Organize the following data into a stem-and-leaf display where the following is true. (Enter numbers from smallest
to largest separated by spaces. Enter NONE for stems with no values.)
153, 159, 237, 120, 154, 124, 234, 233, 236, 232
156, 128, 150, 129, 238, 126, 157, 121, 233, 155
(a) the stem has one digit
Stem Leaf
1 20 21 24 26 28 29 50 53 54 55 56 57 59
2 32 33 33 34 36 37 38
(b) the leaf has one digit
Stem Leaf
12 0 1 4 6 8 9
15 0 3 4 5 6 7 9
23 2 3 3 4 6 7 8
Additional Materials
eBook
The following is an incomplete simple frequency distribution table for the number of mistakes made during a series
of military combat readiness training exercises.
Number of
Mistakes Frequency
6–A 3
B–5 5
0–2 C
N = 17
Find the missing values for A, B, and C.
A = 8
B = 3
C = 9
Additional Materials
eBook
12. 5/5 points Previous Answers PriviteraStats3 2.E.021. My Notes
13. 3/3 points Previous Answers PriviteraStats3 2.E.025. My Notes
⊘ This is a preview!⊘
Do you want full access?
Subscribe today to unlock all pages.
Trusted by 1+ million students worldwide
2/5/2020 Topic One Homework - PSY-380, section LS02/03/20, Spring 2020 | WebAssign
https://www.webassign.net/web/Student/Assignment-Responses/submit?dep=23286304&tags=autosave 10/11
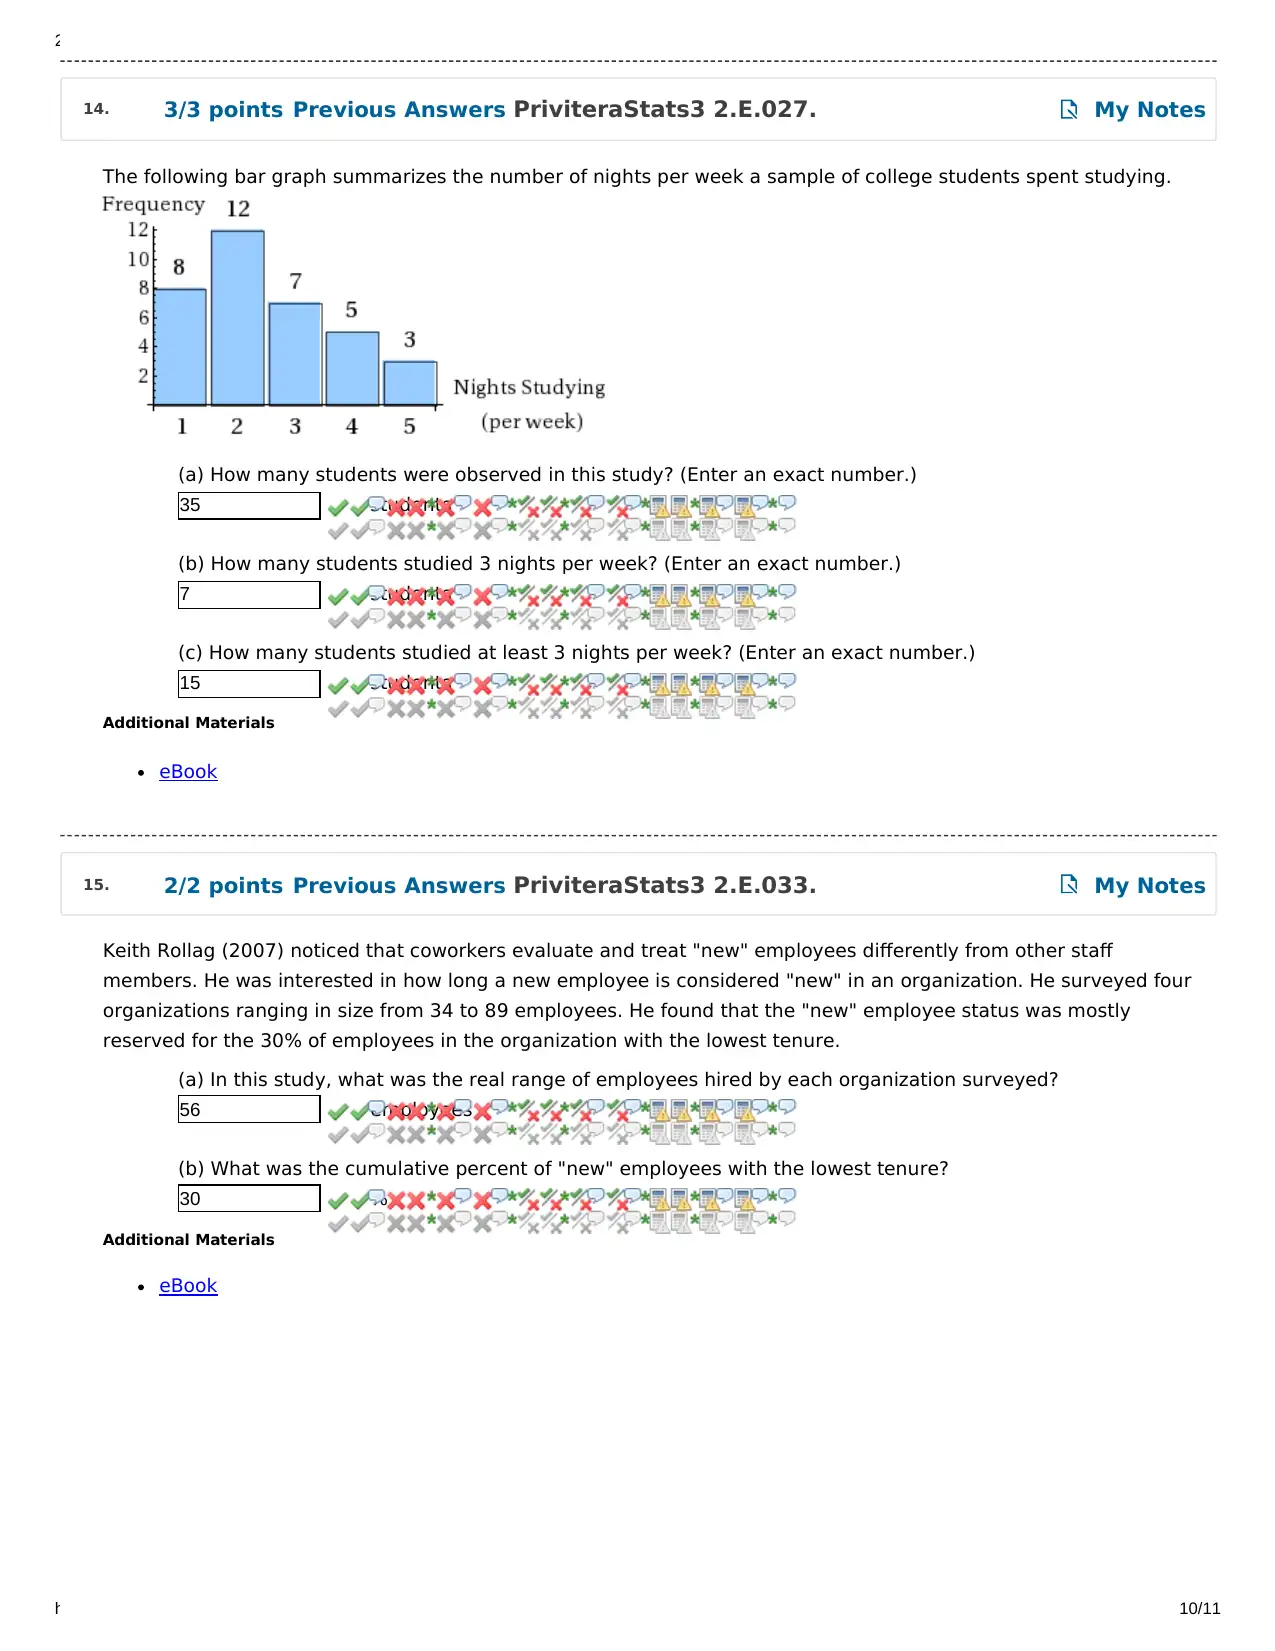
The following bar graph summarizes the number of nights per week a sample of college students spent studying.
(a) How many students were observed in this study? (Enter an exact number.)
35 students
(b) How many students studied 3 nights per week? (Enter an exact number.)
7 students
(c) How many students studied at least 3 nights per week? (Enter an exact number.)
15 students
Additional Materials
eBook
Keith Rollag (2007) noticed that coworkers evaluate and treat "new" employees differently from other staff
members. He was interested in how long a new employee is considered "new" in an organization. He surveyed four
organizations ranging in size from 34 to 89 employees. He found that the "new" employee status was mostly
reserved for the 30% of employees in the organization with the lowest tenure.
(a) In this study, what was the real range of employees hired by each organization surveyed?
56 employees
(b) What was the cumulative percent of "new" employees with the lowest tenure?
30 %
Additional Materials
eBook
14. 3/3 points Previous Answers PriviteraStats3 2.E.027. My Notes
15. 2/2 points Previous Answers PriviteraStats3 2.E.033. My Notes
https://www.webassign.net/web/Student/Assignment-Responses/submit?dep=23286304&tags=autosave 10/11
The following bar graph summarizes the number of nights per week a sample of college students spent studying.
(a) How many students were observed in this study? (Enter an exact number.)
35 students
(b) How many students studied 3 nights per week? (Enter an exact number.)
7 students
(c) How many students studied at least 3 nights per week? (Enter an exact number.)
15 students
Additional Materials
eBook
Keith Rollag (2007) noticed that coworkers evaluate and treat "new" employees differently from other staff
members. He was interested in how long a new employee is considered "new" in an organization. He surveyed four
organizations ranging in size from 34 to 89 employees. He found that the "new" employee status was mostly
reserved for the 30% of employees in the organization with the lowest tenure.
(a) In this study, what was the real range of employees hired by each organization surveyed?
56 employees
(b) What was the cumulative percent of "new" employees with the lowest tenure?
30 %
Additional Materials
eBook
14. 3/3 points Previous Answers PriviteraStats3 2.E.027. My Notes
15. 2/2 points Previous Answers PriviteraStats3 2.E.033. My Notes
Paraphrase This Document
Need a fresh take? Get an instant paraphrase of this document with our AI Paraphraser
2/5/2020 Topic One Homework - PSY-380, section LS02/03/20, Spring 2020 | WebAssign
https://www.webassign.net/web/Student/Assignment-Responses/submit?dep=23286304&tags=autosave 11/11
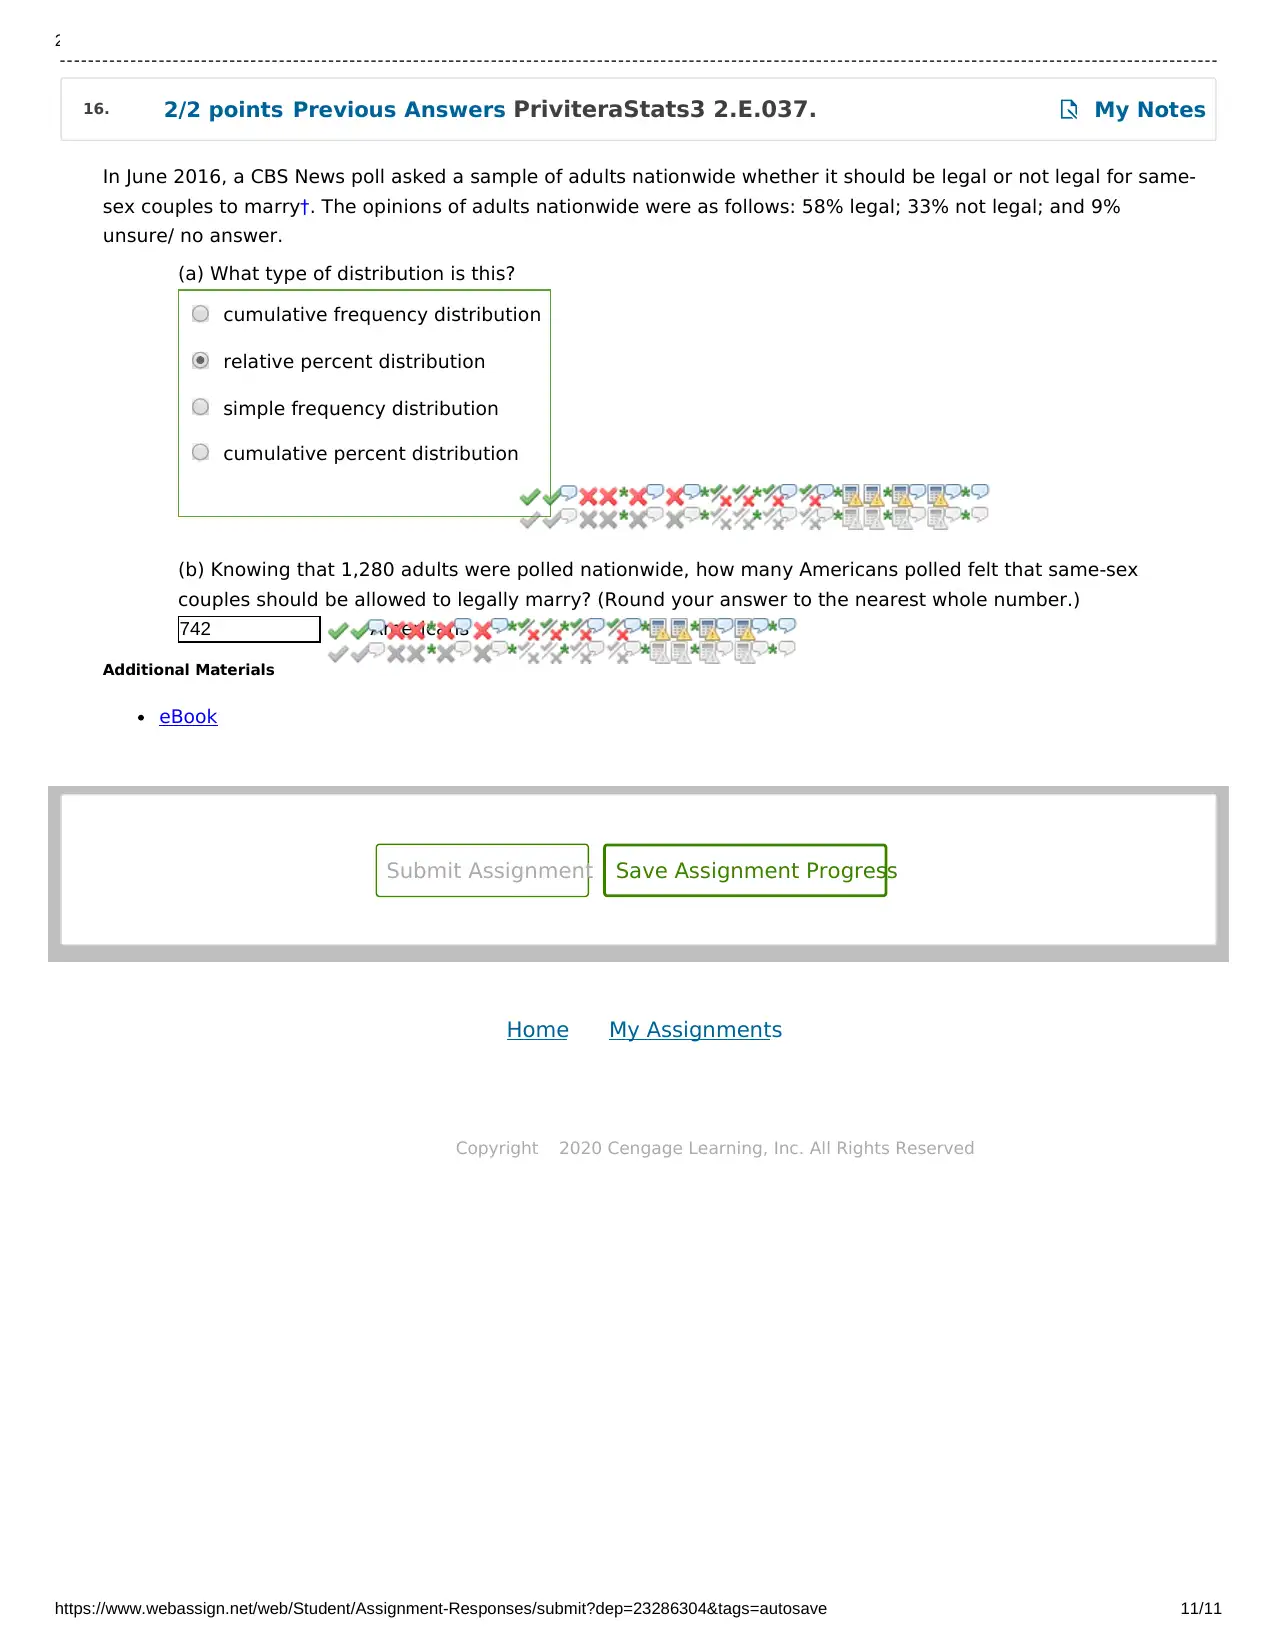
In June 2016, a CBS News poll asked a sample of adults nationwide whether it should be legal or not legal for same-
sex couples to marry†. The opinions of adults nationwide were as follows: 58% legal; 33% not legal; and 9%
unsure/ no answer.
(a) What type of distribution is this?
(b) Knowing that 1,280 adults were polled nationwide, how many Americans polled felt that same-sex
couples should be allowed to legally marry? (Round your answer to the nearest whole number.)
742 Americans
Additional Materials
eBook
Home My Assignments
Copyright 2020 Cengage Learning, Inc. All Rights Reserved
cumulative frequency distribution
relative percent distribution
simple frequency distribution
cumulative percent distribution
Submit Assignment Save Assignment Progress
16. 2/2 points Previous Answers PriviteraStats3 2.E.037. My Notes
https://www.webassign.net/web/Student/Assignment-Responses/submit?dep=23286304&tags=autosave 11/11
In June 2016, a CBS News poll asked a sample of adults nationwide whether it should be legal or not legal for same-
sex couples to marry†. The opinions of adults nationwide were as follows: 58% legal; 33% not legal; and 9%
unsure/ no answer.
(a) What type of distribution is this?
(b) Knowing that 1,280 adults were polled nationwide, how many Americans polled felt that same-sex
couples should be allowed to legally marry? (Round your answer to the nearest whole number.)
742 Americans
Additional Materials
eBook
Home My Assignments
Copyright 2020 Cengage Learning, Inc. All Rights Reserved
cumulative frequency distribution
relative percent distribution
simple frequency distribution
cumulative percent distribution
Submit Assignment Save Assignment Progress
16. 2/2 points Previous Answers PriviteraStats3 2.E.037. My Notes
1 out of 11


Your All-in-One AI-Powered Toolkit for Academic Success.
+13062052269
info@desklib.com
Available 24*7 on WhatsApp / Email
![[object Object]](/_next/static/media/star-bottom.7253800d.svg)
Unlock your academic potential
Copyright © 2020–2026 A2Z Services. All Rights Reserved. Developed and managed by ZUCOL.