Graphical Analysis and Business Decisions: A Food Production Firm

Verified

Added on  2023/04/23

|8
|599
|368
Report
AI Summary
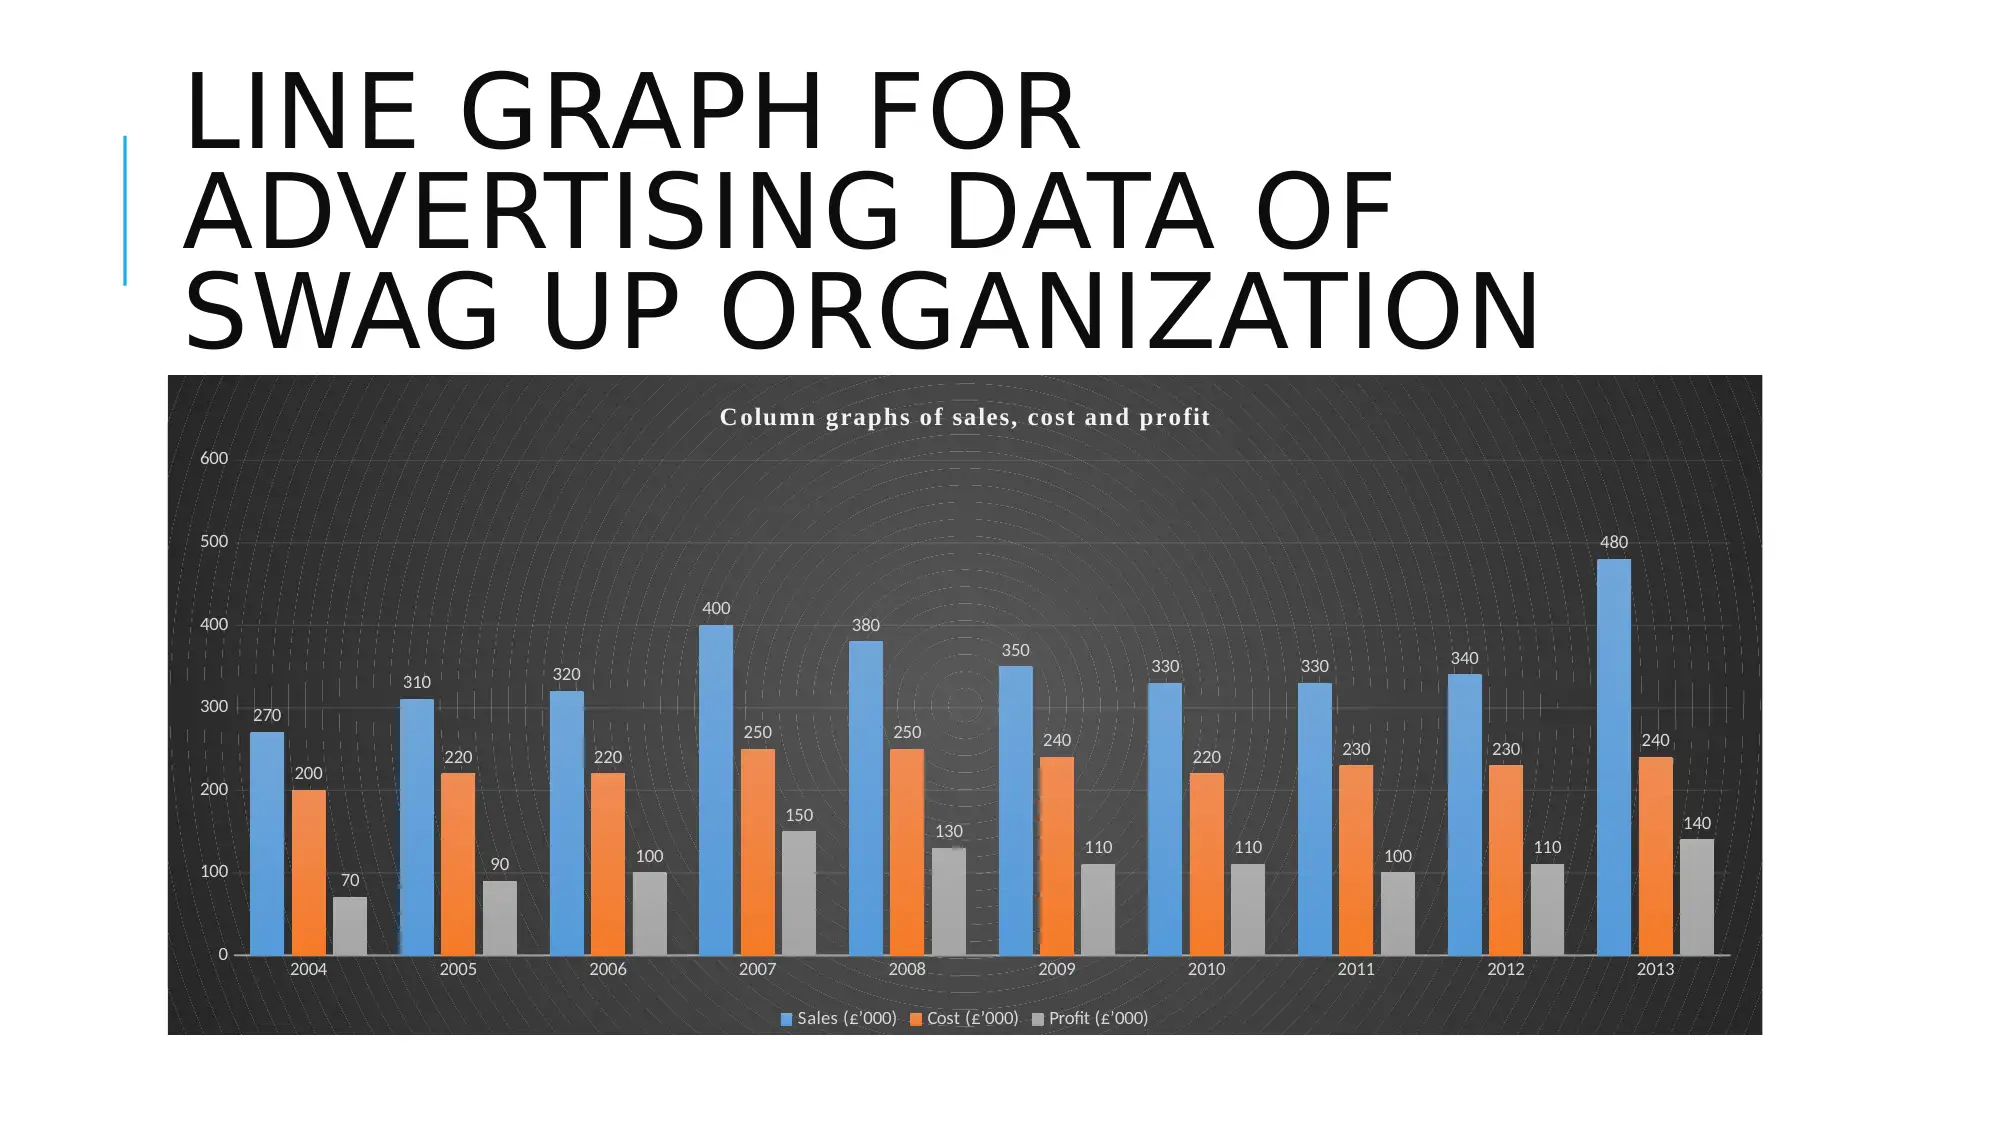
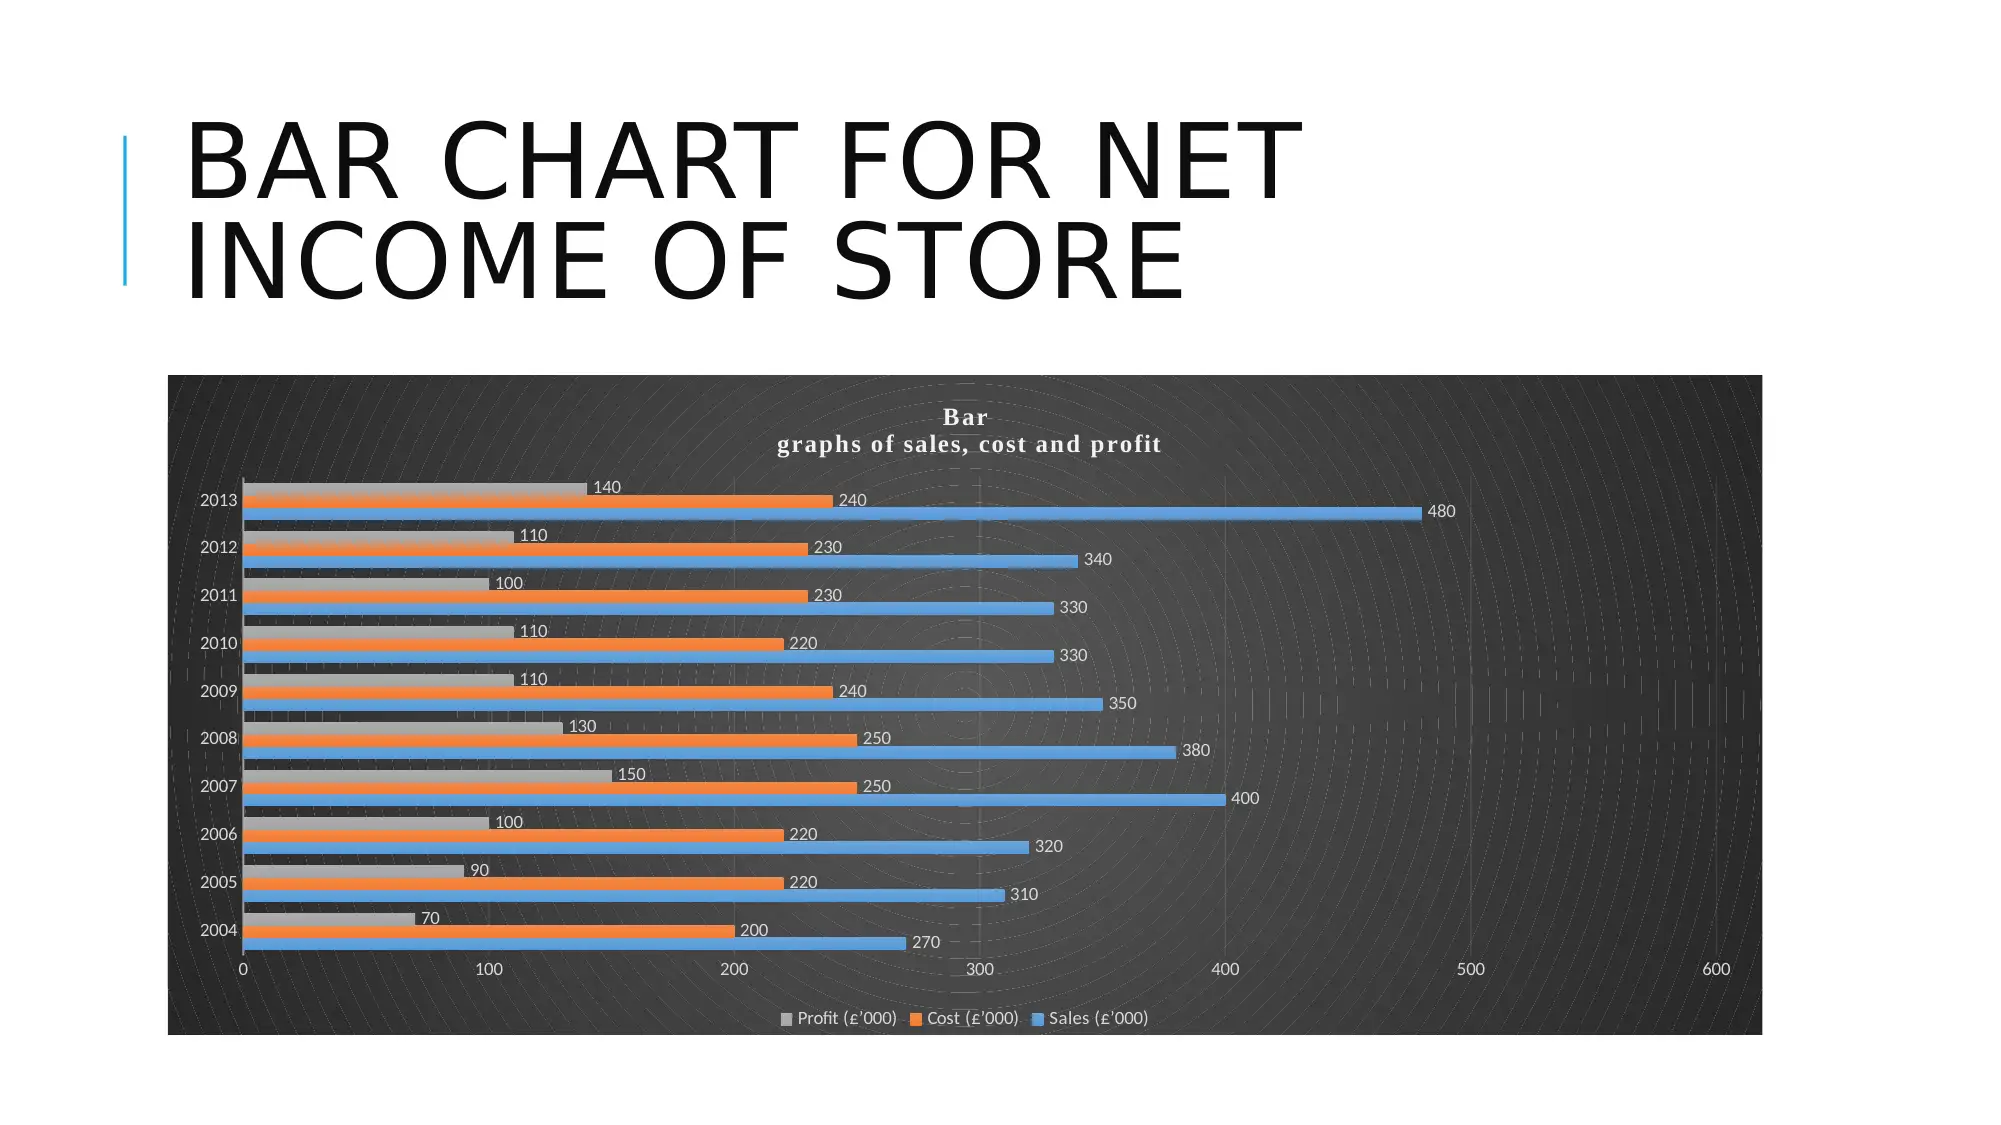
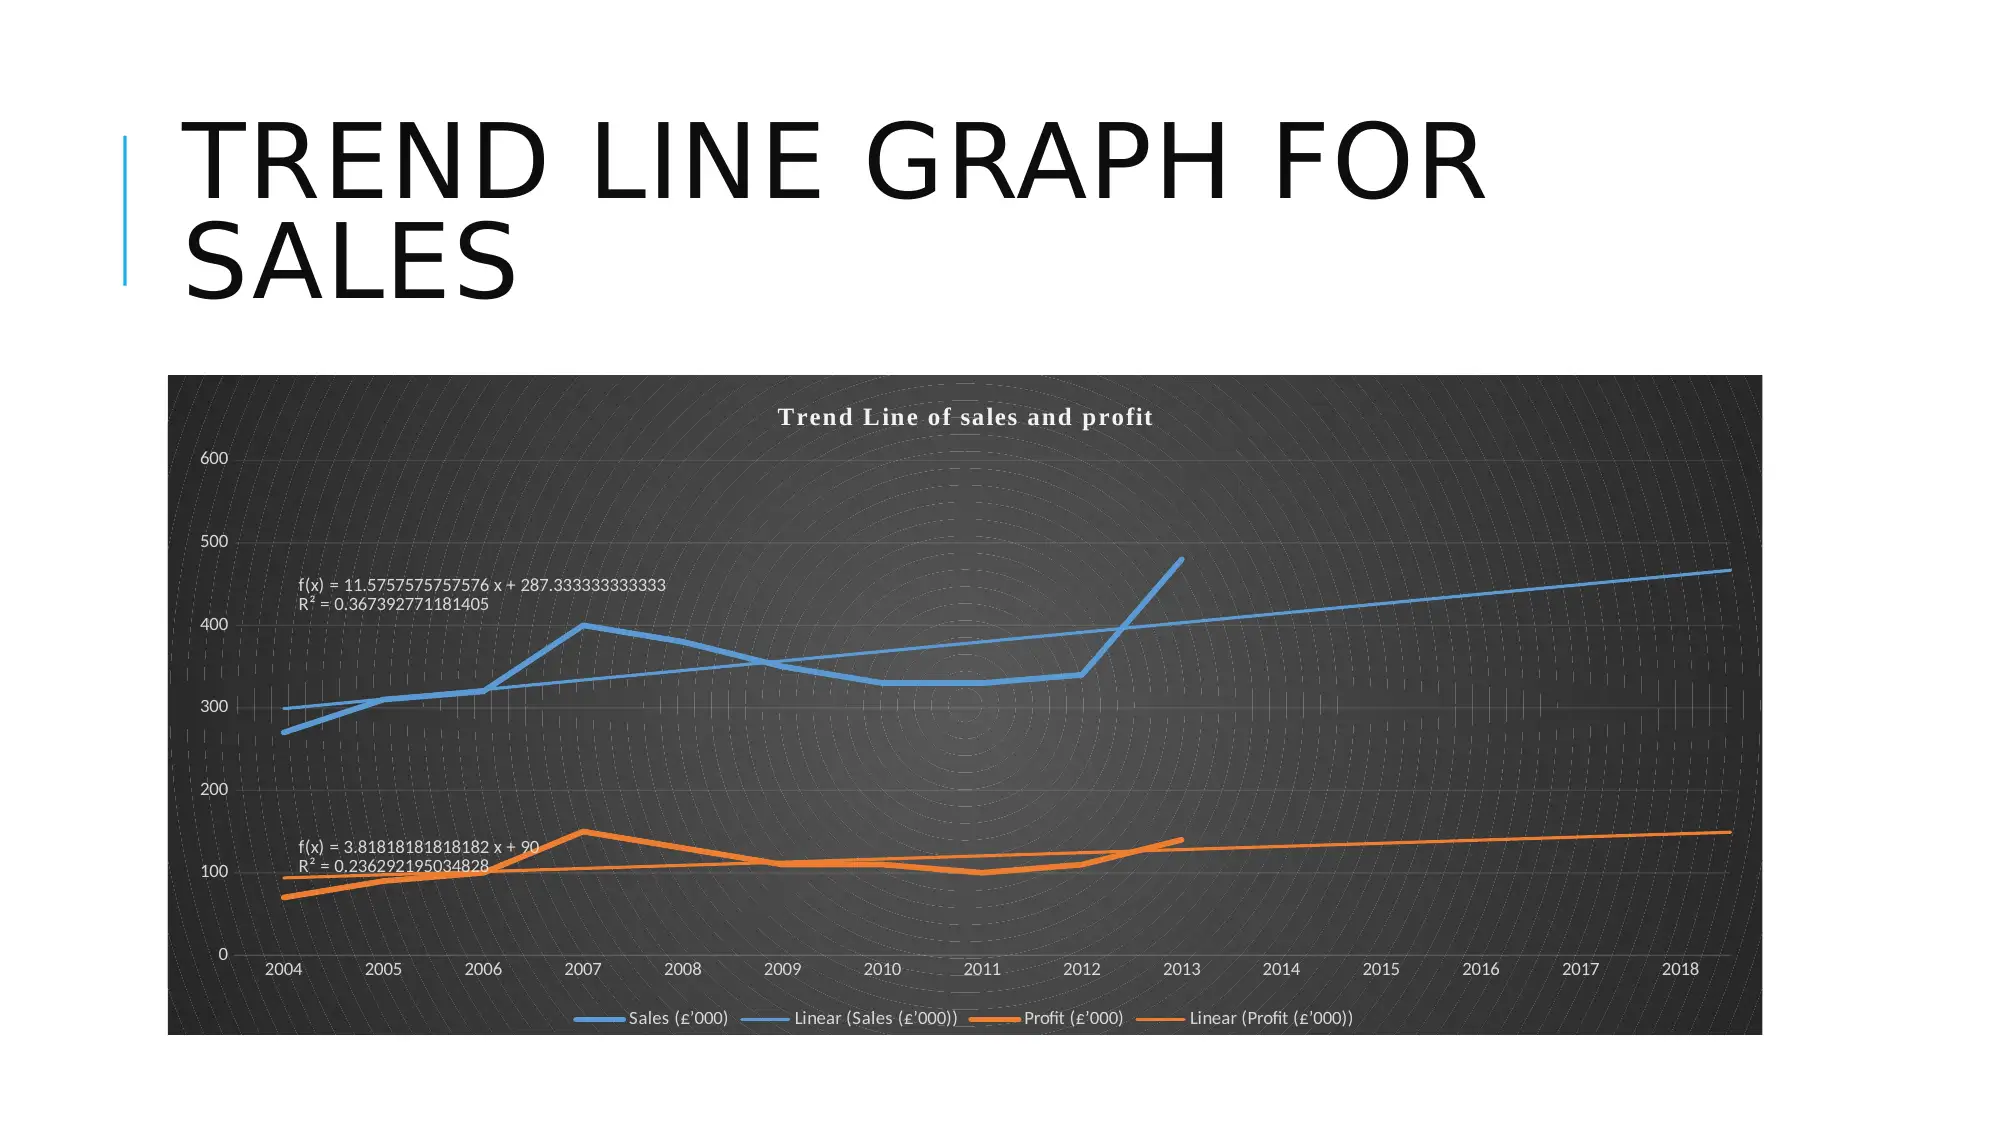
This report focuses on the application of graphical analysis in the business decision-making process for a small food production company. It highlights the importance of financial analysis, including sales, cost, and profit analysis, to support business expansion decisions, specifically regarding a canteen project at FSB college. The report uses line graphs, column graphs, and trend lines to visually represent the company's financial data from 2004 to 2013, providing insights into sales trends, cost management, and profitability. The analysis concludes that the company's strong financial position, indicated by high sales and profitability, supports the decision to expand the business. Several academic references are cited to support the methodologies and conclusions presented in the report. Desklib provides students access to a wealth of resources, including past papers and solved assignments.
Document Page
BUSINESS DECISION
MAKING
Graphical presentation
small food production
company
tabler-icon-diamond-filled.svg

Paraphrase This Document

Need a fresh take? Get an instant paraphrase of this document with our AI Paraphraser
Document Page
INTRODUCTION
Decision making process is one of the major
function for companies.
Graphical analysis is major tool for analyzing the
financial performance of company.
Small food production firm requires to expand its
business by investing canteen project of FSB
college.
Sales, profit and cost analysis of this organization
will help in business decision making process.
Document Page
LINE GRAPH FOR
ADVERTISING DATA OF
SWAG UP ORGANIZATION
2004 2005 2006 2007 2008 2009 2010 2011 2012 2013
0
100
200
300
400
500
600
270
310 320
400 380
350 330 330 340
480
200 220 220
250 250 240 220 230 230 240
70 90 100
150 130 110 110 100 110
140
C olumn graphs of sales, cost and profit
Sales (£’000) Cost (£’000) Profit (£’000)
Document Page
BAR CHART FOR NET
INCOME OF STORE
2004
2005
2006
2007
2008
2009
2010
2011
2012
2013
0 100 200 300 400 500 600
270
310
320
400
380
350
330
330
340
480
200
220
220
250
250
240
220
230
230
240
70
90
100
150
130
110
110
100
110
140
Bar
graphs of sales, cost and profit
Profit (£’000) Cost (£’000) Sales (£’000)
tabler-icon-diamond-filled.svg

Paraphrase This Document

Need a fresh take? Get an instant paraphrase of this document with our AI Paraphraser
Document Page
TREND LINE GRAPH FOR
SALES
2004 2005 2006 2007 2008 2009 2010 2011 2012 2013 2014 2015 2016 2017 2018
0
100
200
300
400
500
600
f(x) = 11.5757575757576 x + 287.333333333333
R² = 0.367392771181405
f(x) = 3.81818181818182 x + 90
R² = 0.236292195034828
Trend Line of sales and profit
Sales (£’000) Linear (Sales (£’000)) Profit (£’000) Linear (Profit (£’000))
Document Page
CONCLUSION
As per the analysis of financial
information small food production firm it
has reflected that company has strong
financial position in the market because
of high sales and profitability. So, due to
strong financial position in the market.
organization can take the decision of
business expansion..
Document Page
REFERENCE
Little, B., 2011. The principles of successful project management: It takes careful
planning, skilful leadership … and a little bit of luck. Human Resource Management
International Digest. 19(7). pp.36 – 39.
Newbold, P. and et. al. 2009. Statistics for Business and Economics. Pearson Education
Prieto, M. A. and Revilla, E., 2006. Learning capability and business performance: a non-
financial and financial assessment. Learning Organization. 13(2). pp.166 – 185.
Smith, C. D., Bruyns, and Evans, S. M., 2011. A project manager's optimism and stress
management and IT project success. International Journal of Managing Projects in
Business. 4(1). pp.10 – 27.
Sucky, E., Aksoy, A., and Ozturk, N. 2012. A decision support system for demand
forecasting in the clothing industry. International Journal of Clothing Science and
Technology. 24(4). pp.221 – 236.
Wallnöfer, M., and Hacklin, F. 2012. The business model in the practice of strategic
decision making: insights from a case study. Management Decision. 50(2). pp.166 – 188.
tabler-icon-diamond-filled.svg

Paraphrase This Document

Need a fresh take? Get an instant paraphrase of this document with our AI Paraphraser
Document Page
THANK
YOU
chevron_up_icon
1 out of 8
circle_padding
hide_on_mobile
zoom_out_icon
[object Object]