Business Decision Making: Sales Data Graphical Analysis Report
VerifiedAdded on 2023/04/22
|10
|564
|119
Report
AI Summary
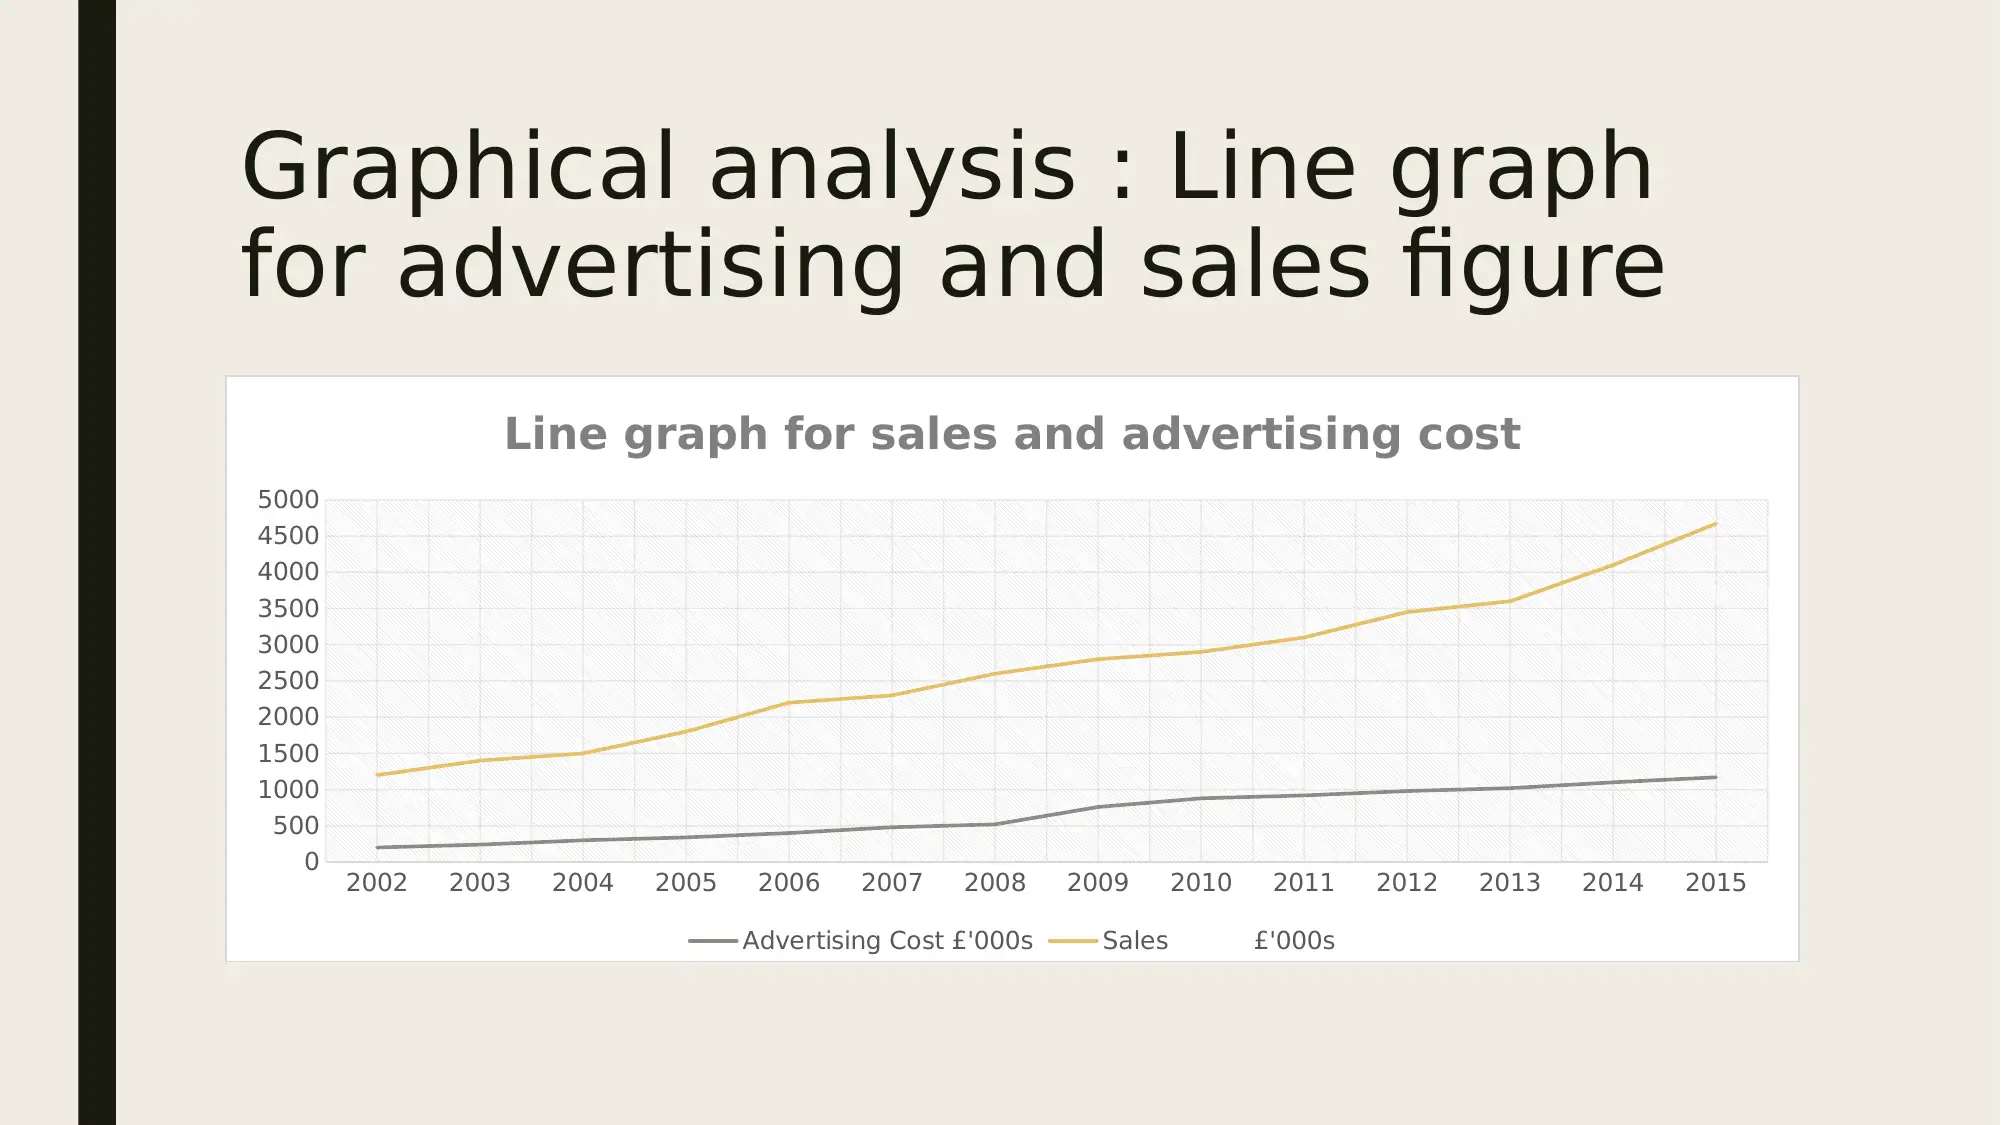
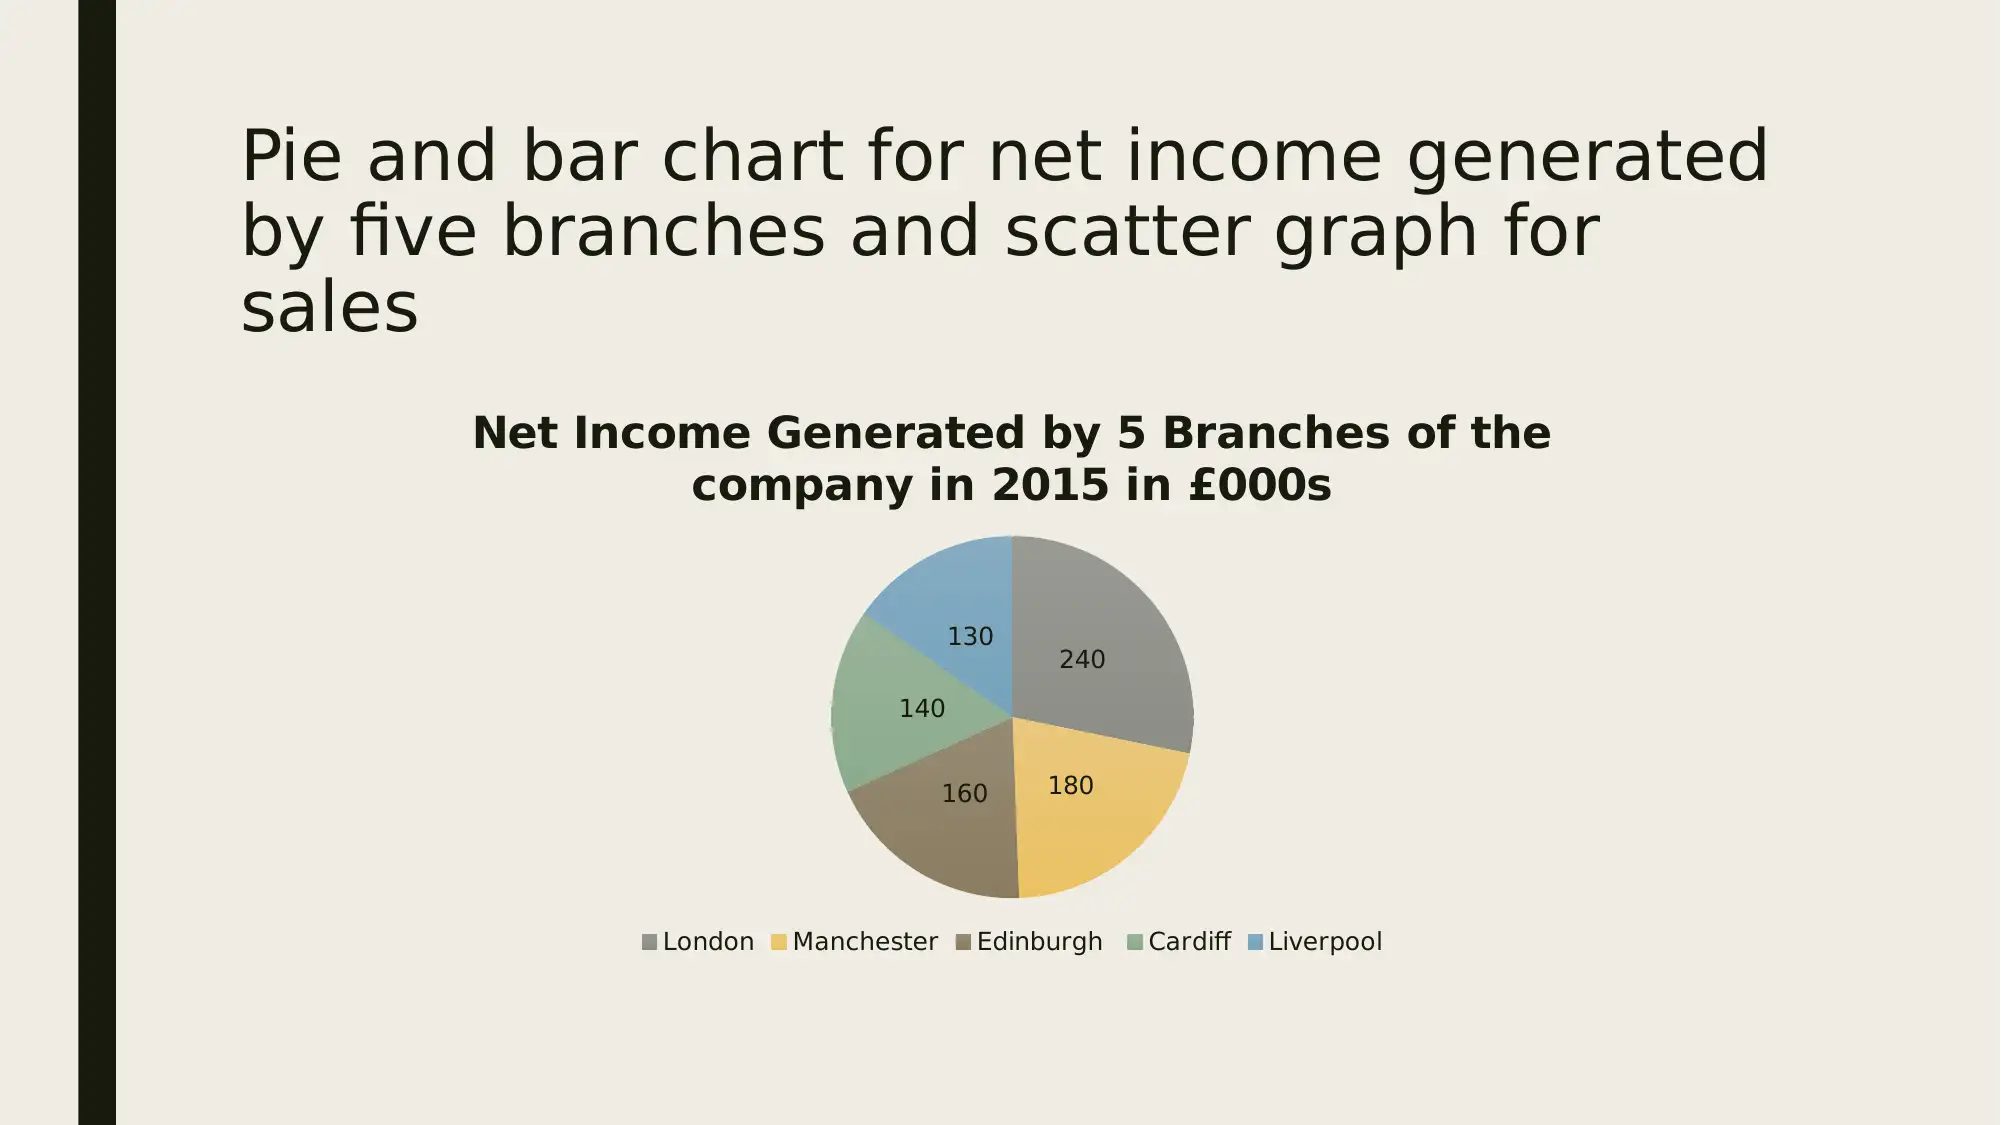
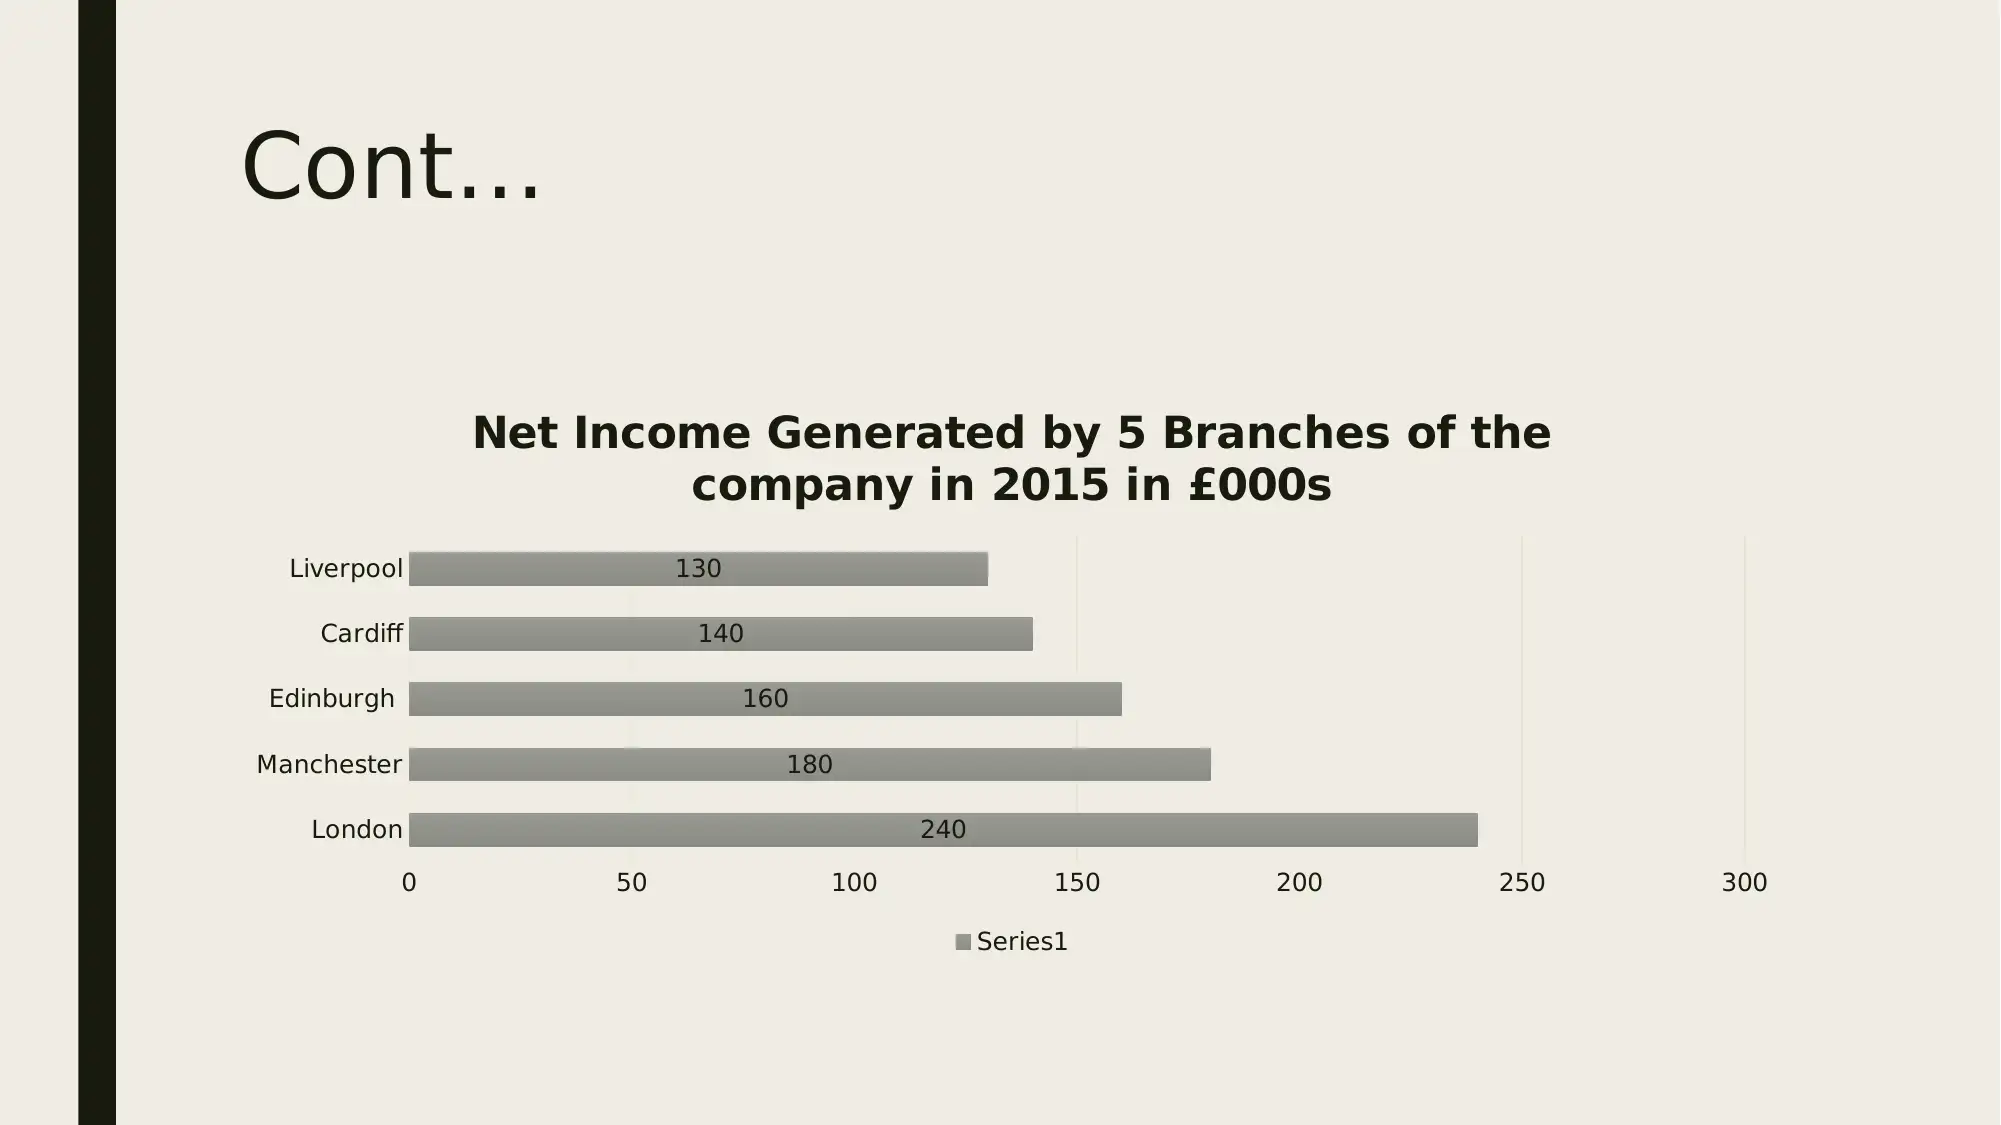
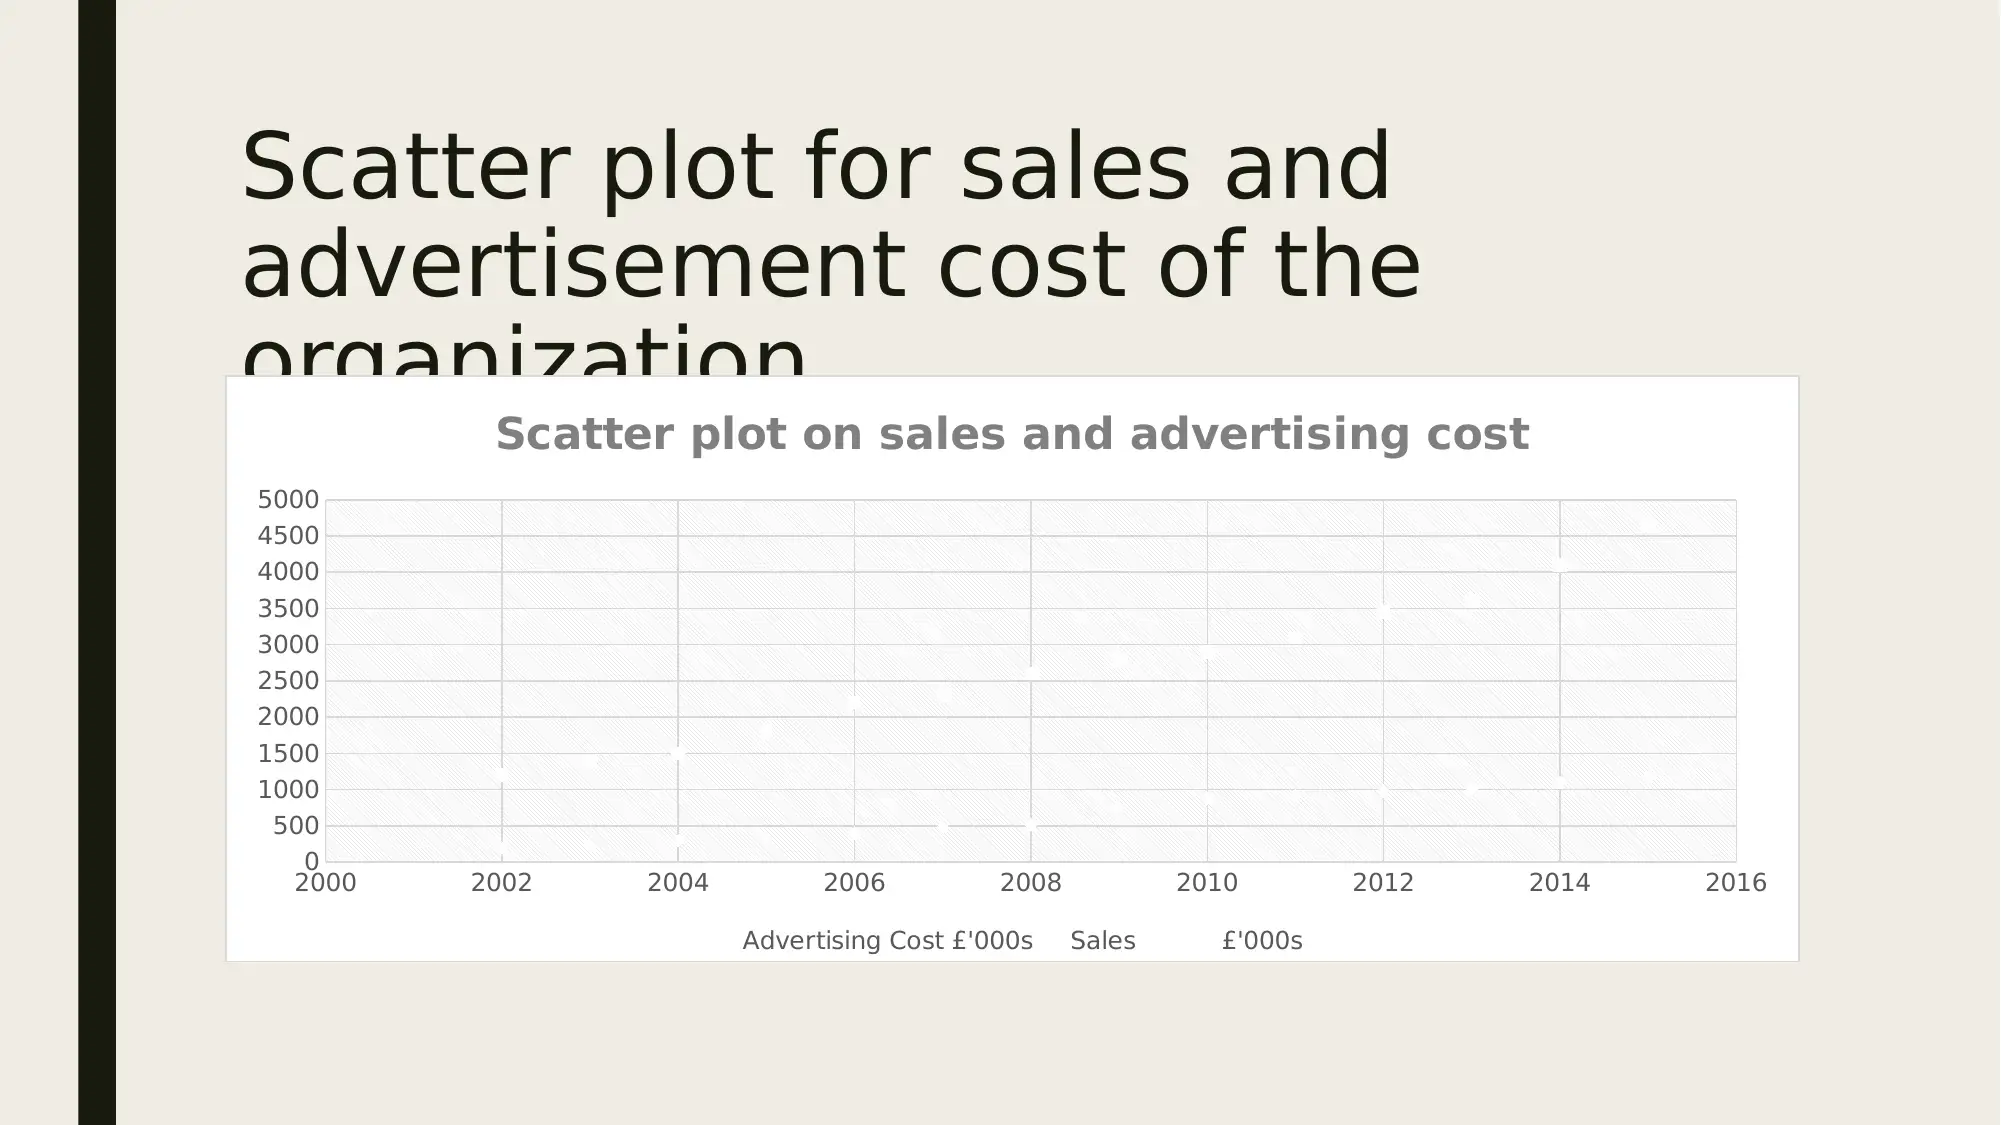
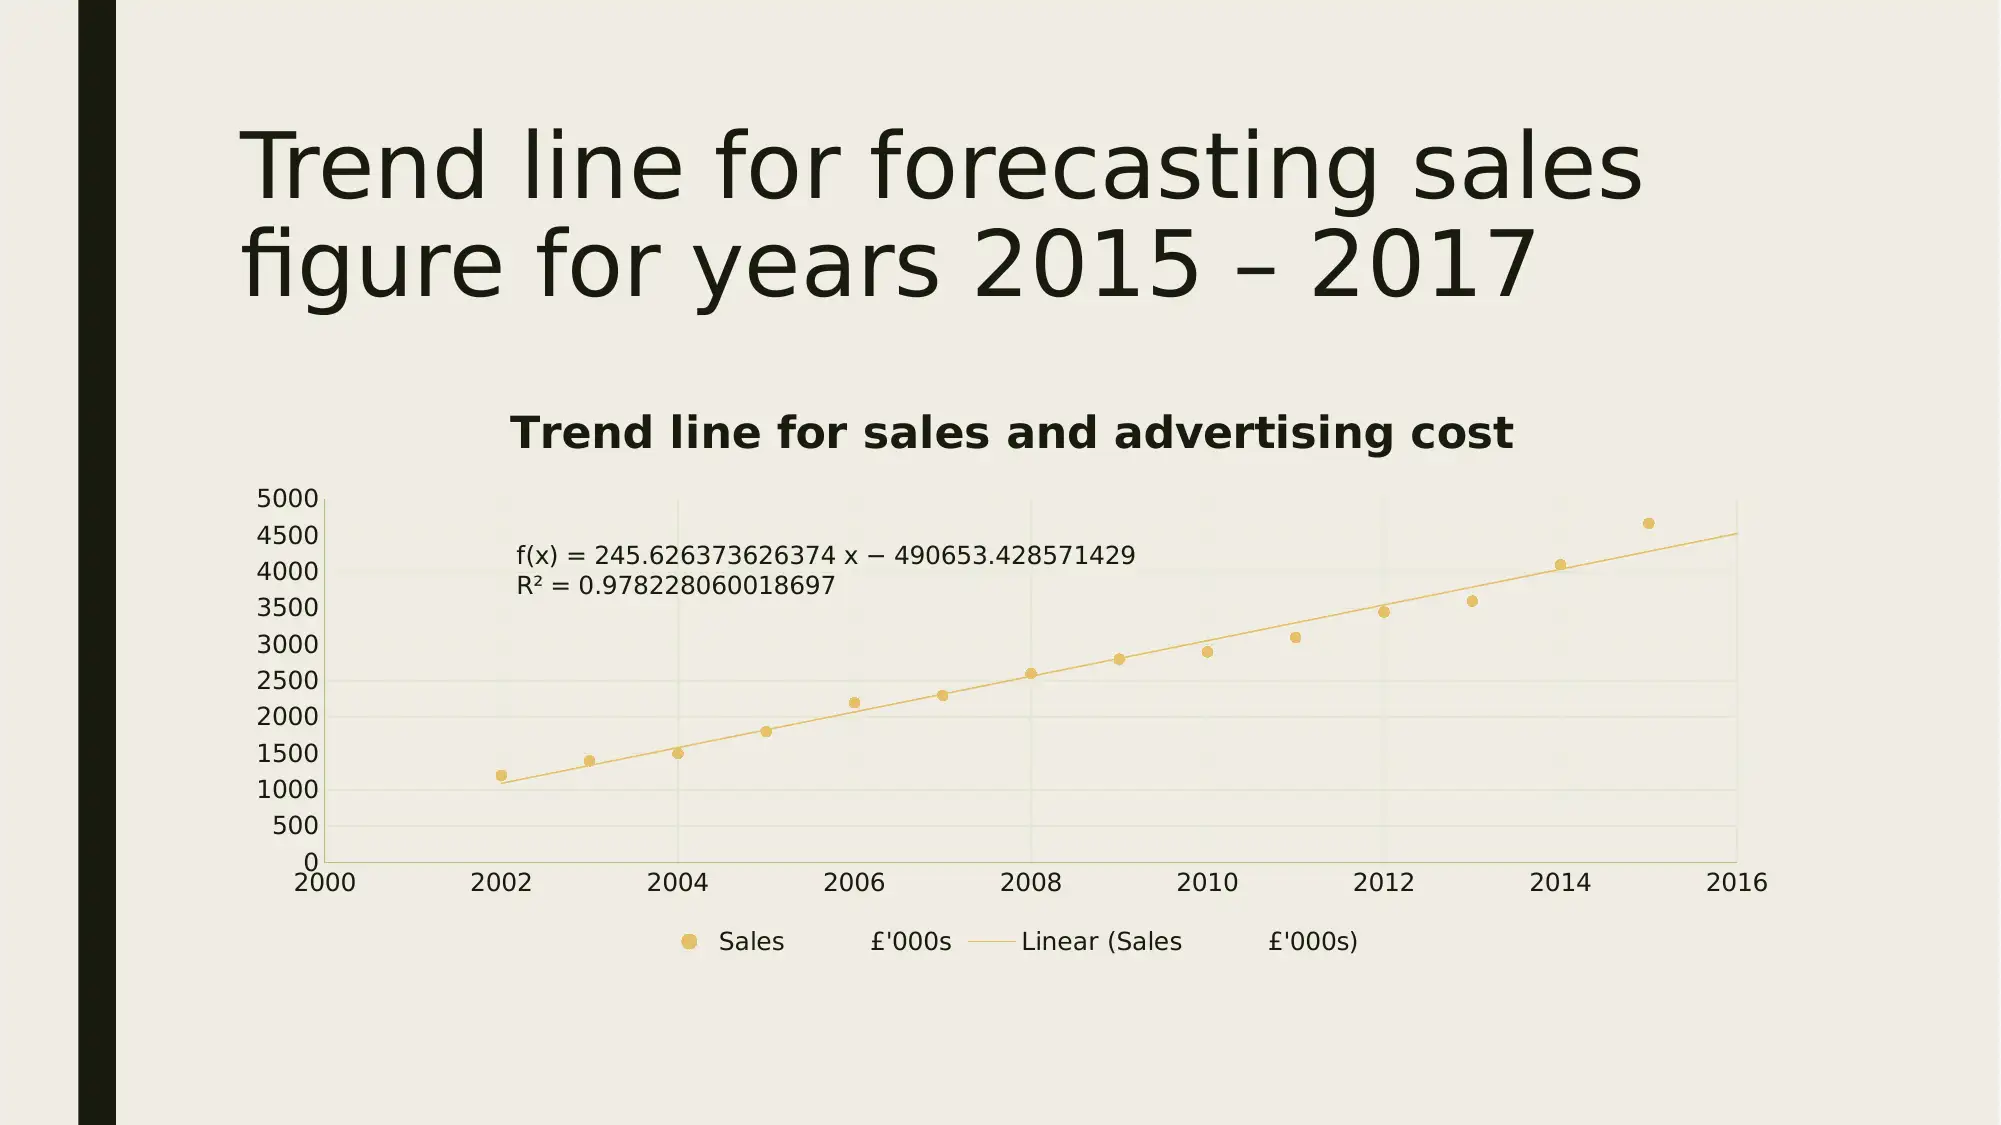
This report presents a graphical analysis of sales and advertising data to inform business decisions. It uses line graphs to illustrate advertising costs and sales figures over time, pie and bar charts to compare net income generated by different branches, and scatter plots to examine the relationship between sales and advertising costs. Trend lines are employed to forecast future sales figures for the years 2015-2017. The analysis reveals a consistent increase in sales, significant investment in advertising and marketing, and effective cost management. The conclusion emphasizes the company's strong sales performance and suggests reinvesting income to further increase sales, expanding business operations while controlling marketing and advertising costs, and adopting strategies to enhance future profitability. References to academic sources are also included to support the analysis and recommendations.


1 out of 10
Related Documents


Your All-in-One AI-Powered Toolkit for Academic Success.
+13062052269
info@desklib.com
Available 24*7 on WhatsApp / Email
![[object Object]](/_next/static/media/star-bottom.7253800d.svg)
Copyright © 2020–2026 A2Z Services. All Rights Reserved. Developed and managed by ZUCOL.