Graphing Linear Equations: Table of Values, Slope, and Equations
VerifiedAdded on 2022/08/24
|9
|350
|20
Homework Assignment
AI Summary
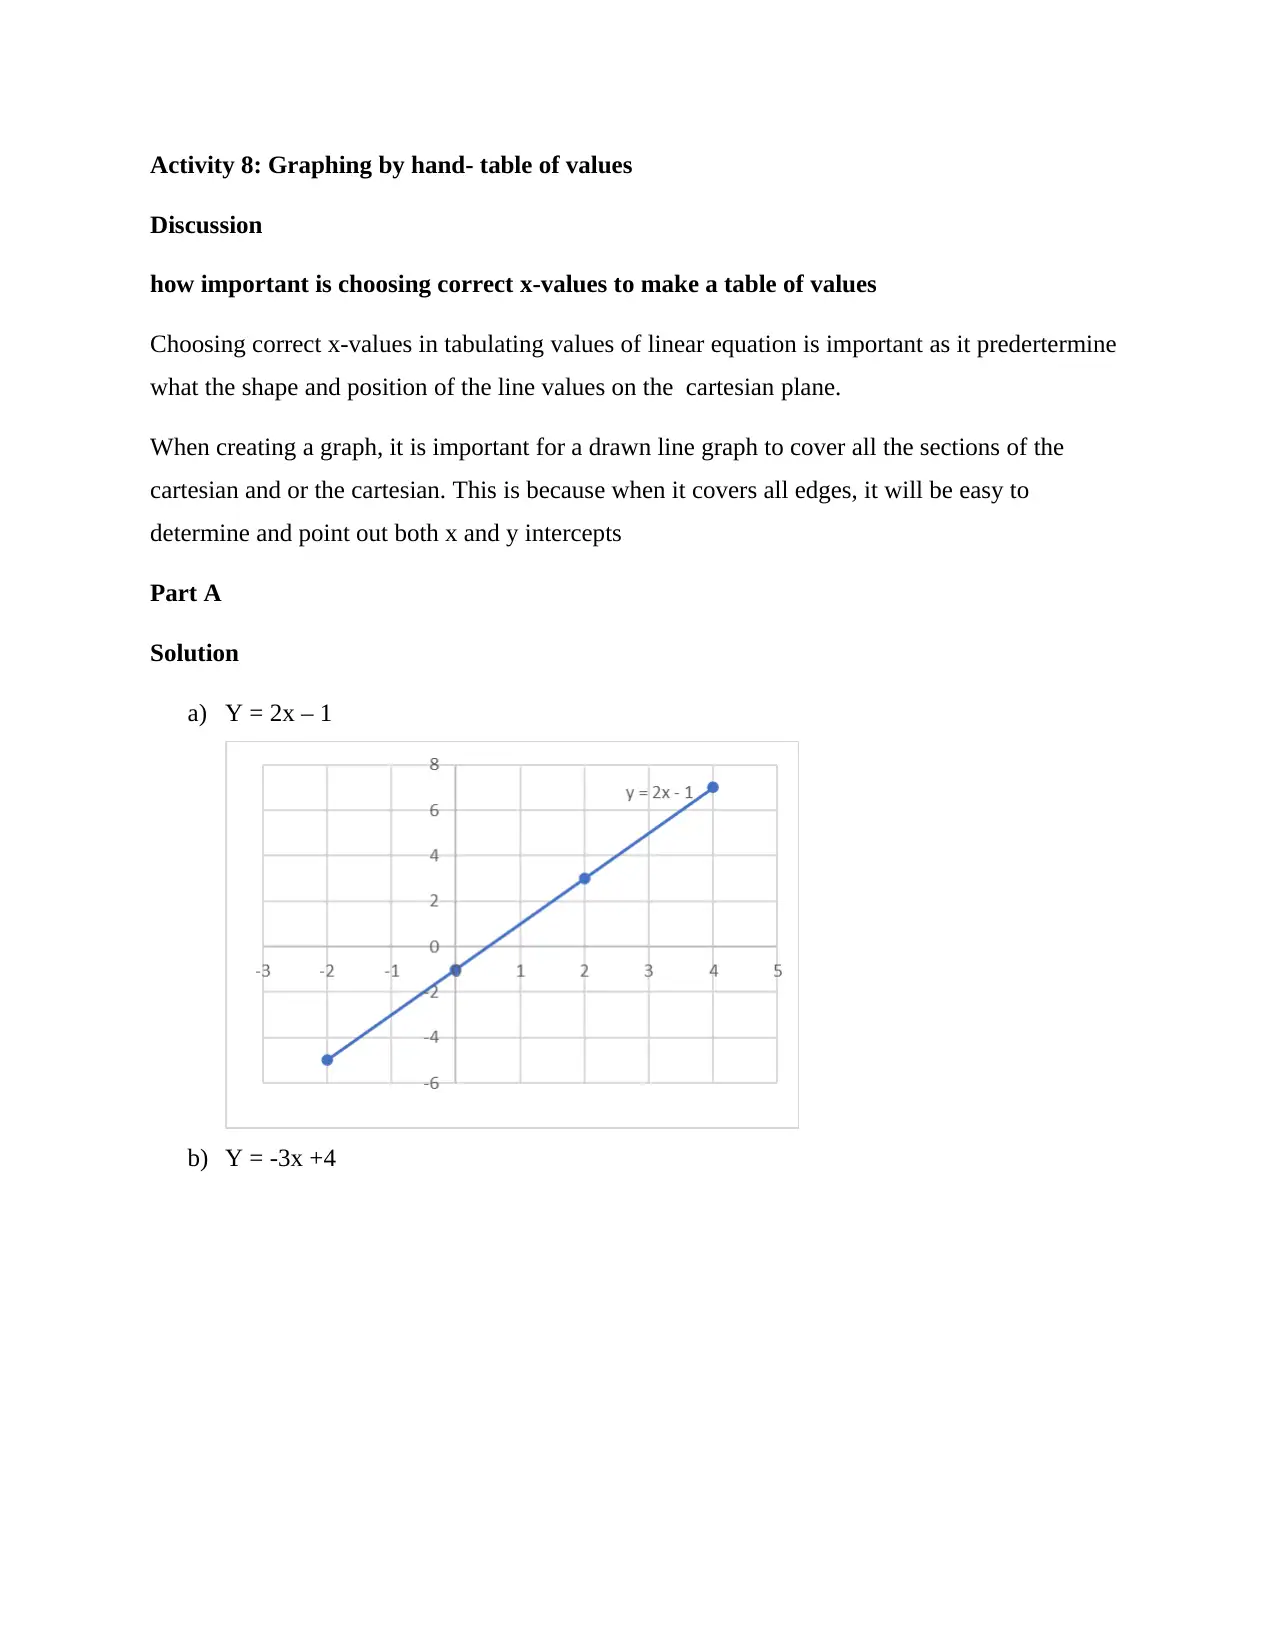
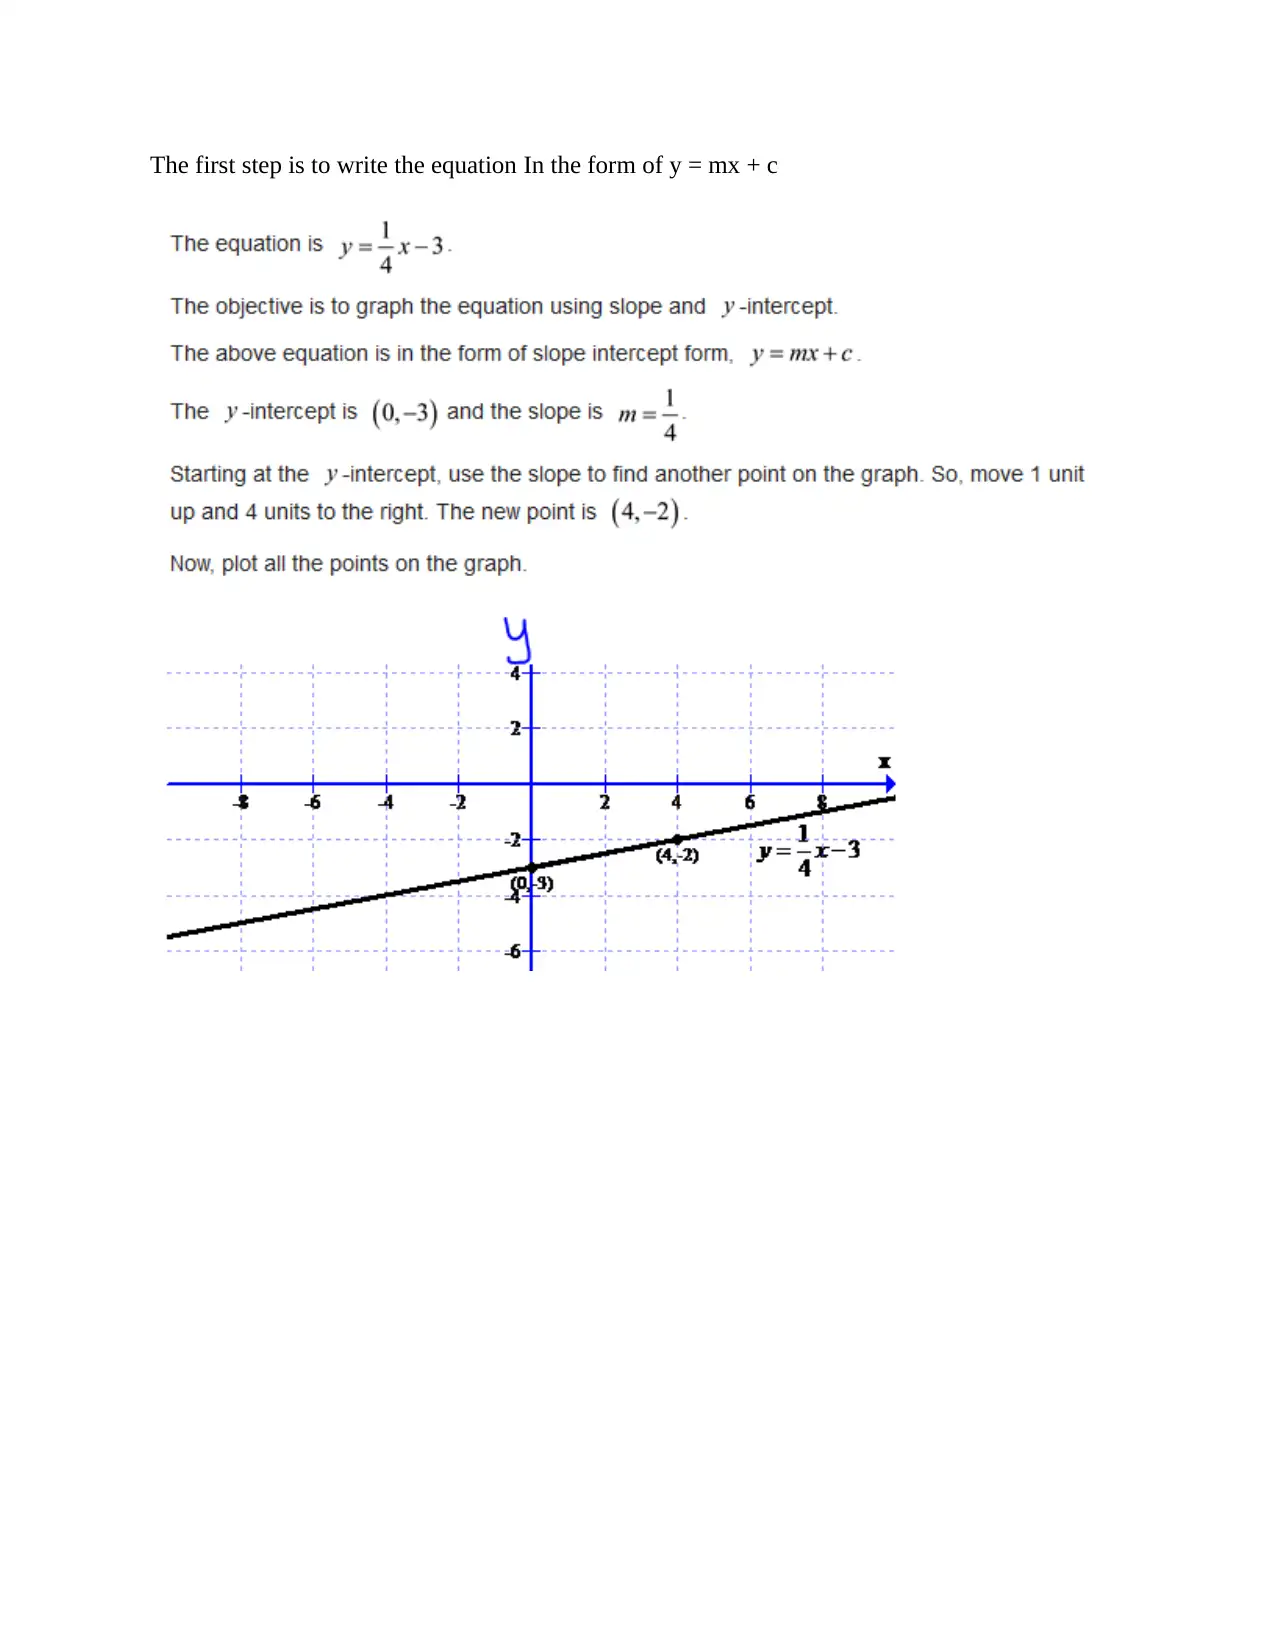
This assignment focuses on graphing linear equations using two primary methods: the table of values and the slope-intercept form. The solution begins by demonstrating how to construct a table of values to plot points and graph linear equations, emphasizing the importance of choosing appropriate x-values to accurately represent the line. Several examples are provided, each with a corresponding table and a graphical representation. The second part of the assignment delves into graphing using the slope and y-intercept method, providing detailed steps and examples to illustrate the process. The solution also includes an example of how to represent a real-world scenario, such as the cost of a lawn care service, with a linear equation and its corresponding graph. Overall, the assignment offers a comprehensive guide to graphing linear equations, suitable for students studying algebra.
1 out of 9
Related Documents


Your All-in-One AI-Powered Toolkit for Academic Success.
+13062052269
info@desklib.com
Available 24*7 on WhatsApp / Email
![[object Object]](/_next/static/media/star-bottom.7253800d.svg)
Copyright © 2020–2026 A2Z Services. All Rights Reserved. Developed and managed by ZUCOL.