Analyzing Graphs in Time Series: Advantages, Disadvantages Explored

Verified

Added on  2023/06/08

|8
|1163
|401
Report
AI Summary
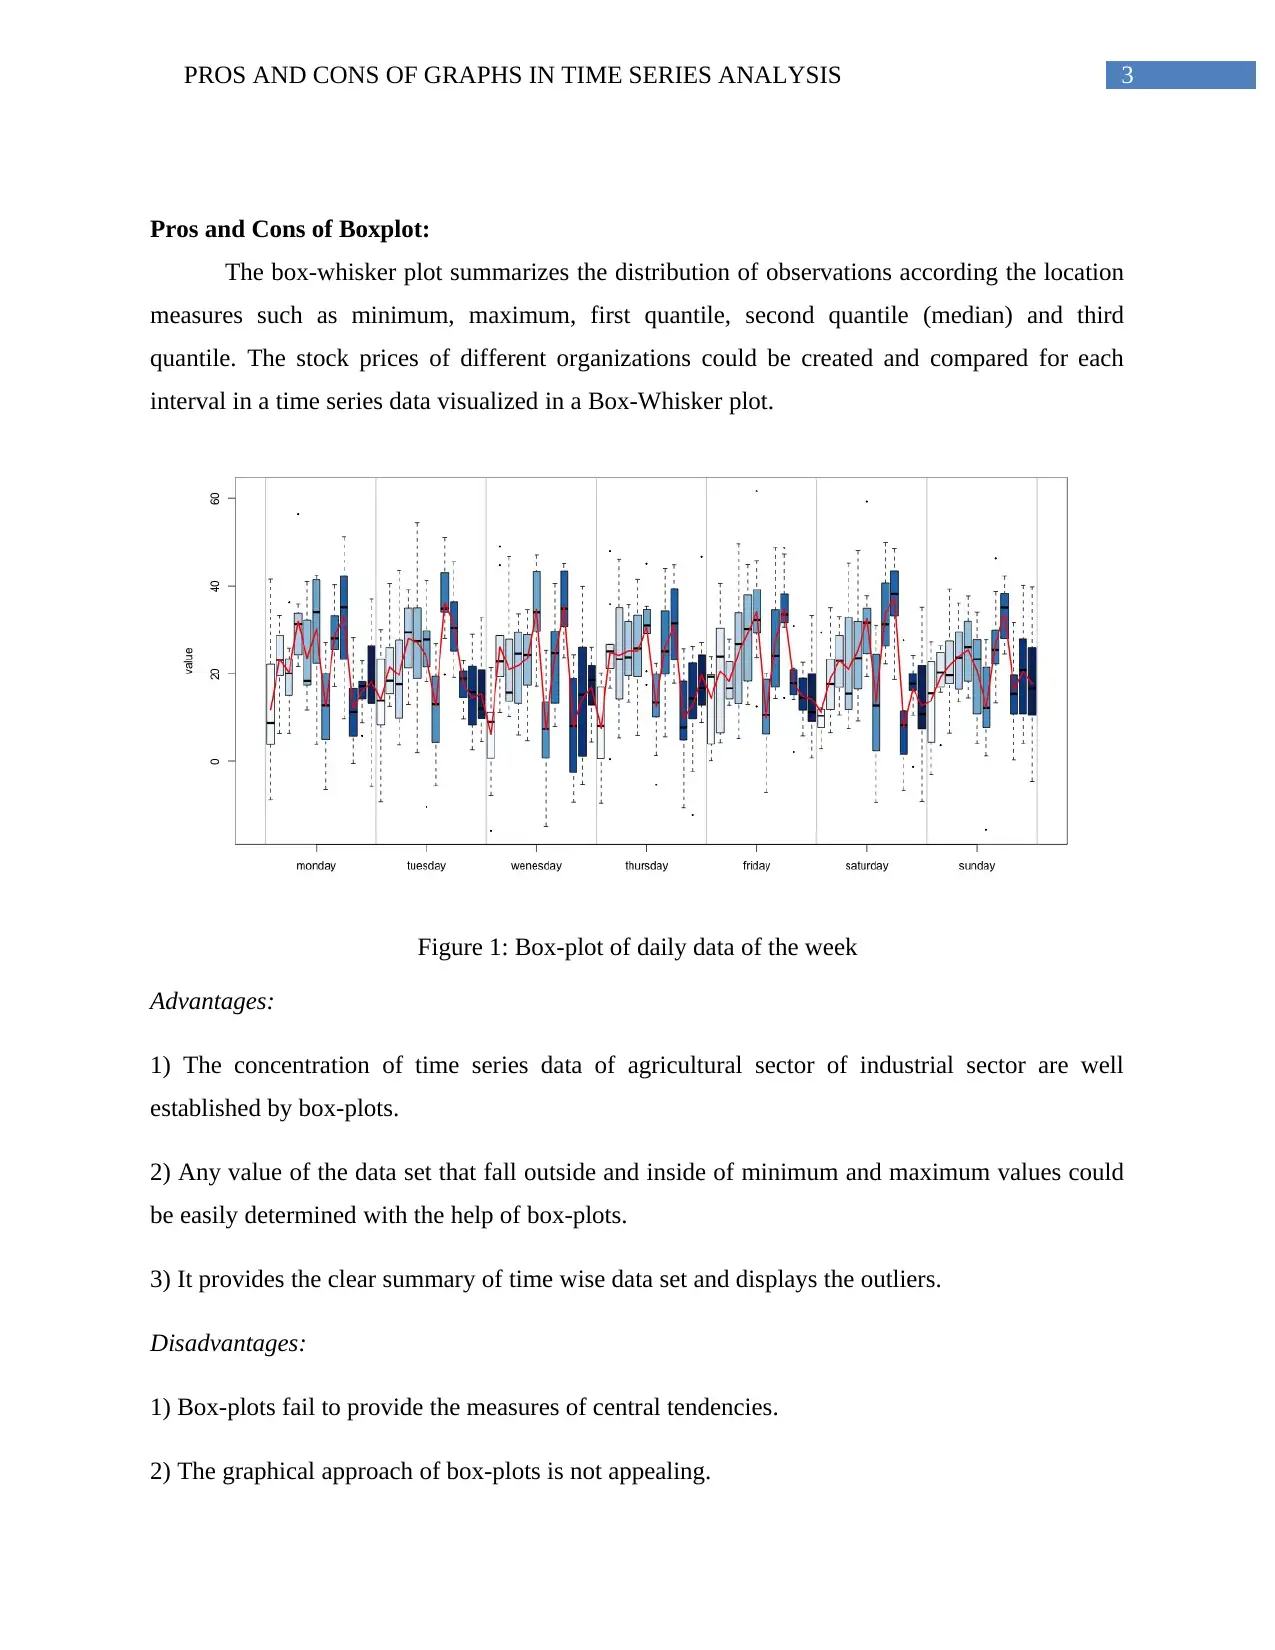
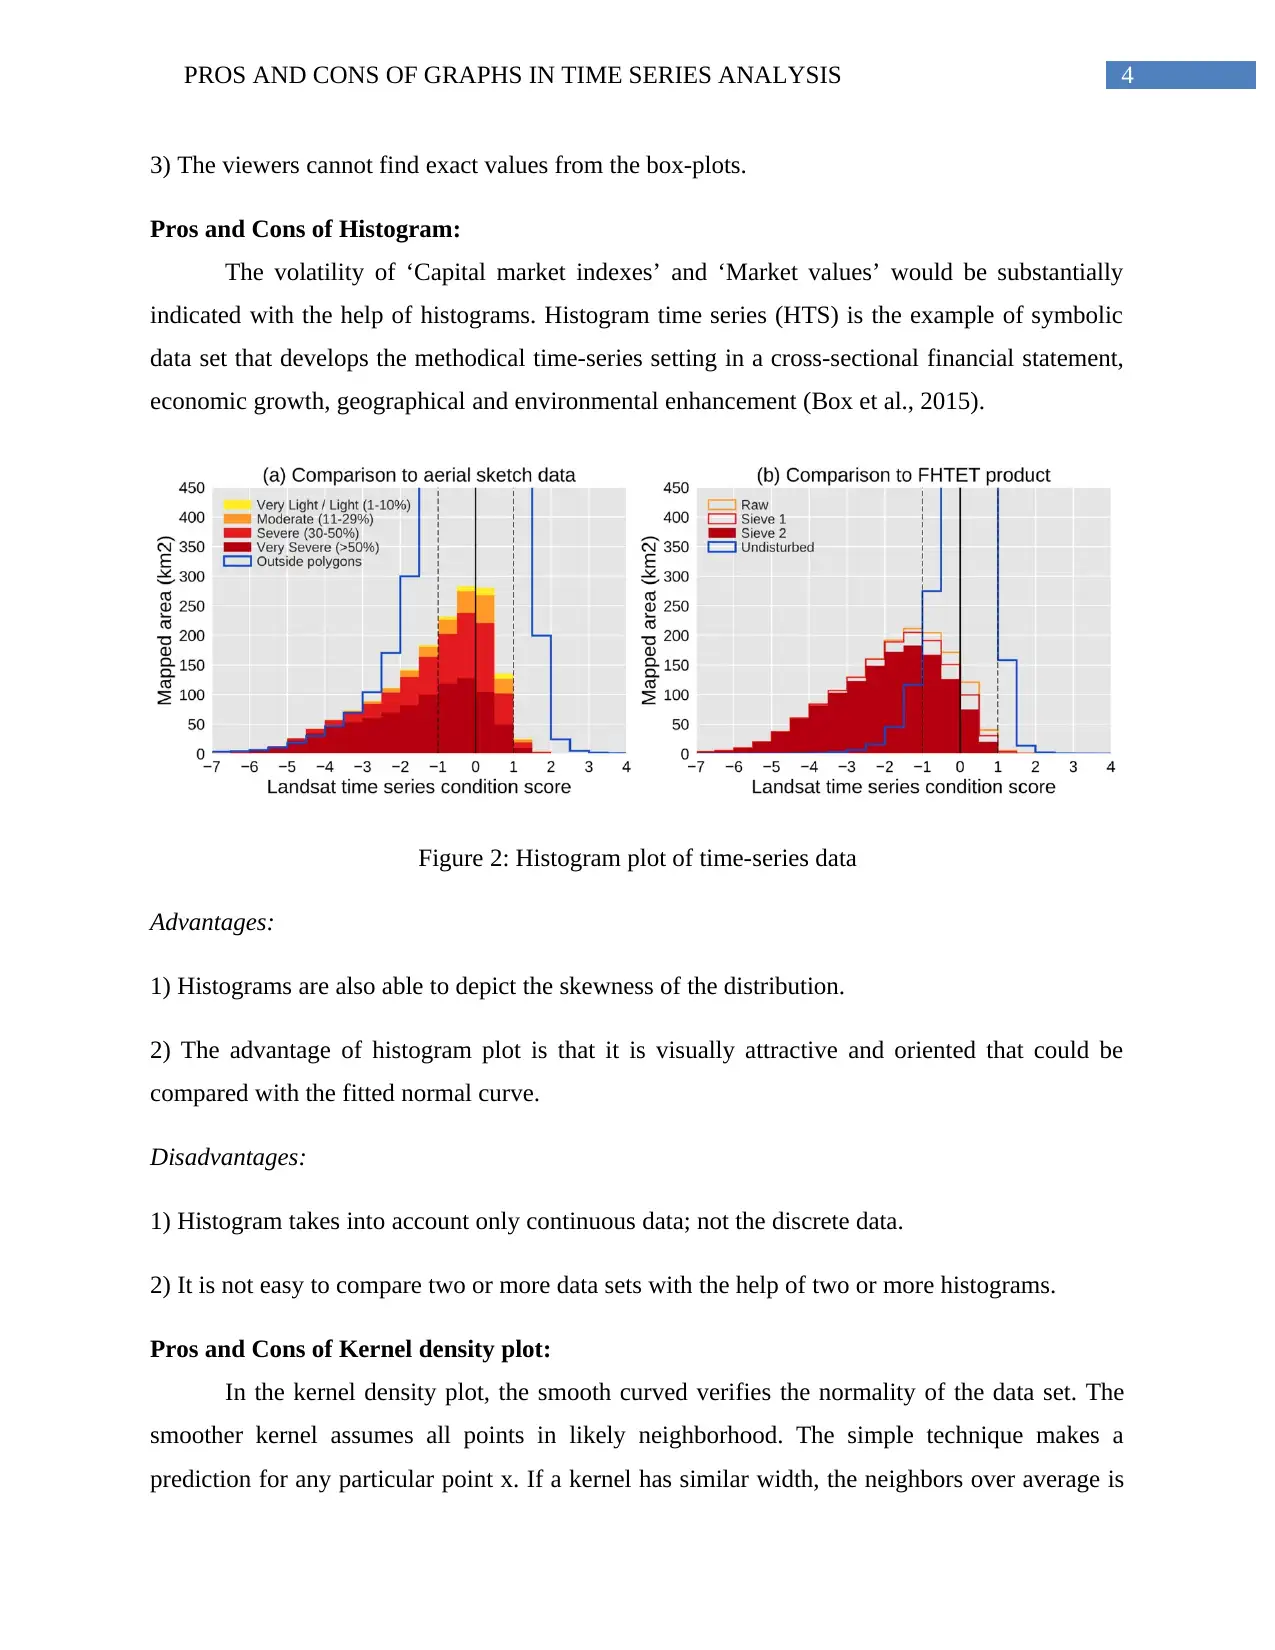
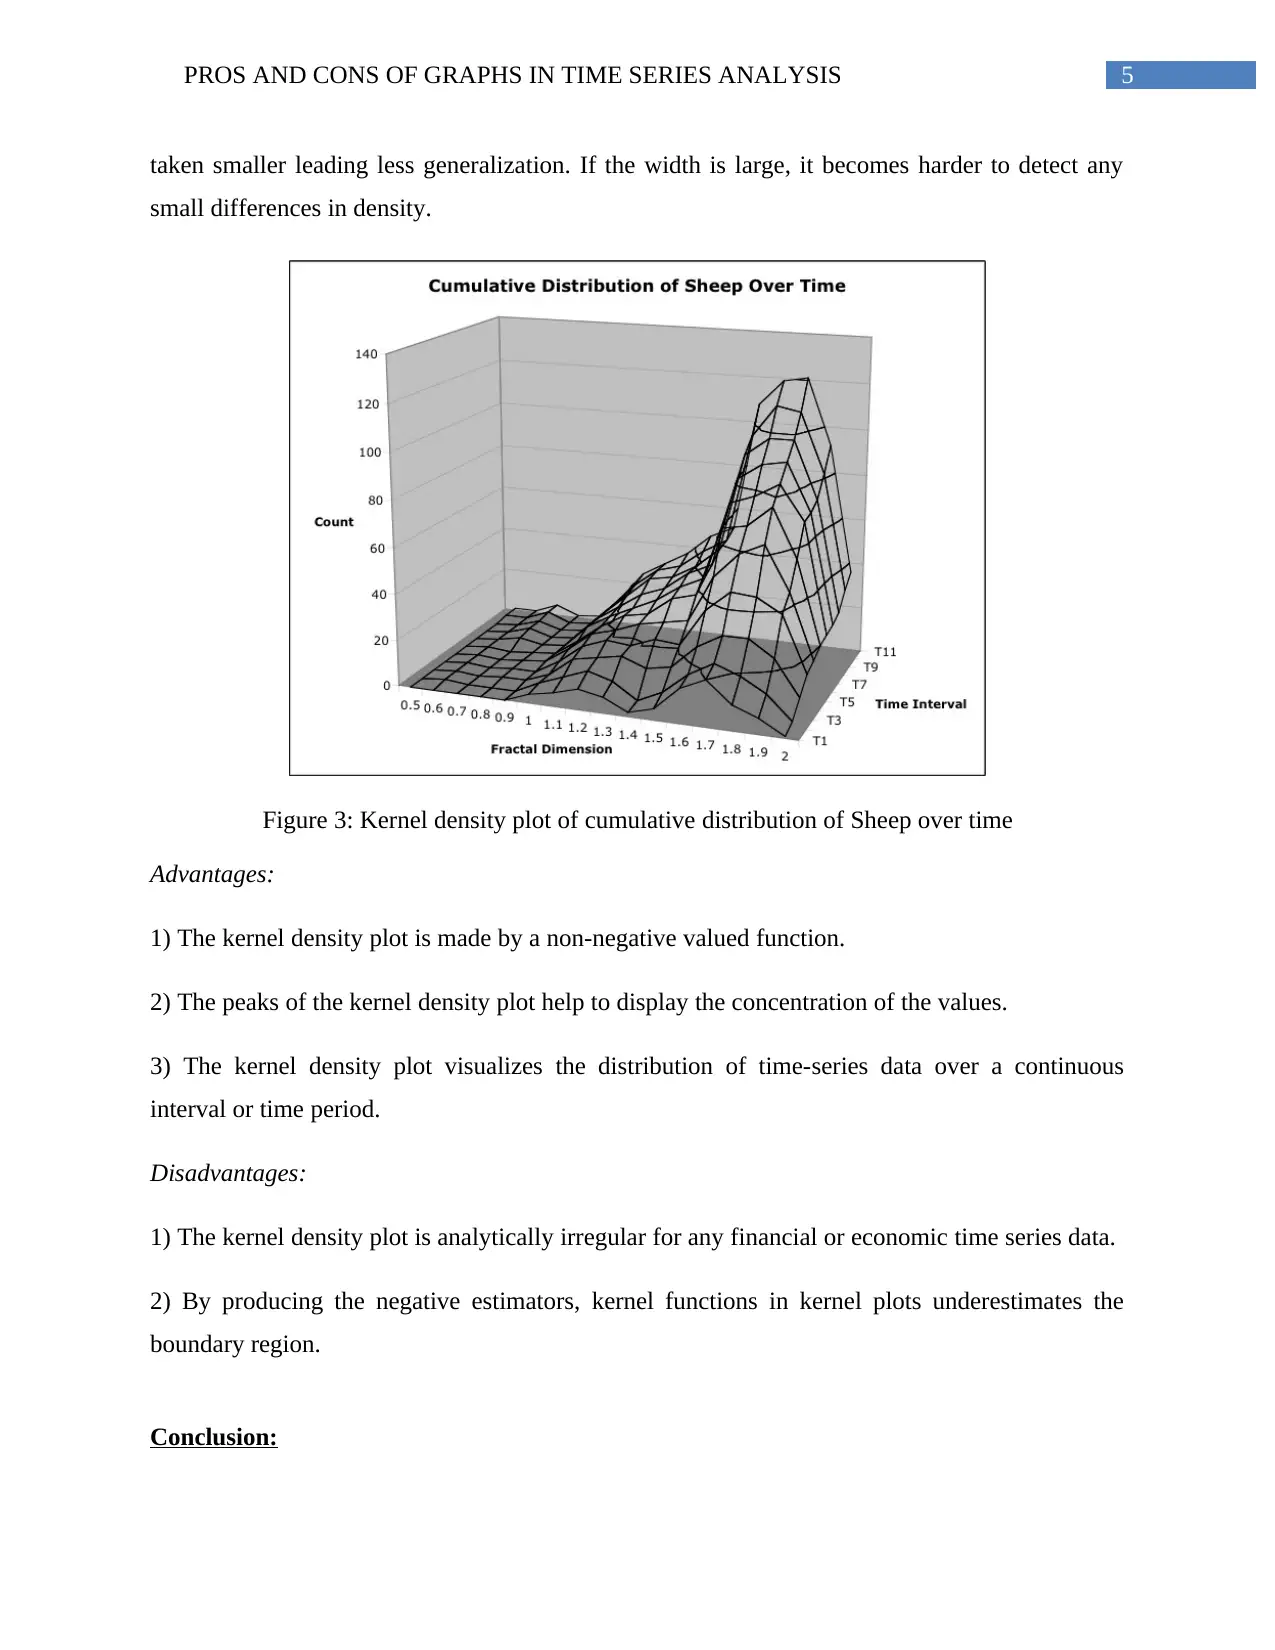
This report discusses the advantages and disadvantages of using visual representations like boxplots, histograms, and kernel density plots in time series analysis. It elaborates on the analytical methods and applications of each method, noting that boxplots are mainly used for economic and financial data, histograms are helpful for concentrated time-series data, and kernel plots are useful for small sample sizes. The analysis covers data-framing and data-modeling for financial, economic, and environmental data, highlighting the role of visualizations in pattern discovery, classification, and clustering. While these graphs are beneficial for visualizing trends and seasonality, complex series analysis is better suited for line graphs and scatterplots.
Document Page
Running Head: PROS AND CONS OF GRAPHS IN TIME SERIES ANALYSIS
Pros and Cons of Graphs in Time Series Analysis
Name of the student:
Name of the university:
Course ID:
tabler-icon-diamond-filled.svg

Paraphrase This Document

Need a fresh take? Get an instant paraphrase of this document with our AI Paraphraser
Document Page
1PROS AND CONS OF GRAPHS IN TIME SERIES ANALYSIS
Table of Contents
Background:.....................................................................................................................................2
Discussion:.......................................................................................................................................2
Pros and Cons of Boxplot:...........................................................................................................3
Pros and Cons of Histogram:.......................................................................................................4
Pros and Cons of Kernel density plot:.........................................................................................4
Conclusion:......................................................................................................................................5
References:......................................................................................................................................7
Document Page
2PROS AND CONS OF GRAPHS IN TIME SERIES ANALYSIS
Background:
In the following report the advantages and disadvantages of visual representation box-
plots, histograms and kernel density plots are discussed. The analytical methods and application
of each method are elaborated. The box-plots are used mainly economic and financial data
plotting with respect to time. The histograms are helpful for concentrated time-series data
whereas the kernel plots are helpful for small sample size. From the time-series data set of nature
and environment to the time-series data set of banking and finance, the analysis would be based
on data-framing and data-modeling. The financial, economic and environmental data are needed
for time series analysis.
Discussion:
Visualizations play an important role in time series analysis and forecasting.
Autocorrelation plots are actually the kernel density plot. Histogram time series (HTS) is the
example of symbolic data set that develops the methodical time-series setting in a cross-sectional
financial statement, economic growth, geographical and environmental enhancement (Box et al.,
2015). The kernel density plot visualizes the distribution of time-series data over a continuous
interval or time period.
The performance on the basis of time series data are majorly directed towards discovery
of pattern, classification and clustering. After reducing the data-dimensionality, data
representation, distance measurements and indexing, the plots like box-plots and kernel-density
plots are very easy way outs of depicting the nature of data (Hout, Smith & Marsden, 2015). The
prediction of future curriculum of any economic factors of real-time data are executed by the
procedures of time-series analysis. Then, the predicted values could easily be depicted with the
help of Kernel density plots. Cohen (2014) stated that stationarity of time-series data is
implemented by graphs and data modeling techniques.
Document Page
3PROS AND CONS OF GRAPHS IN TIME SERIES ANALYSIS
Pros and Cons of Boxplot:
The box-whisker plot summarizes the distribution of observations according the location
measures such as minimum, maximum, first quantile, second quantile (median) and third
quantile. The stock prices of different organizations could be created and compared for each
interval in a time series data visualized in a Box-Whisker plot.
Figure 1: Box-plot of daily data of the week
Advantages:
1) The concentration of time series data of agricultural sector of industrial sector are well
established by box-plots.
2) Any value of the data set that fall outside and inside of minimum and maximum values could
be easily determined with the help of box-plots.
3) It provides the clear summary of time wise data set and displays the outliers.
Disadvantages:
1) Box-plots fail to provide the measures of central tendencies.
2) The graphical approach of box-plots is not appealing.
tabler-icon-diamond-filled.svg

Paraphrase This Document

Need a fresh take? Get an instant paraphrase of this document with our AI Paraphraser
Document Page
4PROS AND CONS OF GRAPHS IN TIME SERIES ANALYSIS
3) The viewers cannot find exact values from the box-plots.
Pros and Cons of Histogram:
The volatility of ‘Capital market indexes’ and ‘Market values’ would be substantially
indicated with the help of histograms. Histogram time series (HTS) is the example of symbolic
data set that develops the methodical time-series setting in a cross-sectional financial statement,
economic growth, geographical and environmental enhancement (Box et al., 2015).
Figure 2: Histogram plot of time-series data
Advantages:
1) Histograms are also able to depict the skewness of the distribution.
2) The advantage of histogram plot is that it is visually attractive and oriented that could be
compared with the fitted normal curve.
Disadvantages:
1) Histogram takes into account only continuous data; not the discrete data.
2) It is not easy to compare two or more data sets with the help of two or more histograms.
Pros and Cons of Kernel density plot:
In the kernel density plot, the smooth curved verifies the normality of the data set. The
smoother kernel assumes all points in likely neighborhood. The simple technique makes a
prediction for any particular point x. If a kernel has similar width, the neighbors over average is
Document Page
5PROS AND CONS OF GRAPHS IN TIME SERIES ANALYSIS
taken smaller leading less generalization. If the width is large, it becomes harder to detect any
small differences in density.
Figure 3: Kernel density plot of cumulative distribution of Sheep over time
Advantages:
1) The kernel density plot is made by a non-negative valued function.
2) The peaks of the kernel density plot help to display the concentration of the values.
3) The kernel density plot visualizes the distribution of time-series data over a continuous
interval or time period.
Disadvantages:
1) The kernel density plot is analytically irregular for any financial or economic time series data.
2) By producing the negative estimators, kernel functions in kernel plots underestimates the
boundary region.
Conclusion:
Document Page
6PROS AND CONS OF GRAPHS IN TIME SERIES ANALYSIS
The trend, seasonality and other structured information might be visualized with these
data. The graphs retrieved from time series data in the context of business and financial field
would be helpful for prediction and drawing conclusions in future prospect. However, the
various types of fitting curve and complex series analysis would be difficult to show vis box-
plots, histograms or kernel plots; line graphs and scatterplots are perfect for these.
tabler-icon-diamond-filled.svg

Paraphrase This Document

Need a fresh take? Get an instant paraphrase of this document with our AI Paraphraser
Document Page
7PROS AND CONS OF GRAPHS IN TIME SERIES ANALYSIS
References:
Box, G. E., Jenkins, G. M., Reinsel, G. C., & Ljung, G. M. (2015). Time series analysis:
forecasting and control. John Wiley & Sons.
Cohen, M. X. (2014). Analyzing neural time series data: theory and practice. MIT press.
Hout, M., Smith, T. W., & Marsden, P. V. (2015). Prestige and Socioeconomic Scores for the
2010 Census Codes. Methodological Report MR124, Chicago, NORC. http://gss. norc.
org/get-documentation/methodological-reports.
chevron_up_icon
1 out of 8
circle_padding
hide_on_mobile
zoom_out_icon
[object Object]