MATH111 Essay: Analyzing Medical Data Using Graphical Representations
VerifiedAdded on 2023/03/17
|7
|1394
|99
Essay
AI Summary
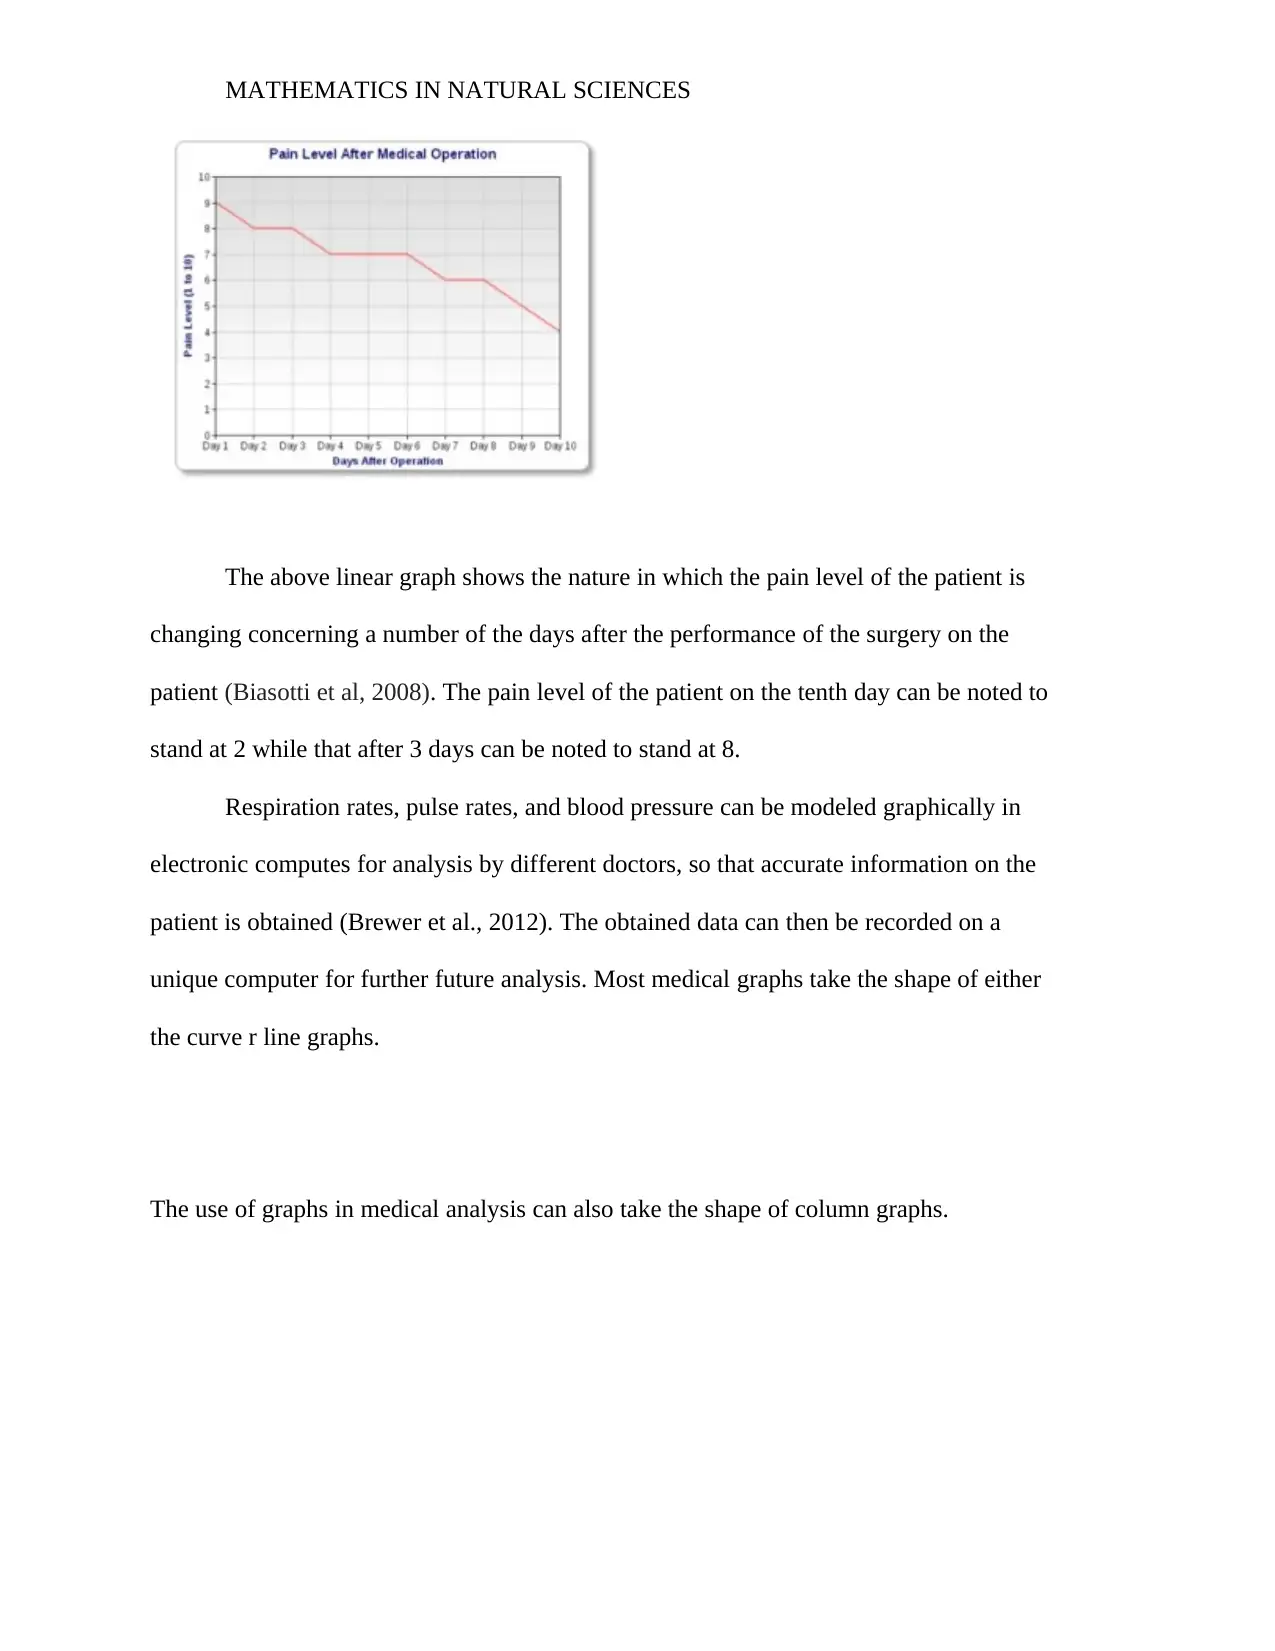
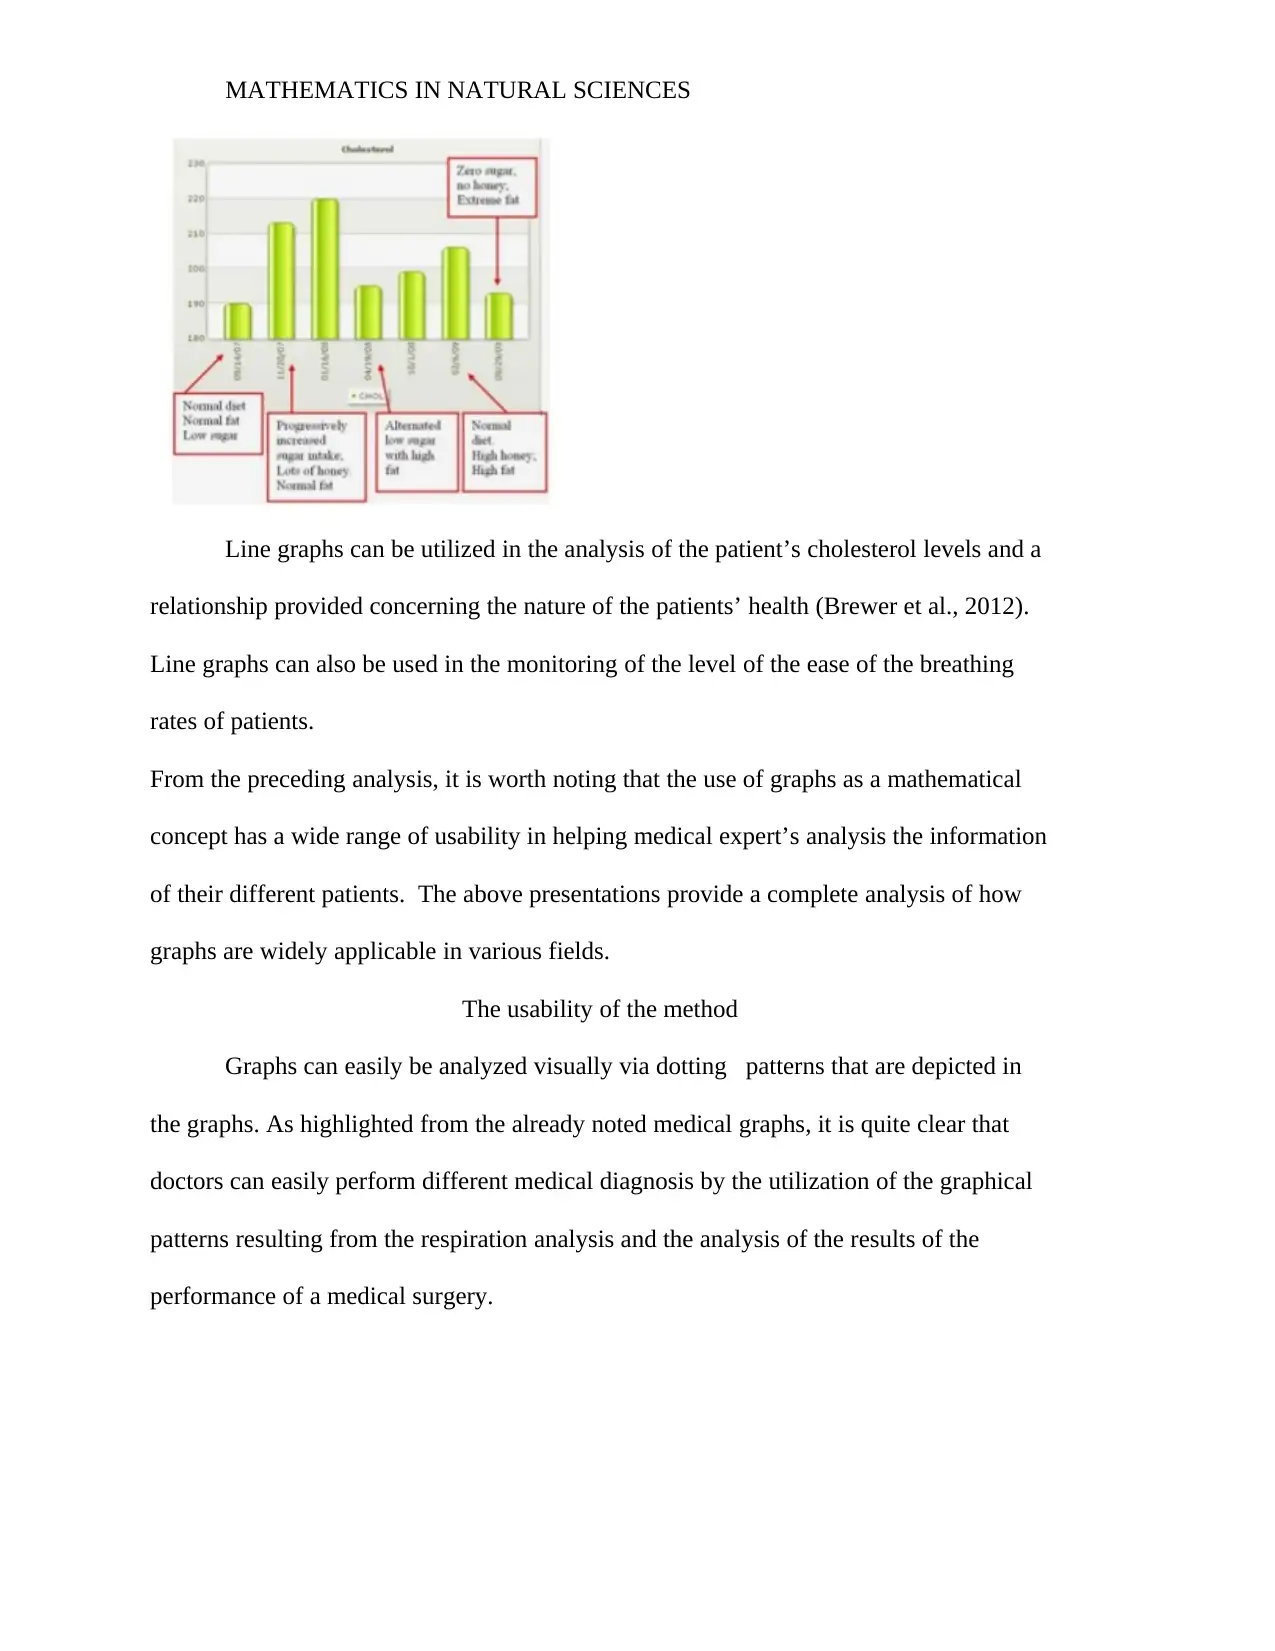
This essay explores the application of graphical representations in medical analysis, focusing on how different types of graphs are utilized to interpret and analyze patient data. The essay begins by introducing the concept of graphical representation of data and its importance in scientific analysis. It then describes various graph types, including linear, bar, and pie charts, illustrating their applications with relevant examples. The core of the essay focuses on the use of graphs in medical diagnostics, highlighting how they are used to obtain crucial patient information and assess various medical conditions. Examples include the visualization of patient pain scales, respiration rates, pulse rates, and blood pressure. The essay emphasizes the benefits of using graphs in medical analysis, such as assisting doctors in making informed decisions, adjusting medications, and monitoring patient progress. The essay concludes by summarizing the wide range of usability of graphs as a mathematical concept in helping medical experts analyze the information of their different patients.
1 out of 7
Related Documents


Your All-in-One AI-Powered Toolkit for Academic Success.
+13062052269
info@desklib.com
Available 24*7 on WhatsApp / Email
![[object Object]](/_next/static/media/star-bottom.7253800d.svg)
Copyright © 2020–2026 A2Z Services. All Rights Reserved. Developed and managed by ZUCOL.