Financial Analysis Report: Gravepals, Cost, and Investment
VerifiedAdded on 2020/10/22
|20
|4629
|62
Report
AI Summary
This report provides a comprehensive analysis of accounting and finance principles applied to a case study, likely Gravepals. It begins with the preparation of an income statement and statement of financial position, crucial components of financial reporting. The report delves into various cost calculations, including fixed costs, break-even analysis, and margin of safety, essential for understanding profitability and operational efficiency. Furthermore, it examines investment appraisal techniques, such as payback period, accounting rate of return, and net present value, crucial for making informed investment decisions. The report also explores the benefits and limitations of budgeting as a strategic planning tool. Overall, the report provides a practical application of financial concepts and analytical methods.
Accounting and
Finance
Table of Contents
Finance
Table of Contents
Paraphrase This Document
Need a fresh take? Get an instant paraphrase of this document with our AI Paraphraser
INTRODUCTION...........................................................................................................................3
TASK 1............................................................................................................................................3
A) Prepare an Income Statement and Statement of Financial Position for organisation.......3
TASK 2............................................................................................................................................5
b) Calculation of various types of cost...................................................................................5
a) Calculation of fixed cost.....................................................................................................5
b). Calculation of Marginal Safety.........................................................................................6
c) Calculation of profit...........................................................................................................7
d) Calculations fir selling price..............................................................................................7
e) Identify and explain the underpinning assumptions to break even model.........................8
TASK 3............................................................................................................................................9
C) Calculation of payback period, accounting rate of return and net present value..............9
a)Calculations of different methods.......................................................................................9
b) Key merits and limitations of investment appraisal techniques.......................................10
C) Identifies and explains the key benefits and limitations of using budgets as a tool for
strategic planning..................................................................................................................13
CONCLUSION..............................................................................................................................15
REFERENCES..............................................................................................................................17
INTRODUCTION
Accounting and finance are the tools and techniques which is used by an organisation to
summarise, record and interpretation of data and financial information. It helps the company to
know the financial position of it through which it can take future investment decision. In this
report financial statements are prepared such as balance sheet and profit & loss account. Payback
period, accounting rare of return and net present value are also analysed. Apart from this various
types of costs are calculated that are break even & margin of safety.
TASK 1
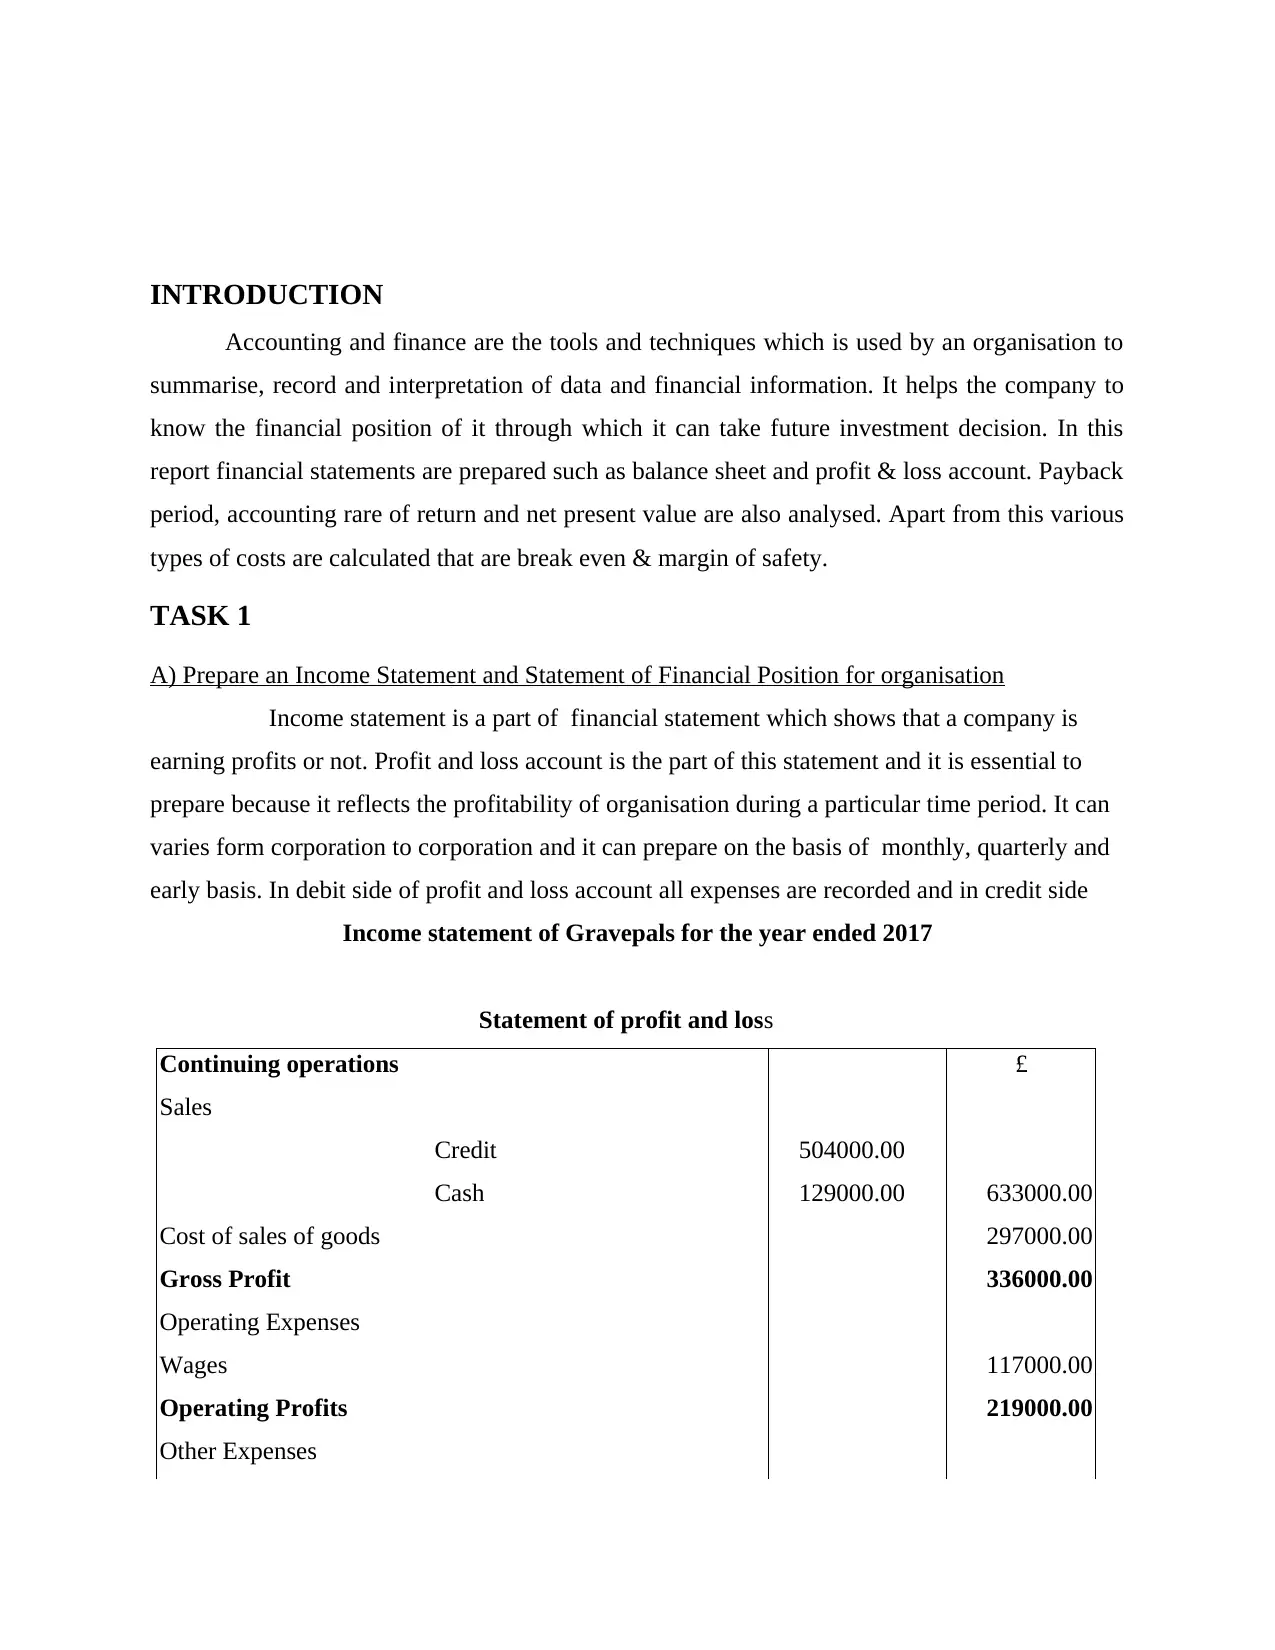
A) Prepare an Income Statement and Statement of Financial Position for organisation
Income statement is a part of financial statement which shows that a company is
earning profits or not. Profit and loss account is the part of this statement and it is essential to
prepare because it reflects the profitability of organisation during a particular time period. It can
varies form corporation to corporation and it can prepare on the basis of monthly, quarterly and
early basis. In debit side of profit and loss account all expenses are recorded and in credit side
Income statement of Gravepals for the year ended 2017
Statement of profit and loss
Continuing operations £
Sales
Credit 504000.00
Cash 129000.00 633000.00
Cost of sales of goods 297000.00
Gross Profit 336000.00
Operating Expenses
Wages 117000.00
Operating Profits 219000.00
Other Expenses
Accounting and finance are the tools and techniques which is used by an organisation to
summarise, record and interpretation of data and financial information. It helps the company to
know the financial position of it through which it can take future investment decision. In this
report financial statements are prepared such as balance sheet and profit & loss account. Payback
period, accounting rare of return and net present value are also analysed. Apart from this various
types of costs are calculated that are break even & margin of safety.
TASK 1
A) Prepare an Income Statement and Statement of Financial Position for organisation
Income statement is a part of financial statement which shows that a company is
earning profits or not. Profit and loss account is the part of this statement and it is essential to
prepare because it reflects the profitability of organisation during a particular time period. It can
varies form corporation to corporation and it can prepare on the basis of monthly, quarterly and
early basis. In debit side of profit and loss account all expenses are recorded and in credit side
Income statement of Gravepals for the year ended 2017
Statement of profit and loss
Continuing operations £
Sales
Credit 504000.00
Cash 129000.00 633000.00
Cost of sales of goods 297000.00
Gross Profit 336000.00
Operating Expenses
Wages 117000.00
Operating Profits 219000.00
Other Expenses
⊘ This is a preview!⊘
Do you want full access?
Subscribe today to unlock all pages.
Trusted by 1+ million students worldwide
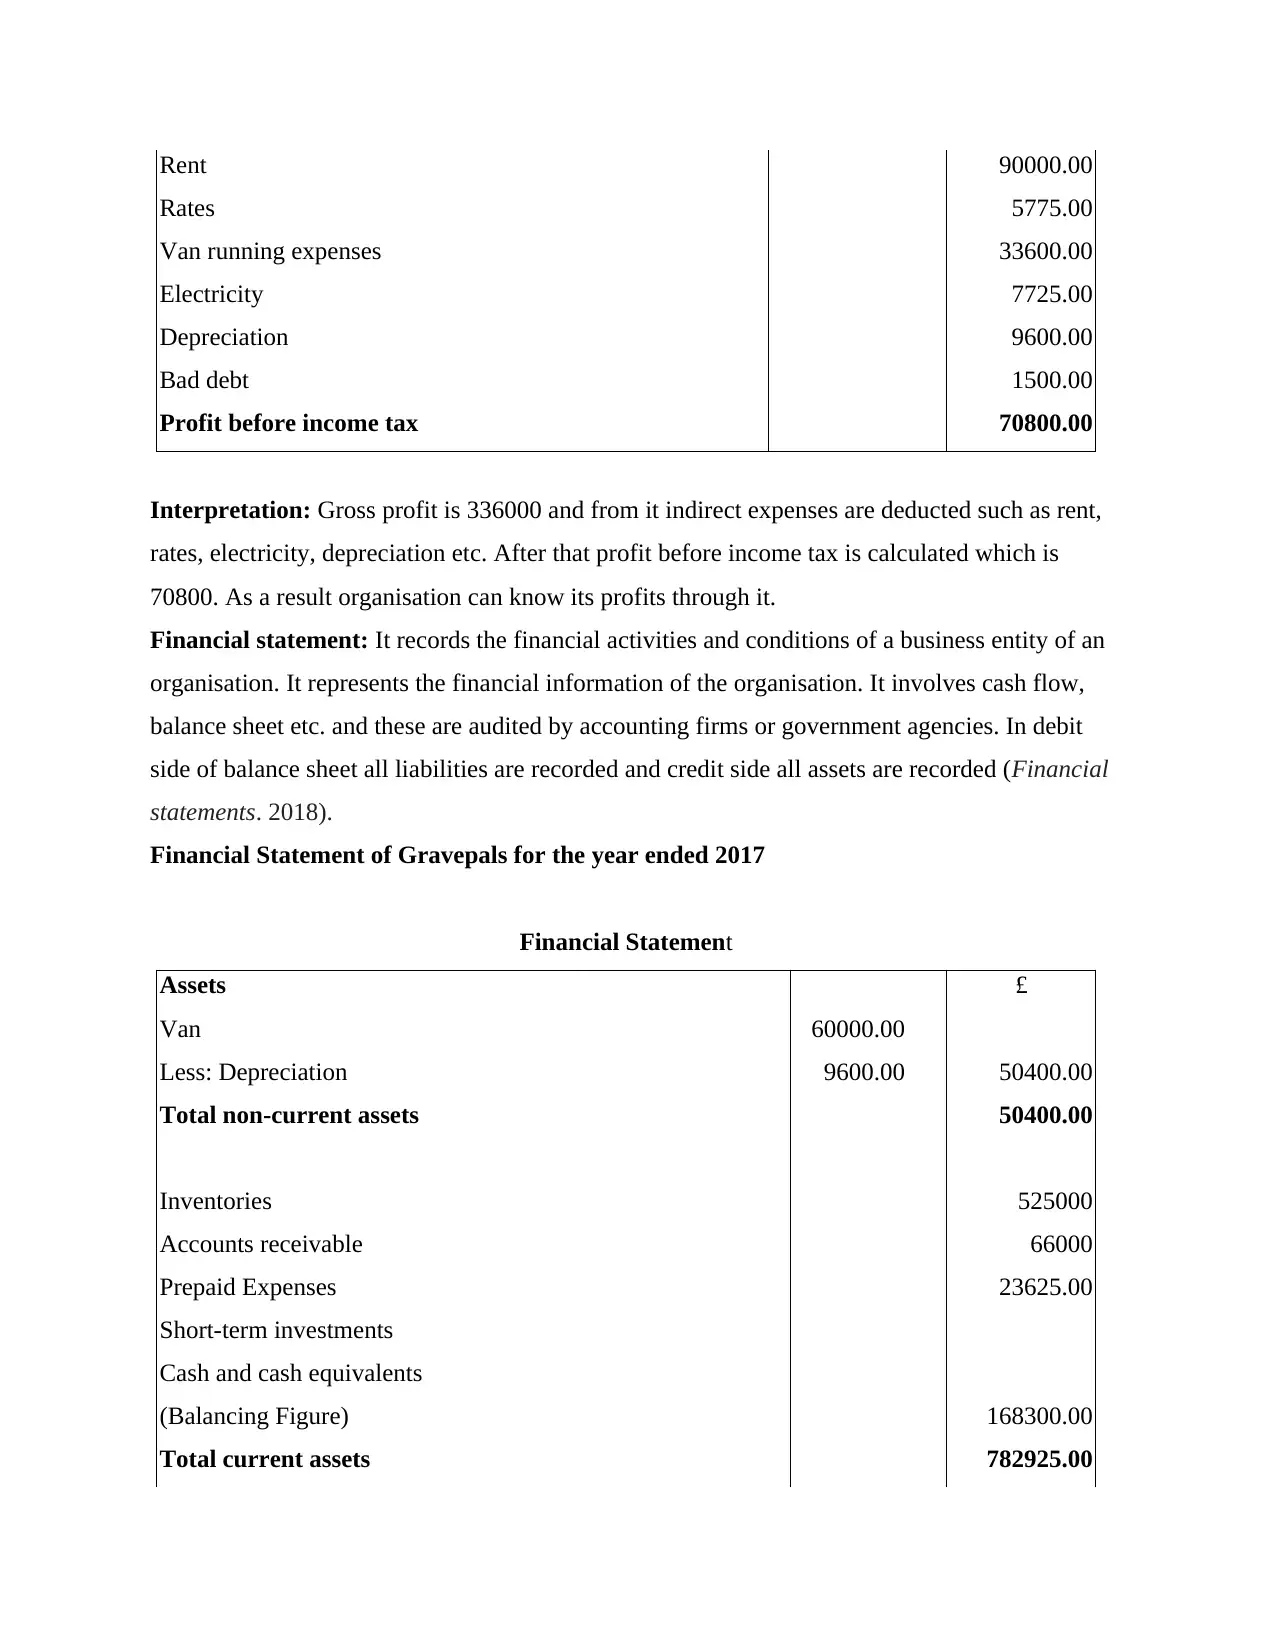
Rent 90000.00
Rates 5775.00
Van running expenses 33600.00
Electricity 7725.00
Depreciation 9600.00
Bad debt 1500.00
Profit before income tax 70800.00
Interpretation: Gross profit is 336000 and from it indirect expenses are deducted such as rent,
rates, electricity, depreciation etc. After that profit before income tax is calculated which is
70800. As a result organisation can know its profits through it.
Financial statement: It records the financial activities and conditions of a business entity of an
organisation. It represents the financial information of the organisation. It involves cash flow,
balance sheet etc. and these are audited by accounting firms or government agencies. In debit
side of balance sheet all liabilities are recorded and credit side all assets are recorded (Financial
statements. 2018).
Financial Statement of Gravepals for the year ended 2017
Financial Statement
Assets £
Van 60000.00
Less: Depreciation 9600.00 50400.00
Total non-current assets 50400.00
Inventories 525000
Accounts receivable 66000
Prepaid Expenses 23625.00
Short-term investments
Cash and cash equivalents
(Balancing Figure) 168300.00
Total current assets 782925.00
Paraphrase This Document
Need a fresh take? Get an instant paraphrase of this document with our AI Paraphraser
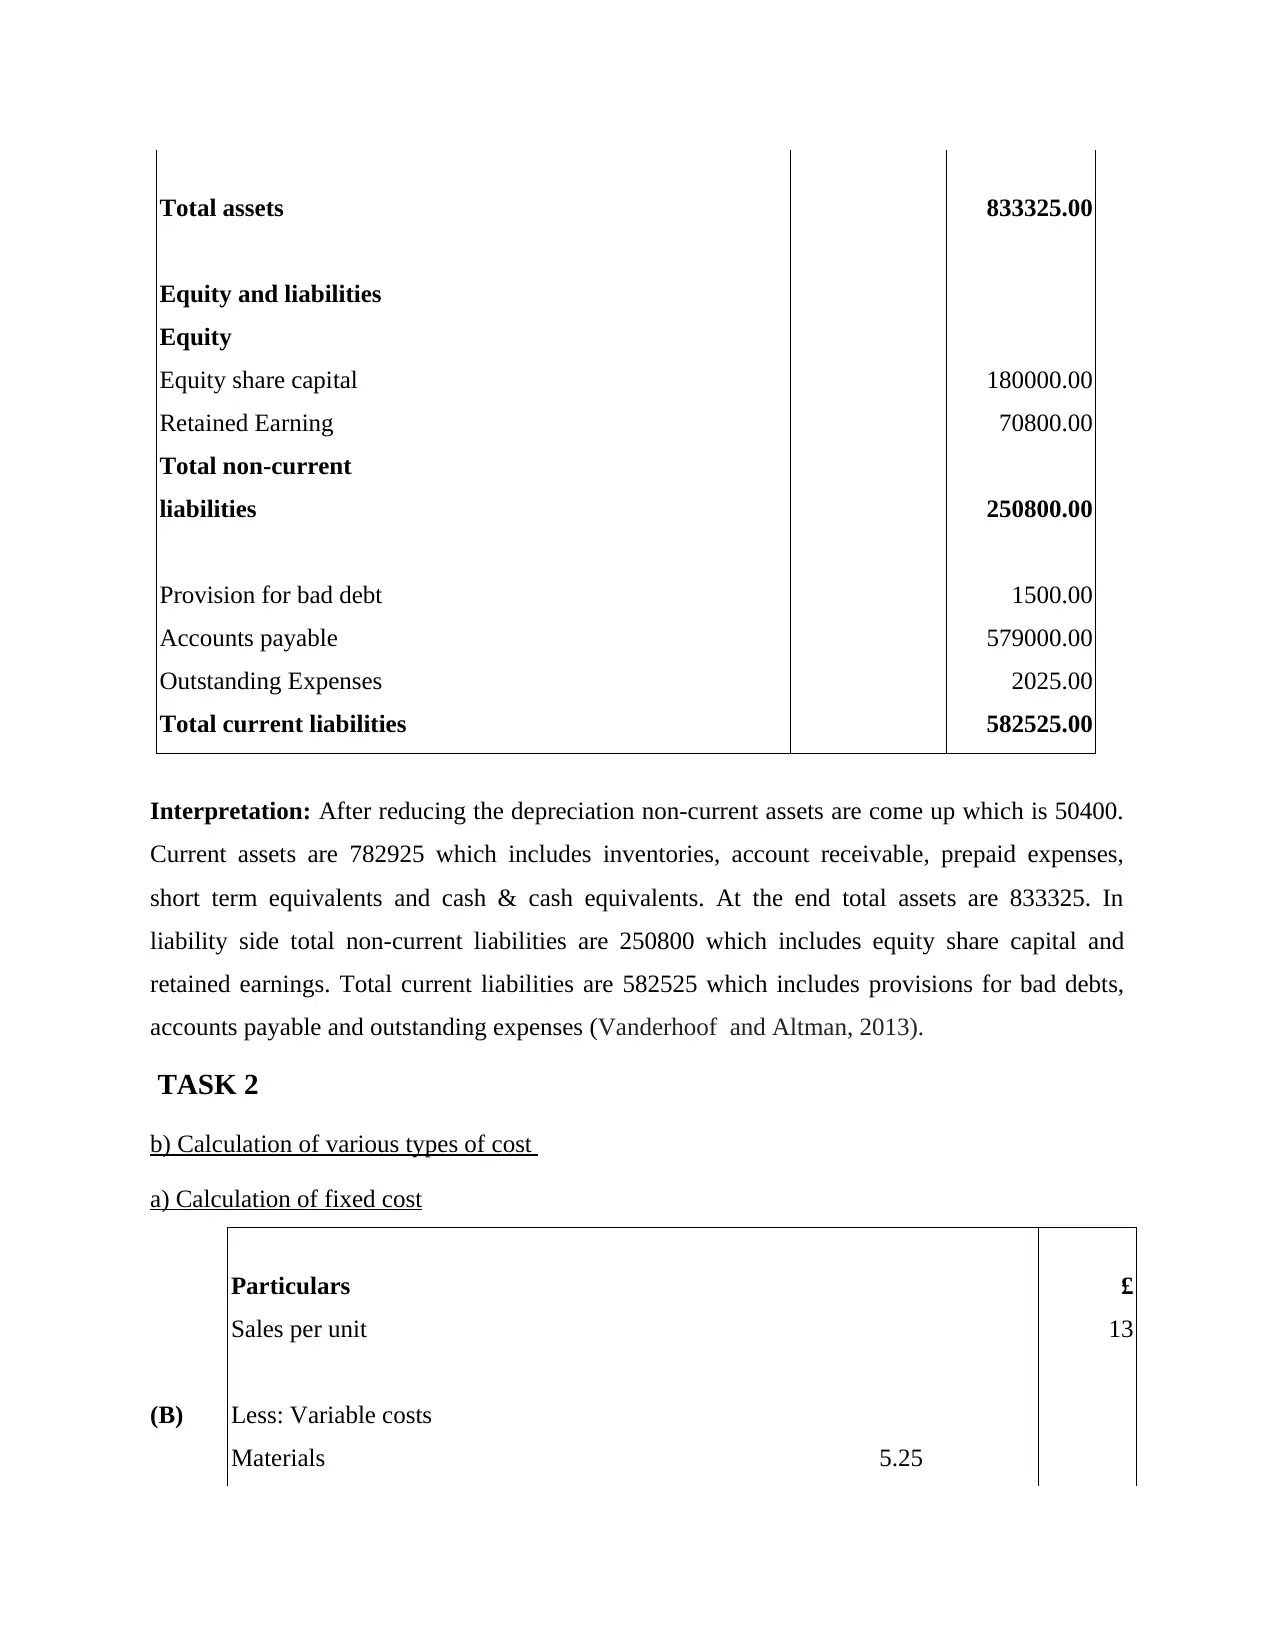
Total assets 833325.00
Equity and liabilities
Equity
Equity share capital 180000.00
Retained Earning 70800.00
Total non-current
liabilities 250800.00
Provision for bad debt 1500.00
Accounts payable 579000.00
Outstanding Expenses 2025.00
Total current liabilities 582525.00
Interpretation: After reducing the depreciation non-current assets are come up which is 50400.
Current assets are 782925 which includes inventories, account receivable, prepaid expenses,
short term equivalents and cash & cash equivalents. At the end total assets are 833325. In
liability side total non-current liabilities are 250800 which includes equity share capital and
retained earnings. Total current liabilities are 582525 which includes provisions for bad debts,
accounts payable and outstanding expenses (Vanderhoof and Altman, 2013).
TASK 2
b) Calculation of various types of cost
a) Calculation of fixed cost
Particulars £
Sales per unit 13
(B) Less: Variable costs
Materials 5.25
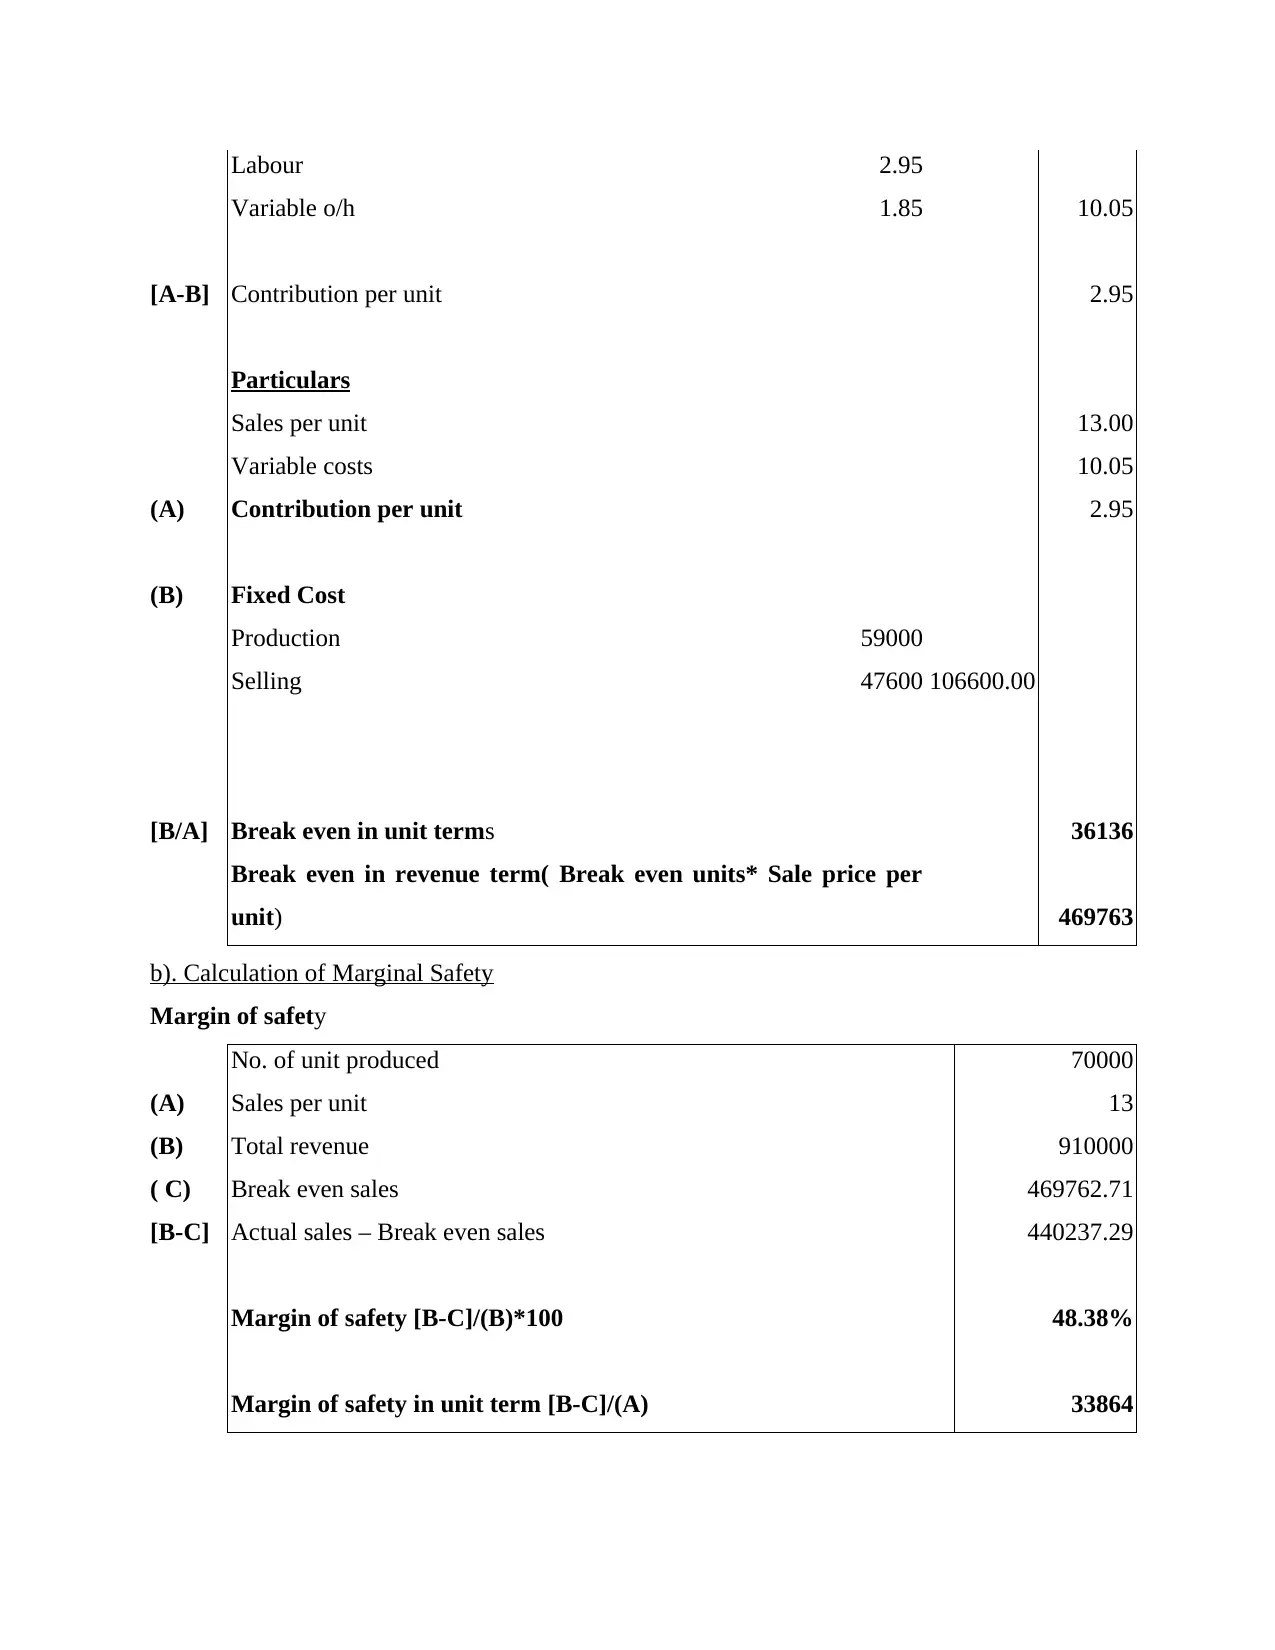
Labour 2.95
Variable o/h 1.85 10.05
[A-B] Contribution per unit 2.95
Particulars
Sales per unit 13.00
Variable costs 10.05
(A) Contribution per unit 2.95
(B) Fixed Cost
Production 59000
Selling 47600 106600.00
[B/A] Break even in unit terms 36136
Break even in revenue term( Break even units* Sale price per
unit) 469763
b). Calculation of Marginal Safety
Margin of safety
No. of unit produced 70000
(A) Sales per unit 13
(B) Total revenue 910000
( C) Break even sales 469762.71
[B-C] Actual sales – Break even sales 440237.29
Margin of safety [B-C]/(B)*100 48.38%
Margin of safety in unit term [B-C]/(A) 33864
⊘ This is a preview!⊘
Do you want full access?
Subscribe today to unlock all pages.
Trusted by 1+ million students worldwide
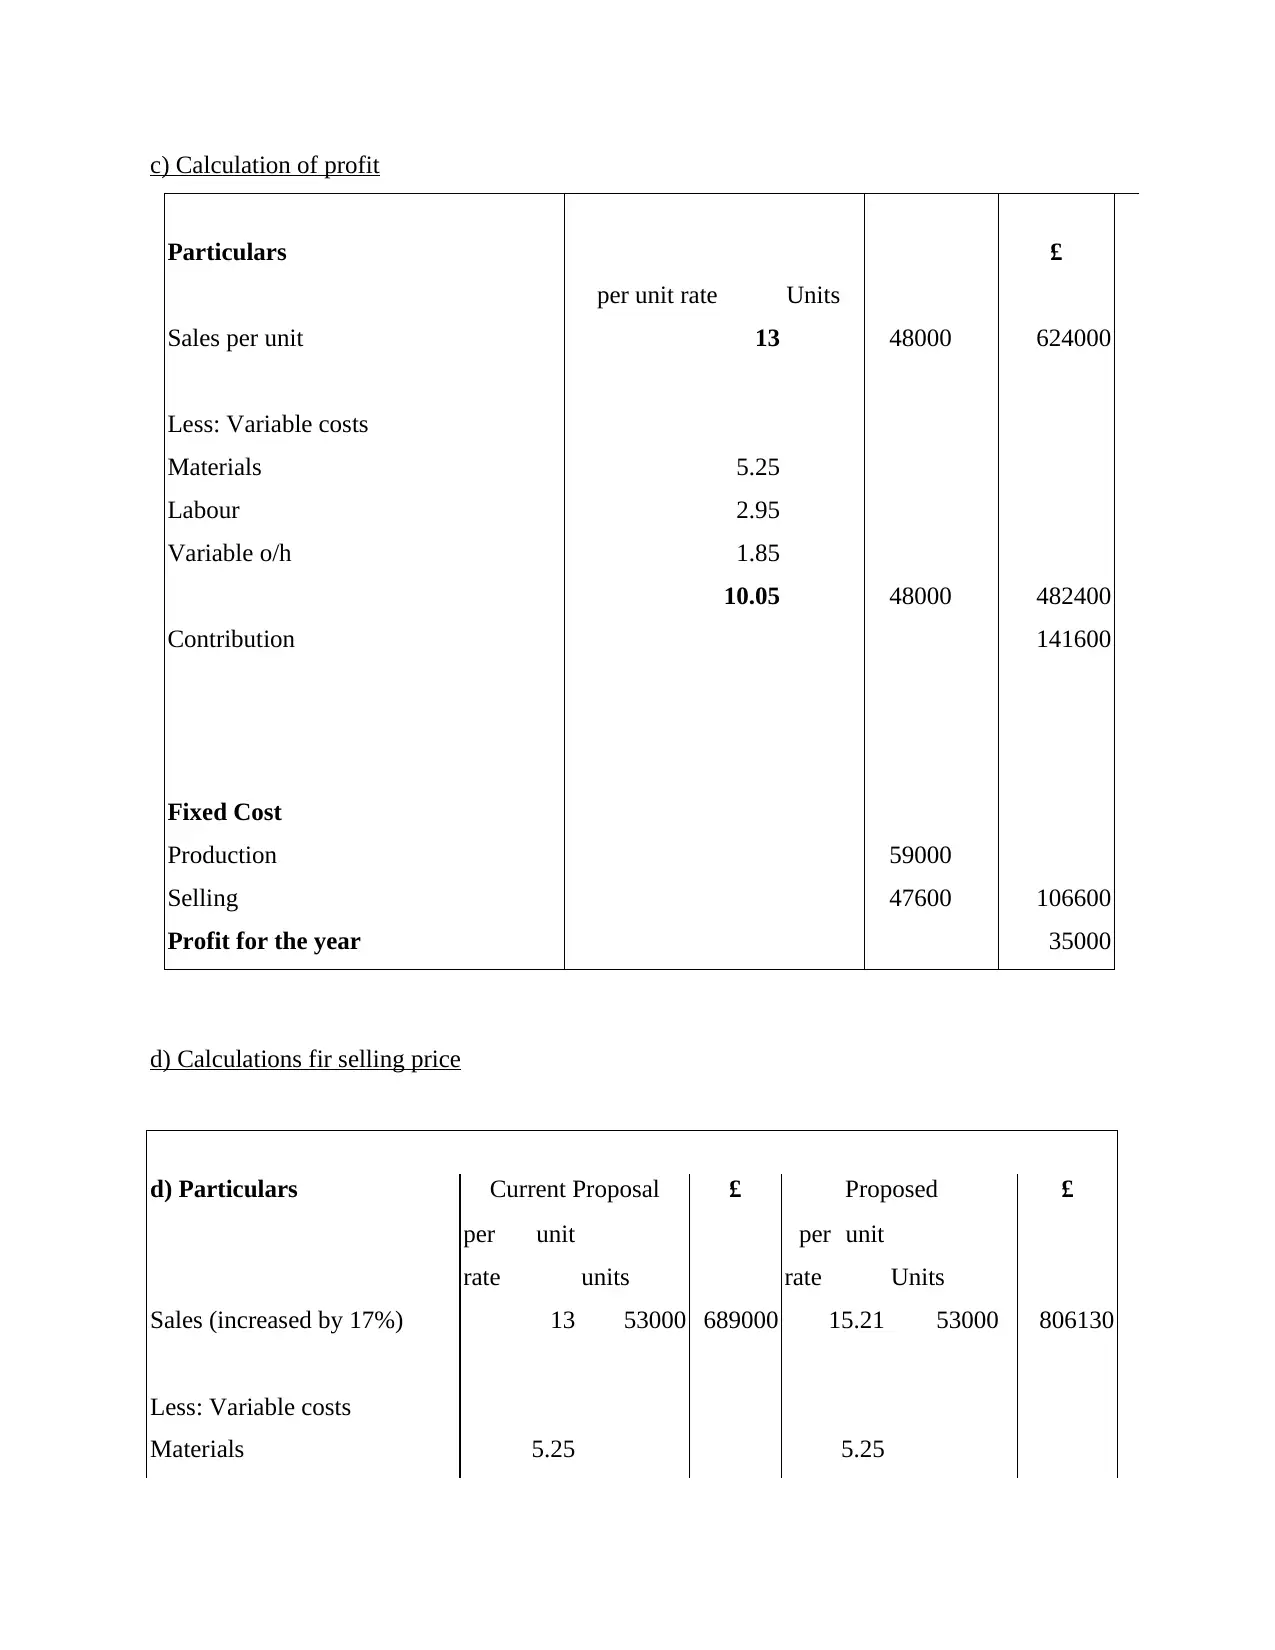
c) Calculation of profit
Particulars £
per unit rate Units
Sales per unit 13 48000 624000
Less: Variable costs
Materials 5.25
Labour 2.95
Variable o/h 1.85
10.05 48000 482400
Contribution 141600
Fixed Cost
Production 59000
Selling 47600 106600
Profit for the year 35000
d) Calculations fir selling price
d) Particulars Current Proposal £ Proposed £
per unit
rate units
per unit
rate Units
Sales (increased by 17%) 13 53000 689000 15.21 53000 806130
Less: Variable costs
Materials 5.25 5.25
Paraphrase This Document
Need a fresh take? Get an instant paraphrase of this document with our AI Paraphraser
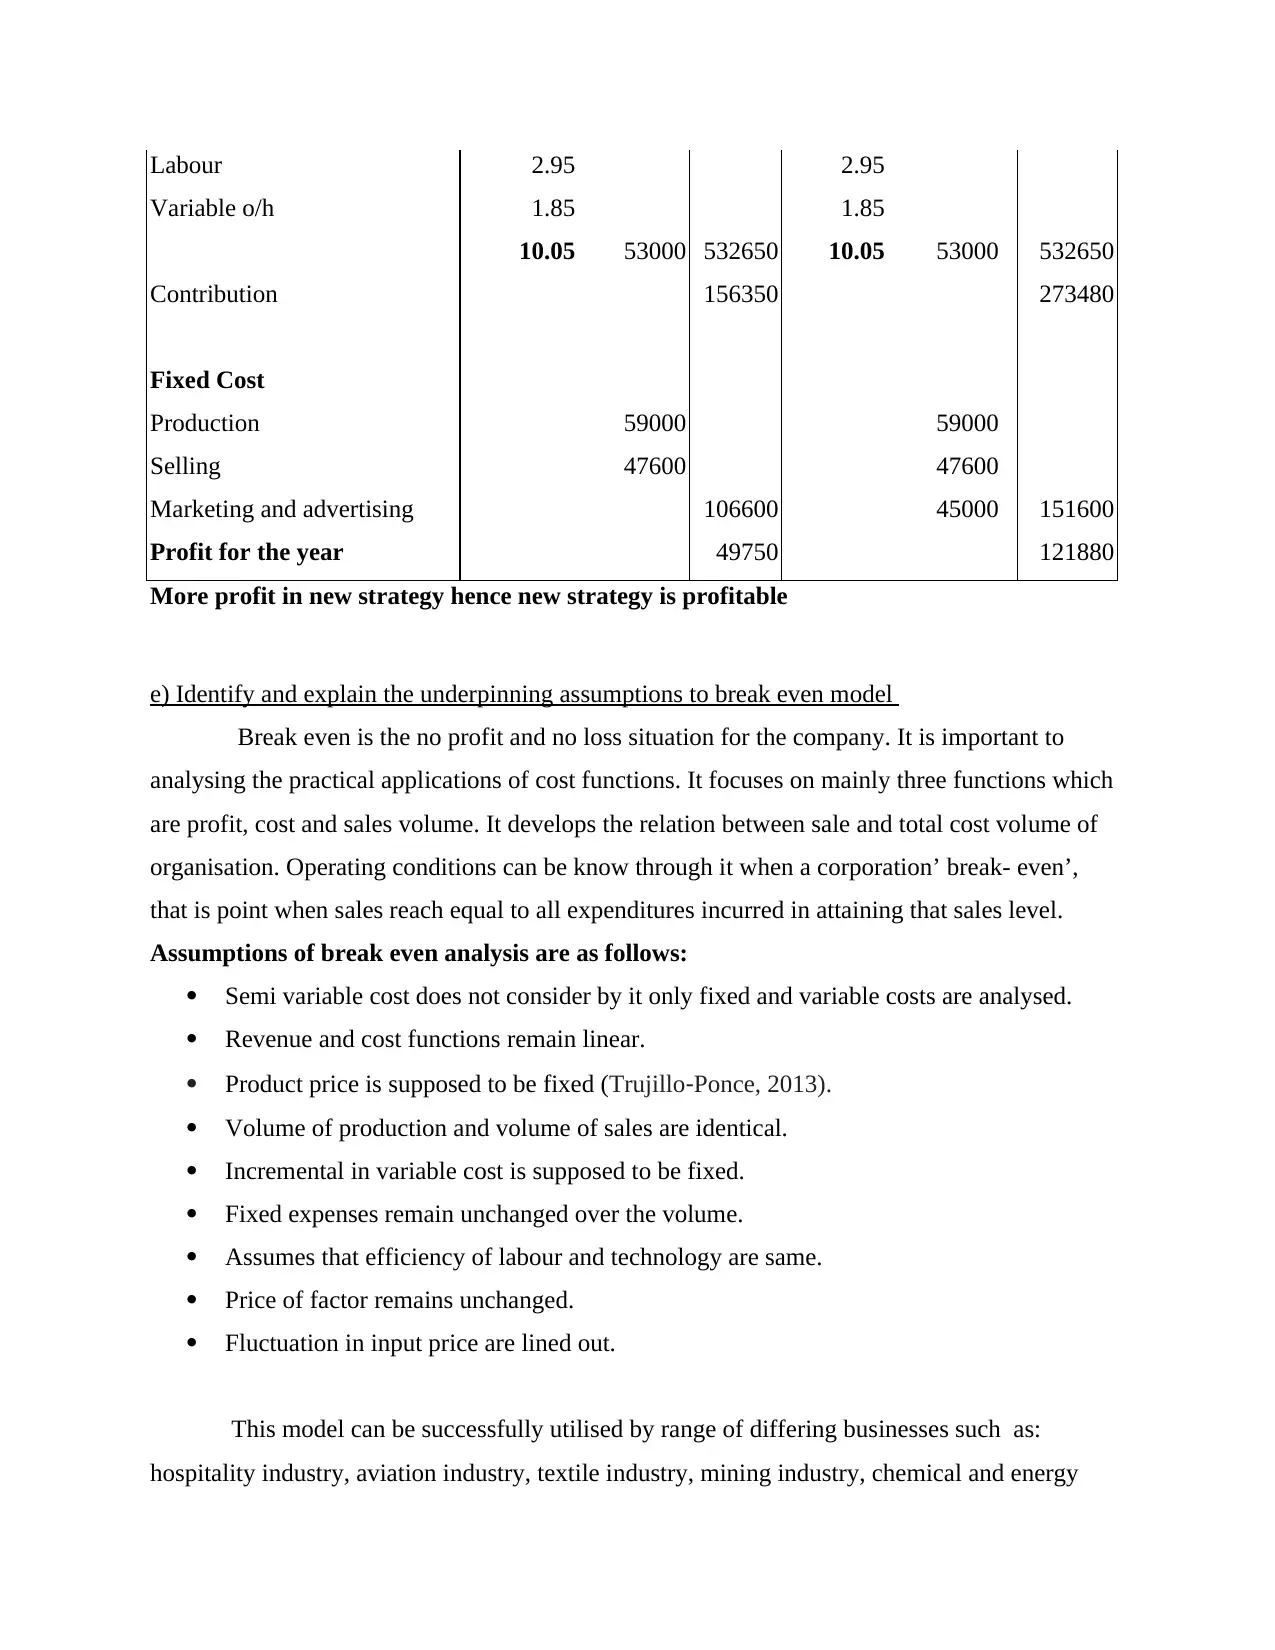
Labour 2.95 2.95
Variable o/h 1.85 1.85
10.05 53000 532650 10.05 53000 532650
Contribution 156350 273480
Fixed Cost
Production 59000 59000
Selling 47600 47600
Marketing and advertising 106600 45000 151600
Profit for the year 49750 121880
More profit in new strategy hence new strategy is profitable
e) Identify and explain the underpinning assumptions to break even model
Break even is the no profit and no loss situation for the company. It is important to
analysing the practical applications of cost functions. It focuses on mainly three functions which
are profit, cost and sales volume. It develops the relation between sale and total cost volume of
organisation. Operating conditions can be know through it when a corporation’ break- even’,
that is point when sales reach equal to all expenditures incurred in attaining that sales level.
Assumptions of break even analysis are as follows:
Semi variable cost does not consider by it only fixed and variable costs are analysed.
Revenue and cost functions remain linear.
Product price is supposed to be fixed (Trujillo‐Ponce, 2013).
Volume of production and volume of sales are identical.
Incremental in variable cost is supposed to be fixed.
Fixed expenses remain unchanged over the volume.
Assumes that efficiency of labour and technology are same.
Price of factor remains unchanged.
Fluctuation in input price are lined out.
This model can be successfully utilised by range of differing businesses such as:
hospitality industry, aviation industry, textile industry, mining industry, chemical and energy
industry etc. All types of organisations have to know where is the point at which no profit or no
loss situation has arises. After that point a company can earn profits. So that it is successfully
utilised by a range of differing business.
TASK 3
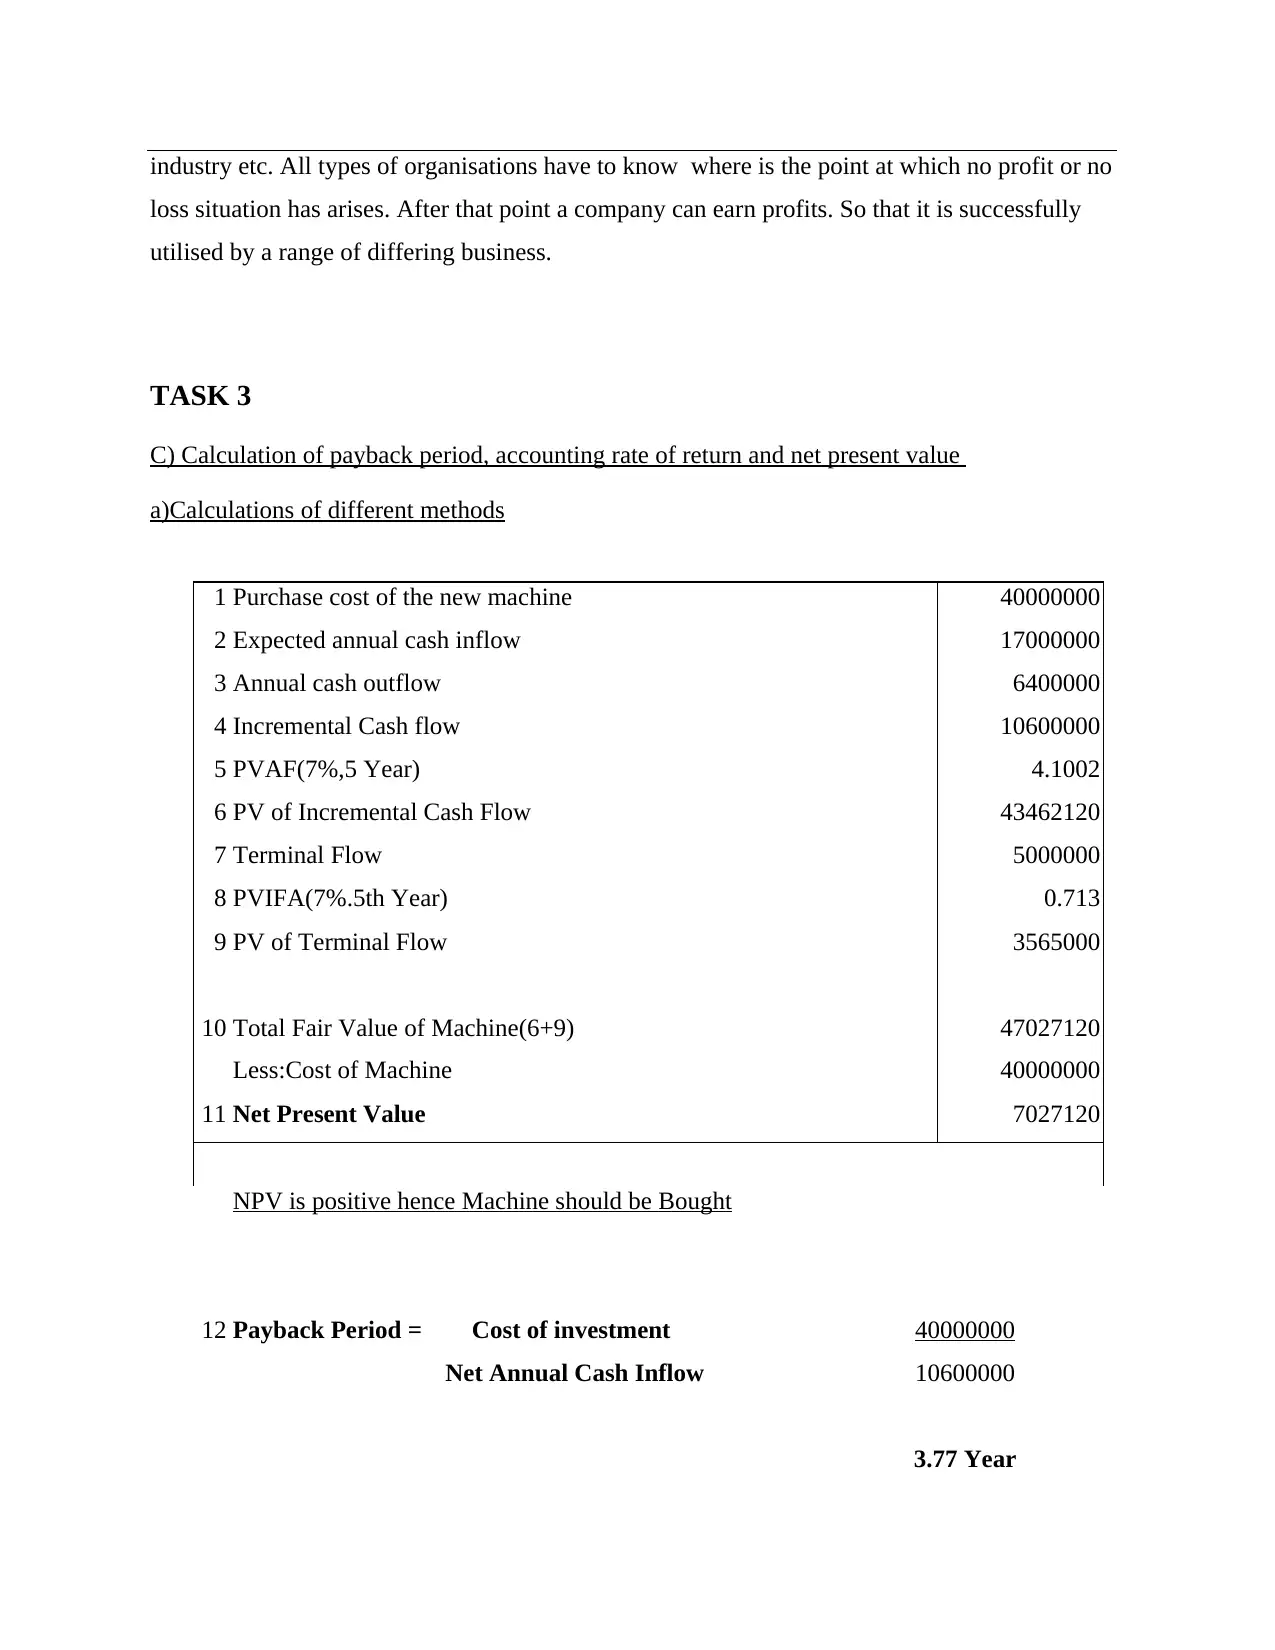
C) Calculation of payback period, accounting rate of return and net present value
a)Calculations of different methods
1 Purchase cost of the new machine 40000000
2 Expected annual cash inflow 17000000
3 Annual cash outflow 6400000
4 Incremental Cash flow 10600000
5 PVAF(7%,5 Year) 4.1002
6 PV of Incremental Cash Flow 43462120
7 Terminal Flow 5000000
8 PVIFA(7%.5th Year) 0.713
9 PV of Terminal Flow 3565000
10 Total Fair Value of Machine(6+9) 47027120
Less:Cost of Machine 40000000
11 Net Present Value 7027120
NPV is positive hence Machine should be Bought
12 Payback Period = Cost of investment 40000000
Net Annual Cash Inflow 10600000
3.77 Year
loss situation has arises. After that point a company can earn profits. So that it is successfully
utilised by a range of differing business.
TASK 3
C) Calculation of payback period, accounting rate of return and net present value
a)Calculations of different methods
1 Purchase cost of the new machine 40000000
2 Expected annual cash inflow 17000000
3 Annual cash outflow 6400000
4 Incremental Cash flow 10600000
5 PVAF(7%,5 Year) 4.1002
6 PV of Incremental Cash Flow 43462120
7 Terminal Flow 5000000
8 PVIFA(7%.5th Year) 0.713
9 PV of Terminal Flow 3565000
10 Total Fair Value of Machine(6+9) 47027120
Less:Cost of Machine 40000000
11 Net Present Value 7027120
NPV is positive hence Machine should be Bought
12 Payback Period = Cost of investment 40000000
Net Annual Cash Inflow 10600000
3.77 Year
⊘ This is a preview!⊘
Do you want full access?
Subscribe today to unlock all pages.
Trusted by 1+ million students worldwide
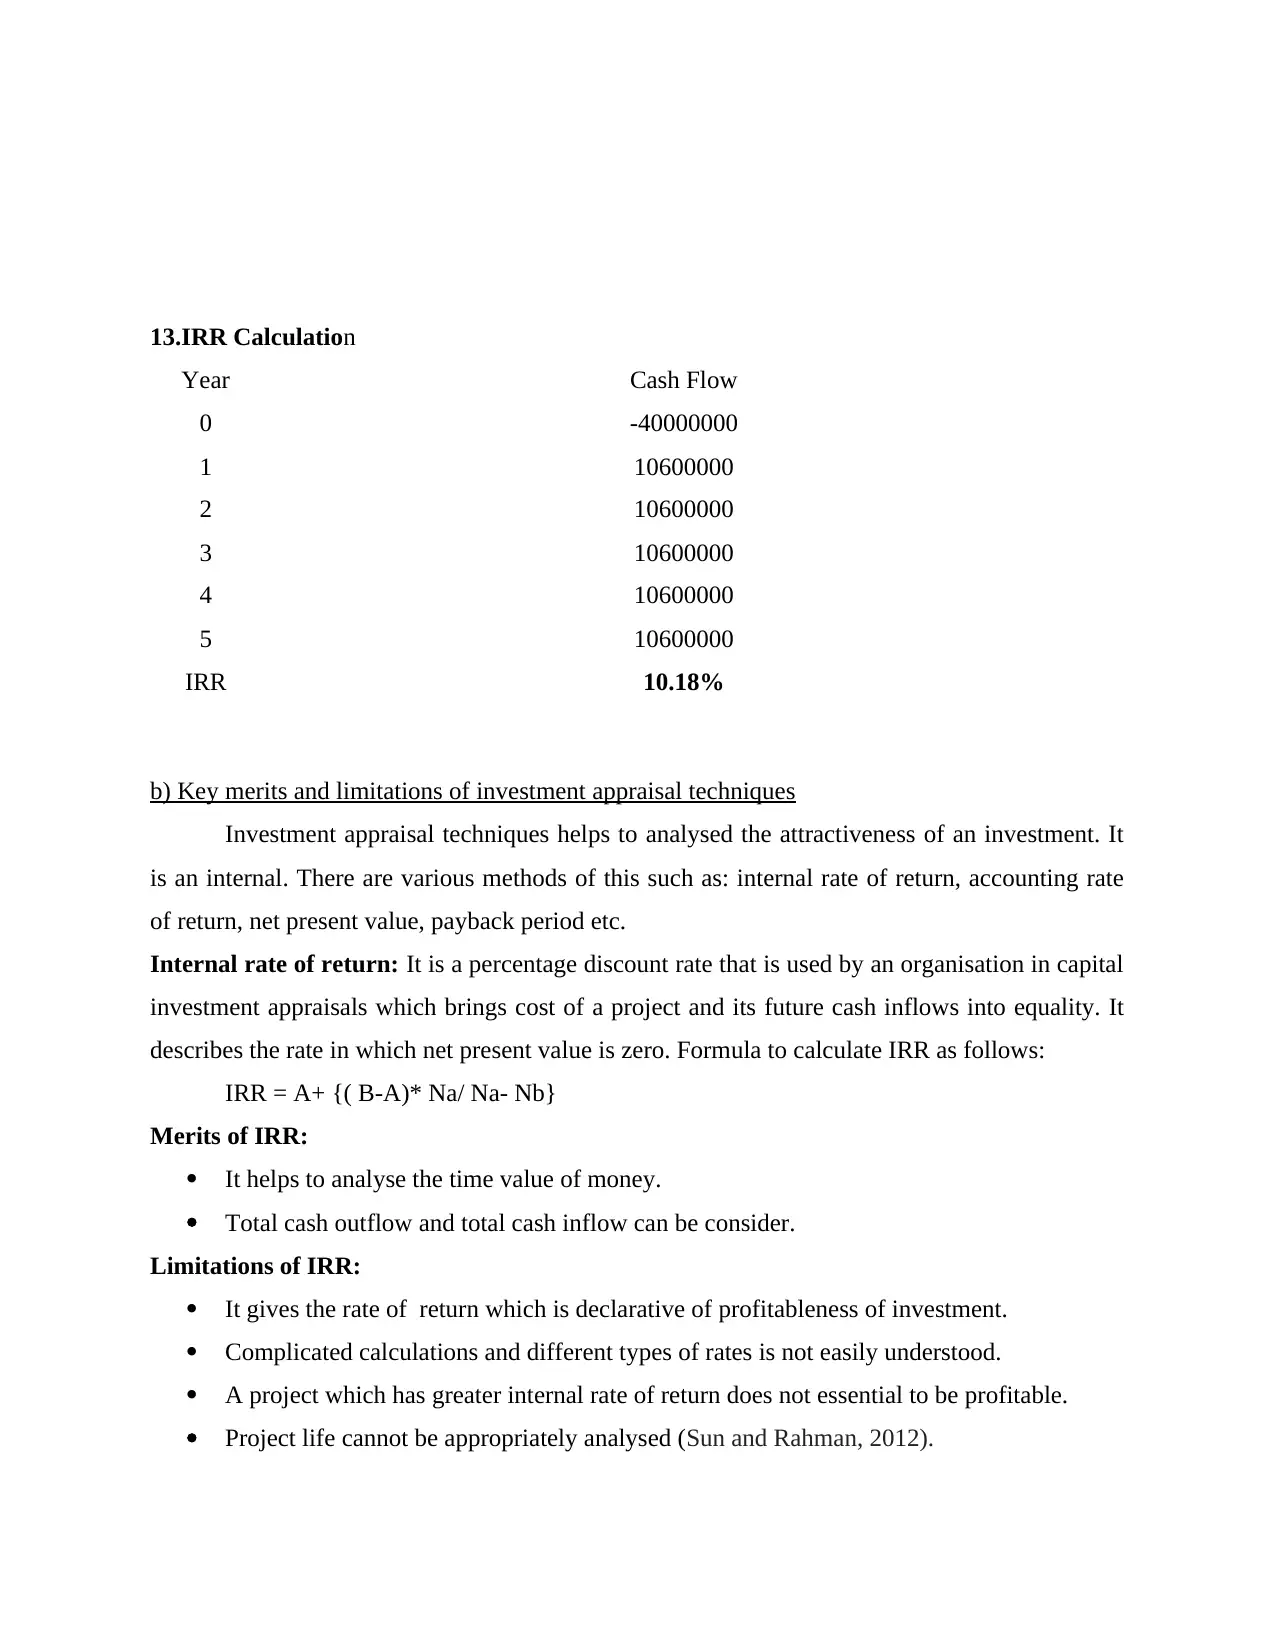
13.IRR Calculation
Year Cash Flow
0 -40000000
1 10600000
2 10600000
3 10600000
4 10600000
5 10600000
IRR 10.18%
b) Key merits and limitations of investment appraisal techniques
Investment appraisal techniques helps to analysed the attractiveness of an investment. It
is an internal. There are various methods of this such as: internal rate of return, accounting rate
of return, net present value, payback period etc.
Internal rate of return: It is a percentage discount rate that is used by an organisation in capital
investment appraisals which brings cost of a project and its future cash inflows into equality. It
describes the rate in which net present value is zero. Formula to calculate IRR as follows:
IRR = A+ {( B-A)* Na/ Na- Nb}
Merits of IRR:
It helps to analyse the time value of money.
Total cash outflow and total cash inflow can be consider.
Limitations of IRR:
It gives the rate of return which is declarative of profitableness of investment.
Complicated calculations and different types of rates is not easily understood.
A project which has greater internal rate of return does not essential to be profitable.
Project life cannot be appropriately analysed (Sun and Rahman, 2012).
Paraphrase This Document
Need a fresh take? Get an instant paraphrase of this document with our AI Paraphraser
Accounting rate of return: It is also known as return on capital employed which compare the
profits which are expected by organisation from an investment to the money they invest.
Merits:
Calculations are not tough because it makes use of promptly available accounting
information.
In this method all years are not consider to analyse the life of a project.
It helps to take better decisions because investment are ranked according to their returns.
Demerits of accounting rate of return:
Accounting time value of money is not analysed.
It does not properly calculate the rate of return of a project even if cash flows are higher
than the life of project (Schneider and Gaunt, 2012).
ARR is not effective to differentiate the value of investment needed for individual
projects.
Net present value: NPV shows the difference between present value of cash outflow and present
value of cash inflows over a specific period of time. An organisation can consider the
profitability of a project through it.
Merits:
It is depends upon estimation of cash flow so dividends, analyse shareholder's wealth.
Time value of money can be consider through it.
It is more suitable for the selection of mutually exclusive investments or projects.
Limitation net present value:
It is not easy to understand as compare to the ARR method.
When two investments are measured than this method is favourable to that project which
has more NPV.
It does not give satisfactory results because value and life of two projects are different
from each other.
Payback period: This method helps to the organisation to know that in how much time its cost
on investment can be covered. Shorter pay back period is good for the purpose of investment
decision.
Merits:
It is not complicated and easily to understand.
Organisation can invest in that projects which have shorter payback period.
This method develops insights in a persons so that it can analysed when its money get to
be repaid (Moulang, 2015).
Limitations of payback period:
It does not consider cash generation beyond the payback period.
This method fails to consider timing of returns and cost of capital.
Profitability index method: It consider the capital expenditure opportunities in the profitability
index. In this method present value of estimated future cash inflows divided by the initial outlay.
It is calculated by the following formula:
Profitability index= Present value of cash inflows/ Present value of cash outflow.
Merits:
It is used by most of organisation so that it can analyse various investment proposals.
With the help of this method an organisation can consider appropriate investment project.
By this method a company can analyse profitability through its investment project.
Limitations profitability index method
It is not easy to determine cost of capital and interest rate in this method.
Due to the differences in estimated working life of project so that comparison can not be
satisfactory.
Terminal value method: In this method estimated cash flow is reinvested in another project at a
predetermined interest rate. Reinvested process is going on until the termination of project.
Merits of this method are as follows:
In this method cash flow has reinvested after once they received.
It is easy to calculate (Mala and Chand, 2012).
Limitations of terminal value method:
It is not satisfactory because after a certain period of time it is difficult to understand the
principal amount of money which is invested by investor.
C) Identifies and explains the key benefits and limitations of using budgets as a tool for strategic
planning
Budget is defined a financial plan which includes volumes and revenues, cost and
expenses, liabilities and cash flows etc. its involves strategic plans and activities which are
consider for measuring. It is a sum of money with is intended for the purpose along with
⊘ This is a preview!⊘
Do you want full access?
Subscribe today to unlock all pages.
Trusted by 1+ million students worldwide
1 out of 20
Related Documents


Your All-in-One AI-Powered Toolkit for Academic Success.
+13062052269
info@desklib.com
Available 24*7 on WhatsApp / Email
![[object Object]](/_next/static/media/star-bottom.7253800d.svg)
Unlock your academic potential
Copyright © 2020–2026 A2Z Services. All Rights Reserved. Developed and managed by ZUCOL.