Financial Statement Analysis Report: Great Oaks Furniture Company
VerifiedAdded on 2020/05/16
|16
|1915
|100
Report
AI Summary
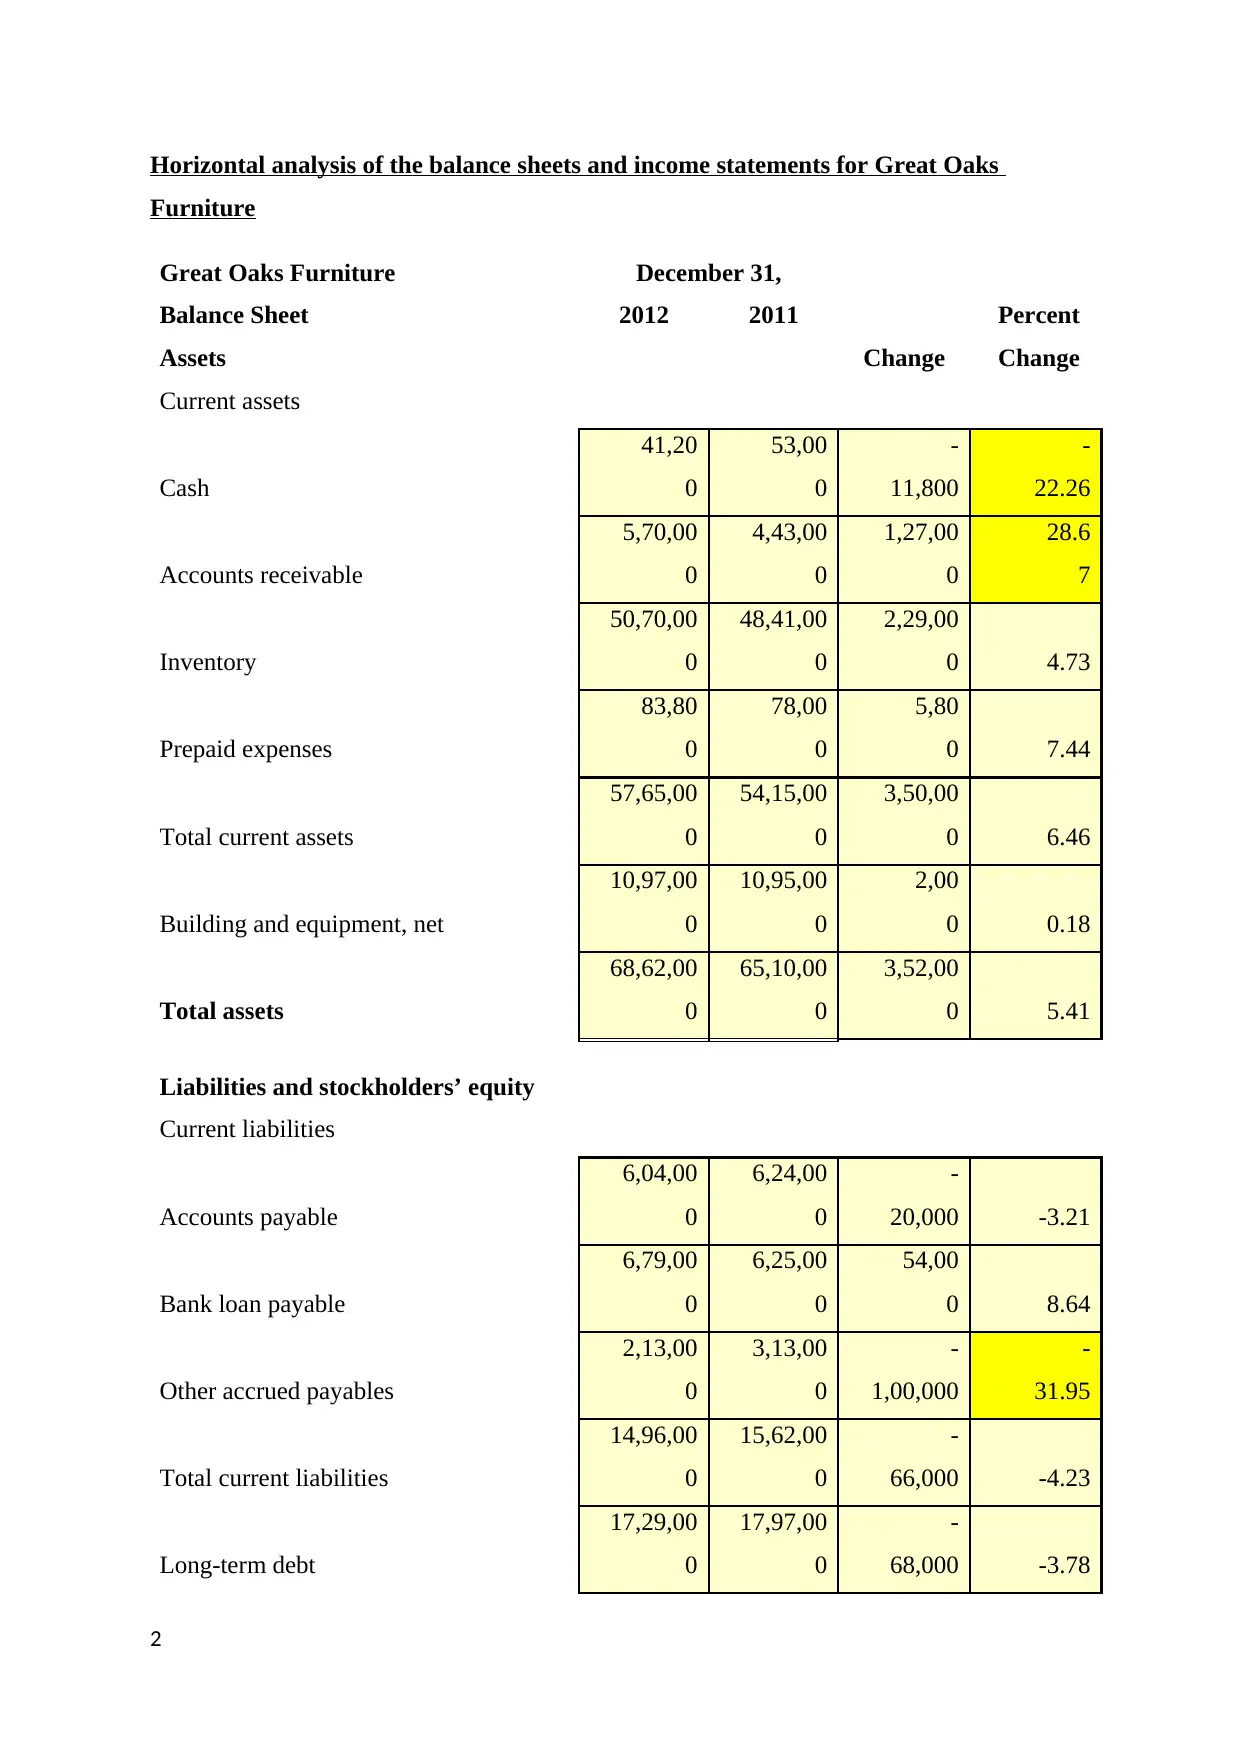
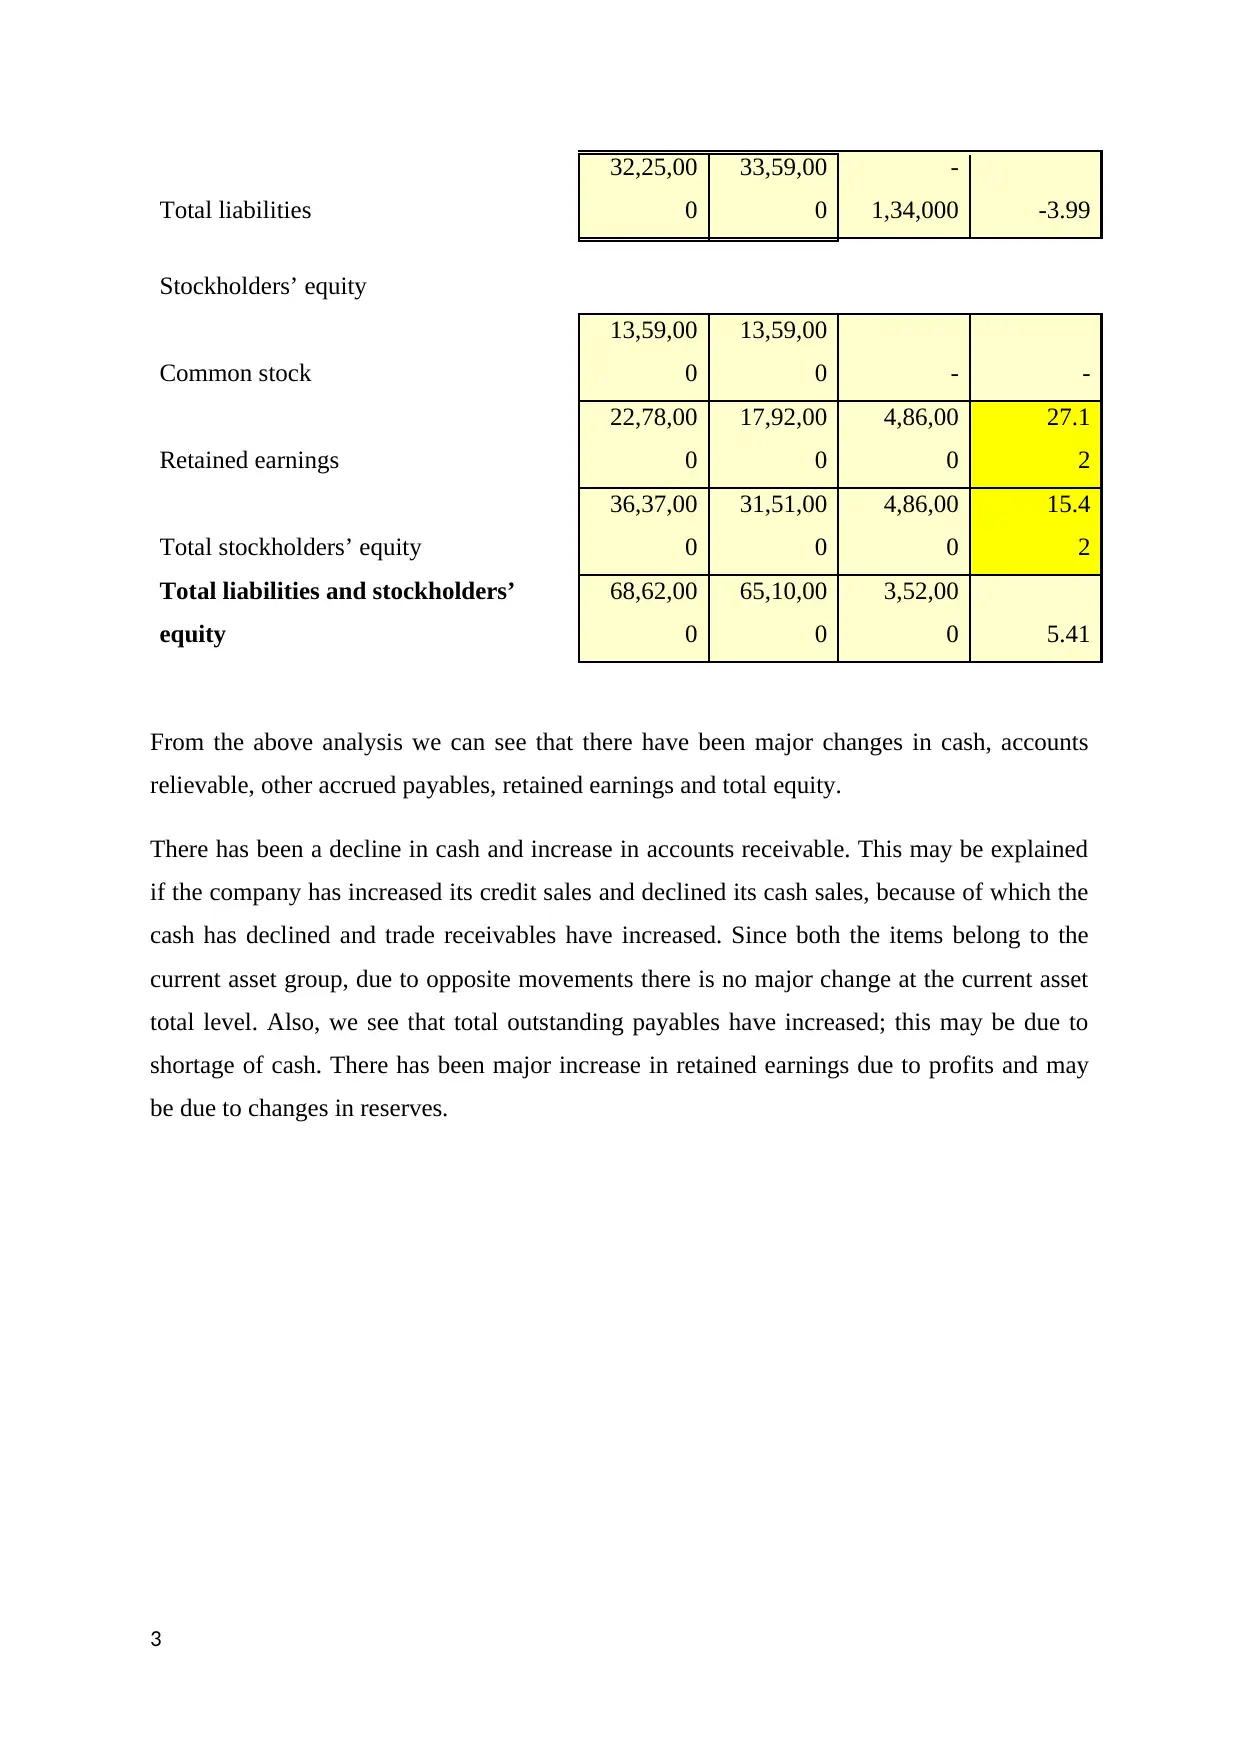
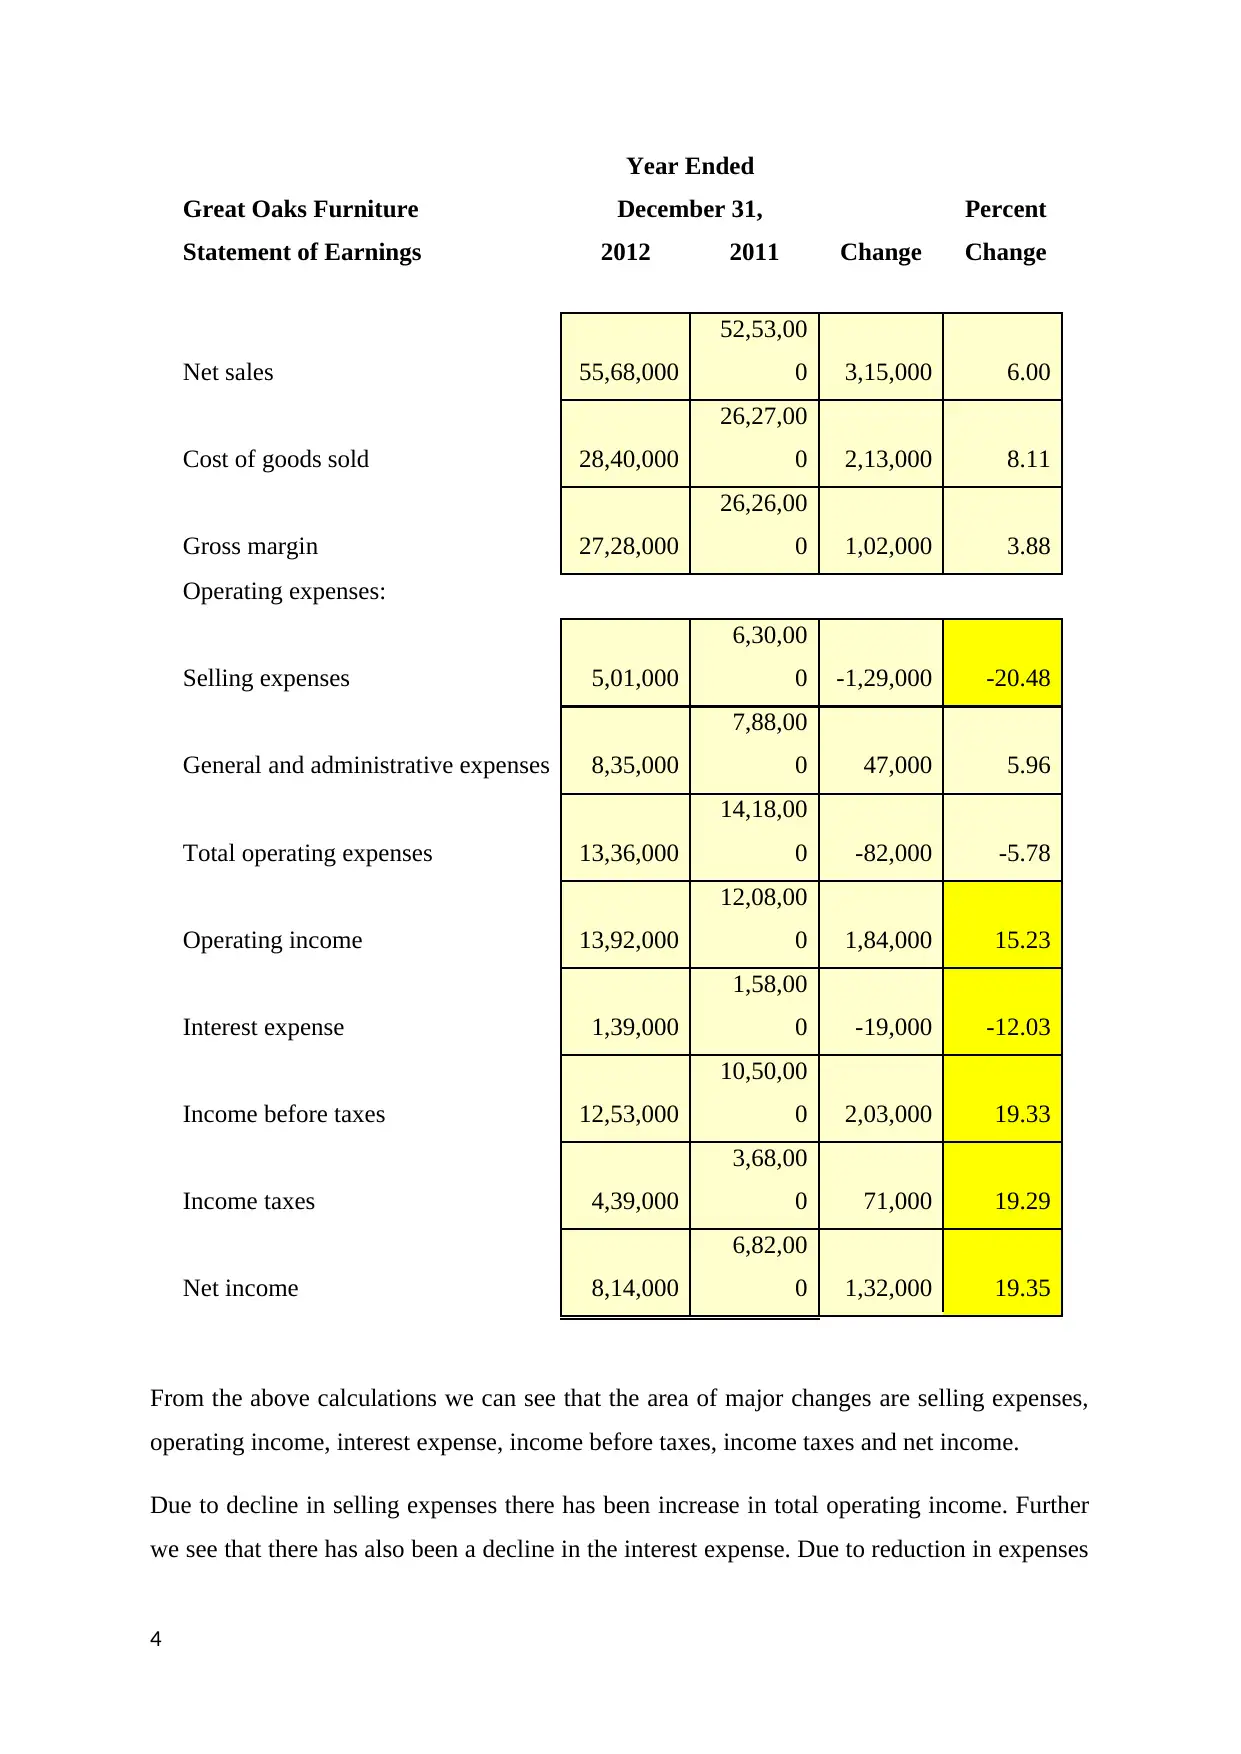
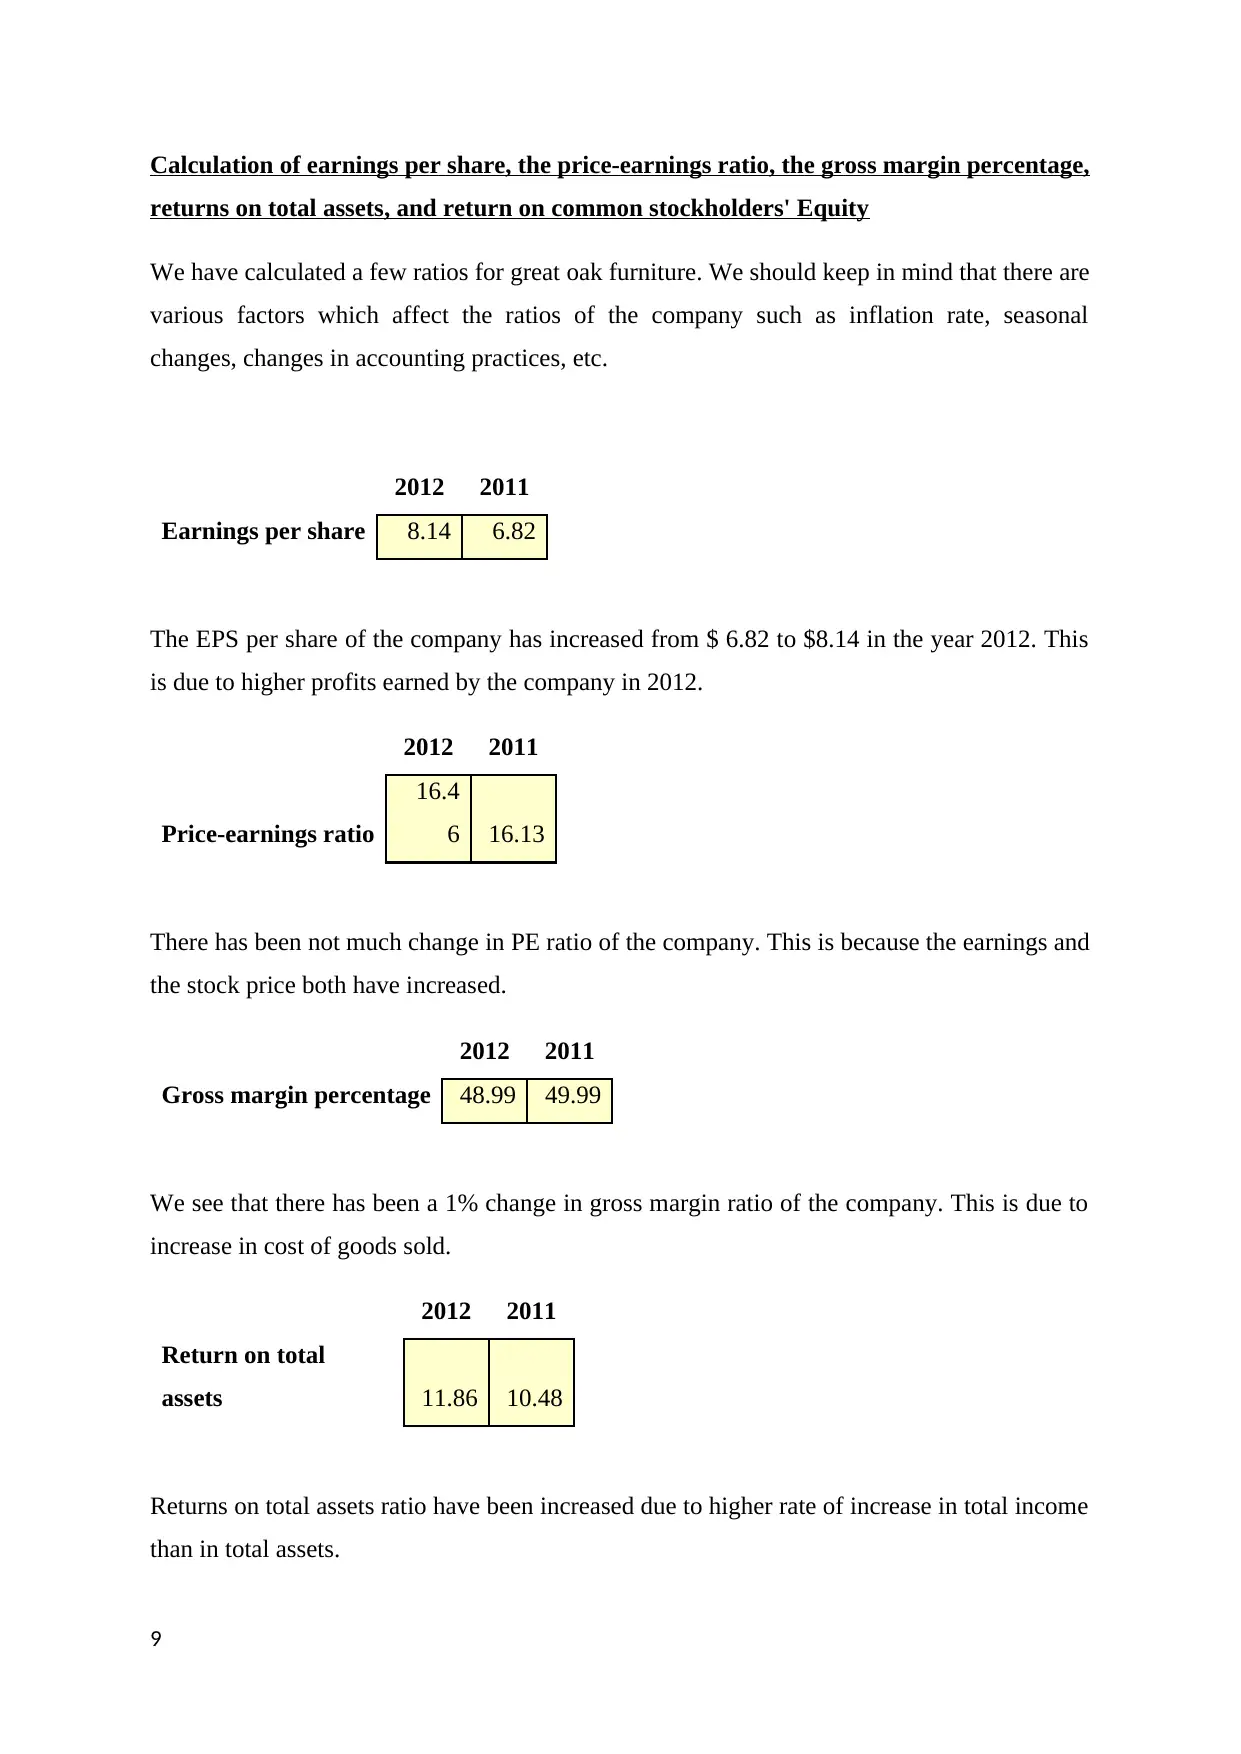
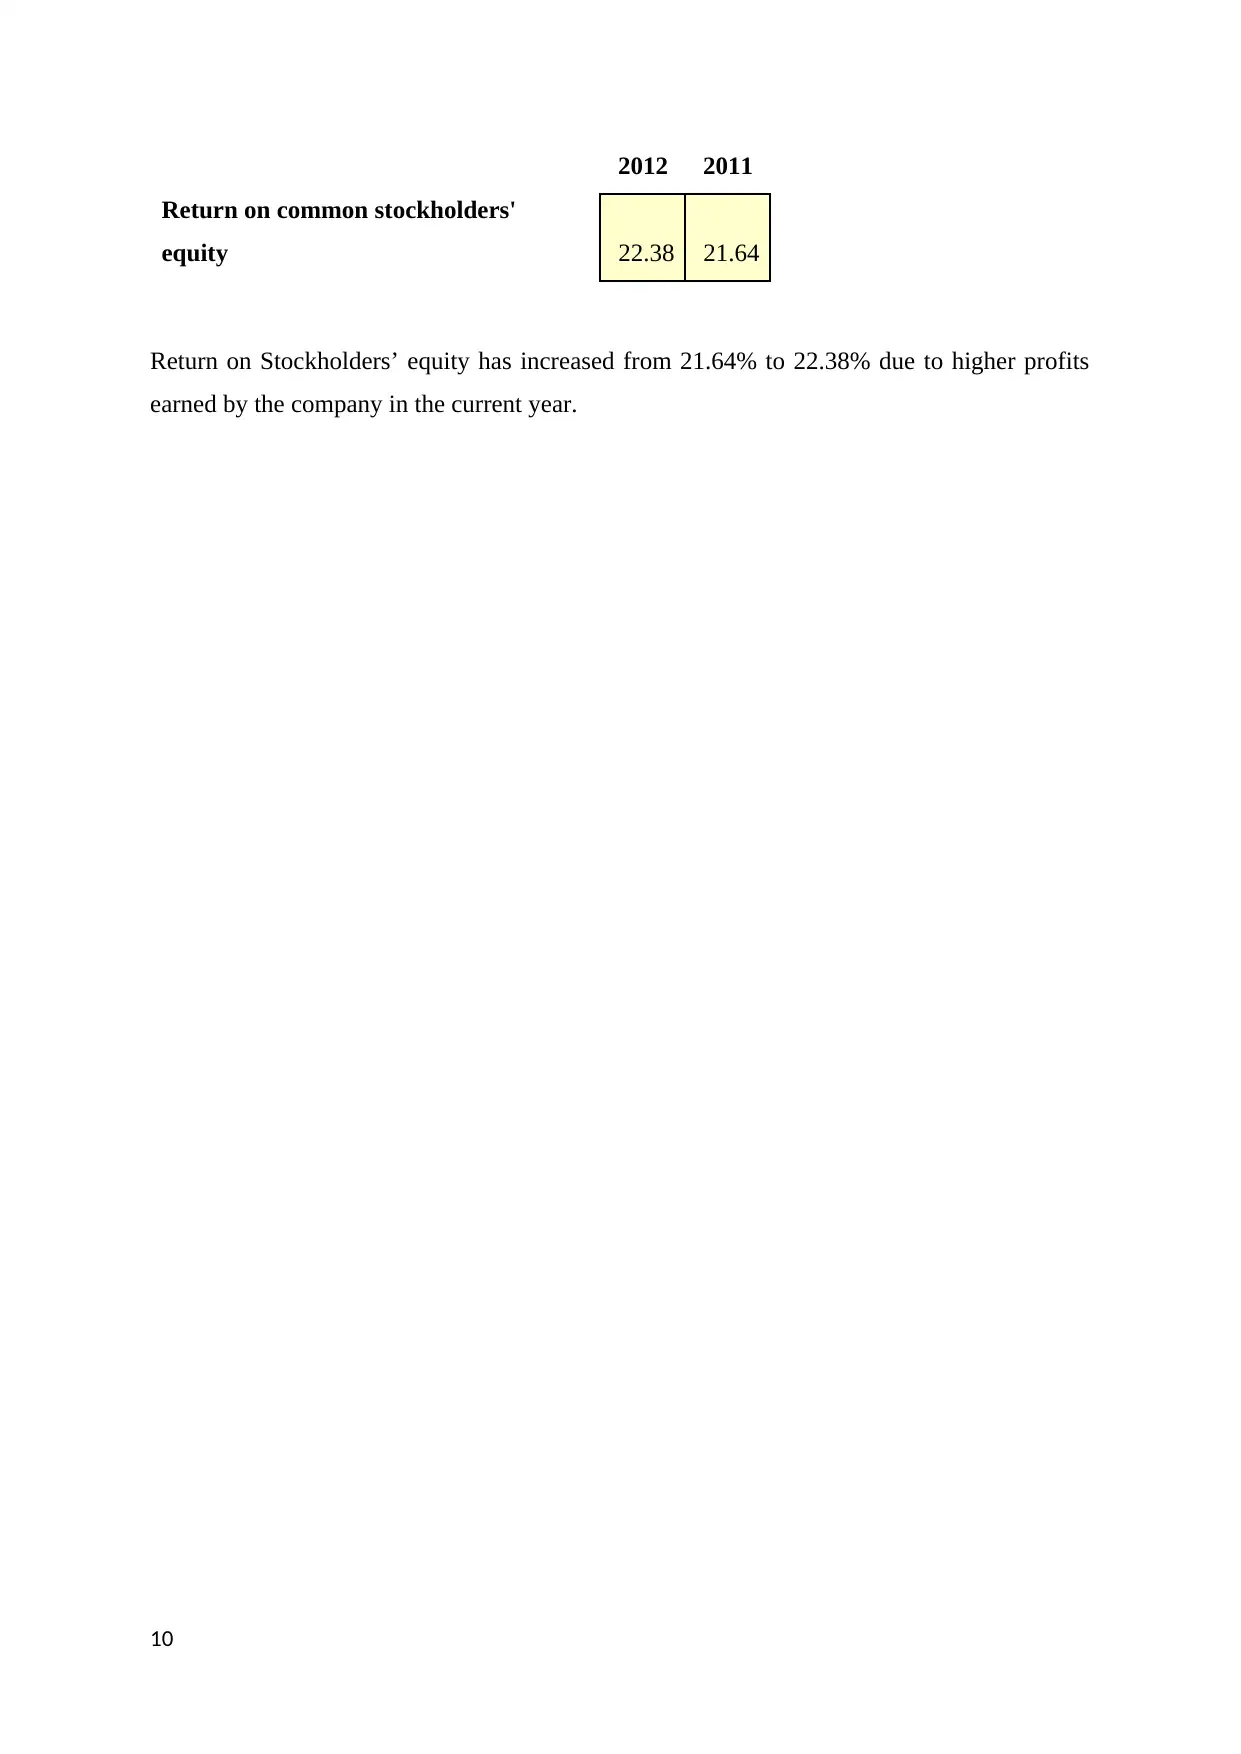
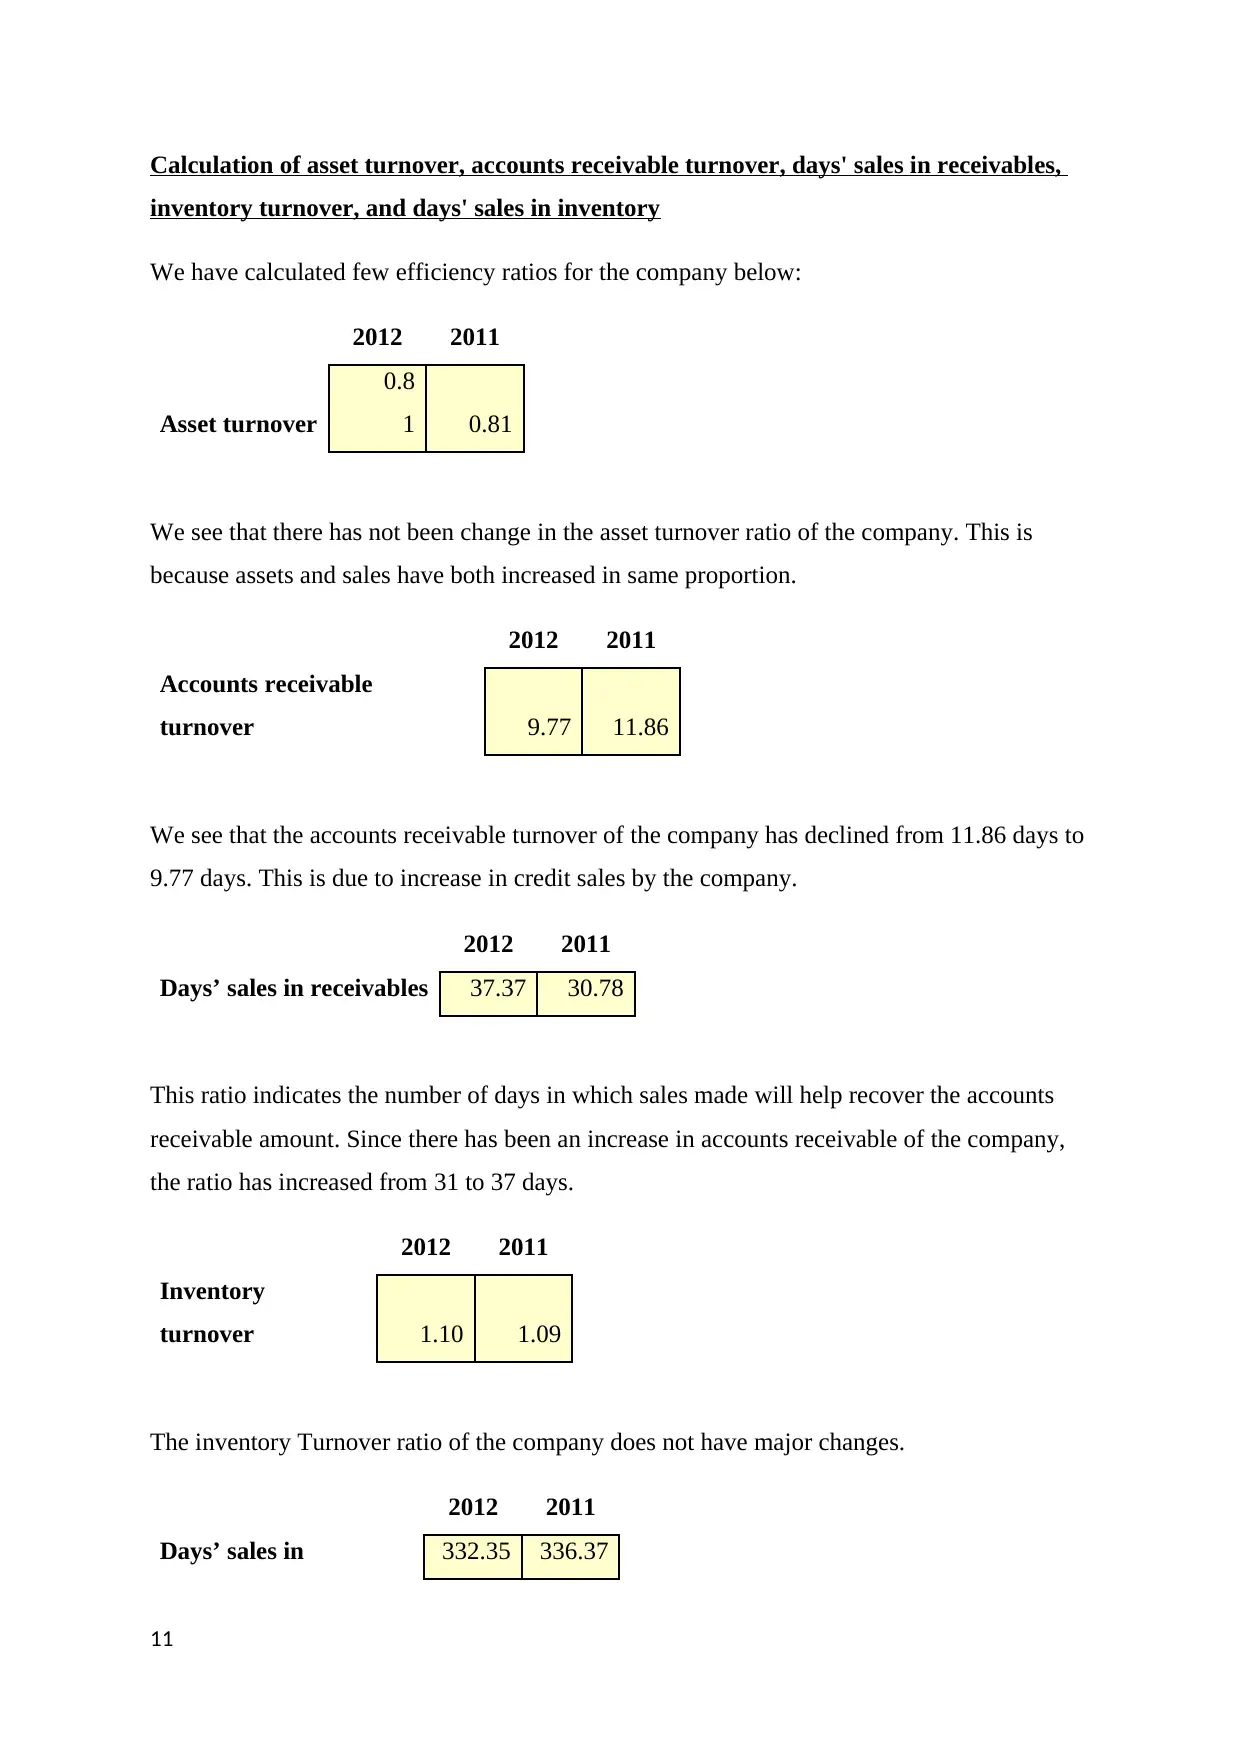
This report provides a comprehensive financial analysis of Great Oaks Furniture, examining its balance sheets and income statements for 2011 and 2012. The analysis includes horizontal and vertical analysis, highlighting significant changes in assets, liabilities, equity, revenues, and expenses. Key financial ratios such as earnings per share, price-earnings ratio, gross margin percentage, return on assets, return on equity, asset turnover, accounts receivable turnover, inventory turnover, current ratio, acid-test ratio, debt-to-equity ratio, and times interest earned are calculated and discussed. The report also explores the relationship between net income and cash flow from operations, assessing potential earnings manipulation. The findings indicate a generally stable financial structure and performance for Great Oaks Furniture, with improvements in profitability and liquidity, although the acid-test ratio is a concern. References to Fridson & Alvarez (2012) and Ittelson (2009) support the analysis.

MANAGEMENT ACCOUNTING
1
1
Paraphrase This Document
Need a fresh take? Get an instant paraphrase of this document with our AI Paraphraser

Horizontal analysis of the balance sheets and income statements for Great Oaks
Furniture
Great Oaks Furniture December 31,
Balance Sheet 2012 2011
Change
Percent
Assets Change
Current assets
Cash
41,20
0
53,00
0
-
11,800
-
22.26
Accounts receivable
5,70,00
0
4,43,00
0
1,27,00
0
28.6
7
Inventory
50,70,00
0
48,41,00
0
2,29,00
0 4.73
Prepaid expenses
83,80
0
78,00
0
5,80
0 7.44
Total current assets
57,65,00
0
54,15,00
0
3,50,00
0 6.46
Building and equipment, net
10,97,00
0
10,95,00
0
2,00
0 0.18
Total assets
68,62,00
0
65,10,00
0
3,52,00
0 5.41
Liabilities and stockholders’ equity
Current liabilities
Accounts payable
6,04,00
0
6,24,00
0
-
20,000 -3.21
Bank loan payable
6,79,00
0
6,25,00
0
54,00
0 8.64
Other accrued payables
2,13,00
0
3,13,00
0
-
1,00,000
-
31.95
Total current liabilities
14,96,00
0
15,62,00
0
-
66,000 -4.23
Long-term debt
17,29,00
0
17,97,00
0
-
68,000 -3.78
2

Total liabilities
32,25,00
0
33,59,00
0
-
1,34,000 -3.99
Stockholders’ equity
Common stock
13,59,00
0
13,59,00
0 - -
Retained earnings
22,78,00
0
17,92,00
0
4,86,00
0
27.1
2
Total stockholders’ equity
36,37,00
0
31,51,00
0
4,86,00
0
15.4
2
Total liabilities and stockholders’
equity
68,62,00
0
65,10,00
0
3,52,00
0 5.41
From the above analysis we can see that there have been major changes in cash, accounts
relievable, other accrued payables, retained earnings and total equity.
There has been a decline in cash and increase in accounts receivable. This may be explained
if the company has increased its credit sales and declined its cash sales, because of which the
cash has declined and trade receivables have increased. Since both the items belong to the
current asset group, due to opposite movements there is no major change at the current asset
total level. Also, we see that total outstanding payables have increased; this may be due to
shortage of cash. There has been major increase in retained earnings due to profits and may
be due to changes in reserves.
3
⊘ This is a preview!⊘
Do you want full access?
Subscribe today to unlock all pages.

Trusted by 1+ million students worldwide

Year Ended
Great Oaks Furniture December 31,
Change
Percent
Statement of Earnings 2012 2011 Change
Net sales 55,68,000
52,53,00
0 3,15,000 6.00
Cost of goods sold 28,40,000
26,27,00
0 2,13,000 8.11
Gross margin 27,28,000
26,26,00
0 1,02,000 3.88
Operating expenses:
Selling expenses 5,01,000
6,30,00
0 -1,29,000 -20.48
General and administrative expenses 8,35,000
7,88,00
0 47,000 5.96
Total operating expenses 13,36,000
14,18,00
0 -82,000 -5.78
Operating income 13,92,000
12,08,00
0 1,84,000 15.23
Interest expense 1,39,000
1,58,00
0 -19,000 -12.03
Income before taxes 12,53,000
10,50,00
0 2,03,000 19.33
Income taxes 4,39,000
3,68,00
0 71,000 19.29
Net income 8,14,000
6,82,00
0 1,32,000 19.35
From the above calculations we can see that the area of major changes are selling expenses,
operating income, interest expense, income before taxes, income taxes and net income.
Due to decline in selling expenses there has been increase in total operating income. Further
we see that there has also been a decline in the interest expense. Due to reduction in expenses
4
Paraphrase This Document
Need a fresh take? Get an instant paraphrase of this document with our AI Paraphraser

the incomes before taxes have increased by almost 19%. Further, we see that there has been
an increase in income tax expense; this is due to higher taxable income, reason for which has
already been explained. This overall leaves us with a 19% increased net income. Therefore,
reduction in expenses has resulted in higher profits and higher taxes.
5
an increase in income tax expense; this is due to higher taxable income, reason for which has
already been explained. This overall leaves us with a 19% increased net income. Therefore,
reduction in expenses has resulted in higher profits and higher taxes.
5

Vertical analysis of the balance sheets and income statements for Great Oaks Furniture
Great Oaks Furniture
Balance Sheets
December 31, 2012 December 31, 2011
Assets
Current assets
Cash 41,200 0.60 53,000 0.81
Accounts receivable 5,70,000 8.31 4,43,000 6.80
Inventory 50,70,000 73.89 48,41,000 74.36
Prepaid expenses 83,800 1.22 78,000 1.20
Total current assets 57,65,000 84.01 54,15,000 83.18
Building and equip, net 10,97,000 15.99 10,95,000 16.82
Total assets 68,62,000 100.00 65,10,000 100.00
Liabilities and stockholders’ equity
Current liabilities
Accounts payable 6,04,000 18.73 6,24,000 18.58
Bank loan payable 6,79,000 21.05 6,25,000 18.61
Other accrued payables 2,13,000 6.60 3,13,000 9.32
Total current liabilities 14,96,000 46.39 15,62,000 46.50
Long-term debt 17,29,000 53.61 17,97,000 53.50
Total liabilities 32,25,000 100.00 33,59,000 100.00
Stockholders’ equity
Common stock 13,59,000 37.37 13,59,000 43.13
Retained earnings 22,78,000 62.63 17,92,000 56.87
Total stockholders’ equity 36,37,000 100.00 31,51,000 100.00
Total liabilities and stockholders’ equity 68,62,000 65,10,000
From the above calculations we see that in the assets section the proportion of weight-age
have not changed from last year. The current assets form 83-84% of the total assets and the
remaining is covered by non-current assets.
6
⊘ This is a preview!⊘
Do you want full access?
Subscribe today to unlock all pages.

Trusted by 1+ million students worldwide

Same is the case with total liabilities section. The current liabilities make up about 47% of the
total liabilities and the remaining is covered by long term debt. In the stock holders equity we
can see that the proportion of retained earnings have increased from 57% to 63%, which has
resulted in fall of common stock share in total stockholders’ equity. Therefore, we can say
that vertically there are not many changes in the balance sheet of Great Oaks Furniture.
7
Paraphrase This Document
Need a fresh take? Get an instant paraphrase of this document with our AI Paraphraser

Statement of Earnings
December 31, 2012 December 31, 2011
Net sales 55,68,000 100.00 52,53,000 100.00
Cost of goods sold 28,40,000 51.01 26,27,000 50.01
Gross margin 27,28,000 48.99 26,26,000 49.99
Operating expenses:
Selling expenses 5,01,000 9.00 6,30,000 11.99
General and admin exp 8,35,000 15.00 7,88,000 15.00
Total operating expenses 13,36,000 23.99 14,18,000 26.99
Operating income 13,92,000 25.00 12,08,000 23.00
Interest expense 1,39,000 2.50 1,58,000 3.01
Income before taxes 12,53,000 22.50 10,50,000 19.99
Income taxes 4,39,000 7.88 3,68,000 7.01
Net income 8,14,000 14.62 6,82,000 12.98
From the above calculations we can say that there are not many changes in the statement of
earnings of great oak furniture vertically. The proportions of expenses have been more or less
in a similar trend. Only a little change has been noticed in the selling expense and interest
expense. The net income of the company has increased from 12.98% to 14.62%. The major
contributors to increase in net income are decline in selling and interest expenses. (Fridson &
Alvarez, 2012)
8

Calculation of earnings per share, the price-earnings ratio, the gross margin percentage,
returns on total assets, and return on common stockholders' Equity
We have calculated a few ratios for great oak furniture. We should keep in mind that there are
various factors which affect the ratios of the company such as inflation rate, seasonal
changes, changes in accounting practices, etc.
2012 2011
Earnings per share 8.14 6.82
The EPS per share of the company has increased from $ 6.82 to $8.14 in the year 2012. This
is due to higher profits earned by the company in 2012.
2012 2011
Price-earnings ratio
16.4
6 16.13
There has been not much change in PE ratio of the company. This is because the earnings and
the stock price both have increased.
2012 2011
Gross margin percentage 48.99 49.99
We see that there has been a 1% change in gross margin ratio of the company. This is due to
increase in cost of goods sold.
2012 2011
Return on total
assets 11.86 10.48
Returns on total assets ratio have been increased due to higher rate of increase in total income
than in total assets.
9
⊘ This is a preview!⊘
Do you want full access?
Subscribe today to unlock all pages.

Trusted by 1+ million students worldwide

2012 2011
Return on common stockholders'
equity 22.38 21.64
Return on Stockholders’ equity has increased from 21.64% to 22.38% due to higher profits
earned by the company in the current year.
10
Return on common stockholders'
equity 22.38 21.64
Return on Stockholders’ equity has increased from 21.64% to 22.38% due to higher profits
earned by the company in the current year.
10
Paraphrase This Document
Need a fresh take? Get an instant paraphrase of this document with our AI Paraphraser

Calculation of asset turnover, accounts receivable turnover, days' sales in receivables,
inventory turnover, and days' sales in inventory
We have calculated few efficiency ratios for the company below:
2012 2011
Asset turnover
0.8
1 0.81
We see that there has not been change in the asset turnover ratio of the company. This is
because assets and sales have both increased in same proportion.
2012 2011
Accounts receivable
turnover 9.77 11.86
We see that the accounts receivable turnover of the company has declined from 11.86 days to
9.77 days. This is due to increase in credit sales by the company.
2012 2011
Days’ sales in receivables 37.37 30.78
This ratio indicates the number of days in which sales made will help recover the accounts
receivable amount. Since there has been an increase in accounts receivable of the company,
the ratio has increased from 31 to 37 days.
2012 2011
Inventory
turnover 1.10 1.09
The inventory Turnover ratio of the company does not have major changes.
2012 2011
Days’ sales in 332.35 336.37
11

inventory
Since there is not much change in the inventory turnover the days sales in inventory ratio also
has not changed much.
12
Since there is not much change in the inventory turnover the days sales in inventory ratio also
has not changed much.
12
⊘ This is a preview!⊘
Do you want full access?
Subscribe today to unlock all pages.

Trusted by 1+ million students worldwide
1 out of 16
Related Documents

Your All-in-One AI-Powered Toolkit for Academic Success.
+13062052269
info@desklib.com
Available 24*7 on WhatsApp / Email
Unlock your academic potential
Copyright © 2020–2025 A2Z Services. All Rights Reserved. Developed and managed by ZUCOL.


