Evaluating Business Strategies for Green Motor Ltd's Success
VerifiedAdded on 2020/05/04
|11
|2579
|54
AI Summary
Green Motor Ltd has experienced significant sales declines due to increased competition in the automobile parts sector. To address this challenge, the company is evaluating various financial and operational strategies. The assignment includes a detailed analysis of the company's current situation, focusing on fixed versus variable costs, pricing adjustments, profit maximization techniques, and performance measurement systems. A comprehensive review of the first half-year data reveals insights into sales patterns, profitability, and cost structures, while proposals for strategic improvements are suggested to enhance Green Motor Ltd’s market position. The study emphasizes the importance of adapting cost management strategies in response to fluctuating market dynamics and leveraging performance metrics to drive decision-making processes.
11/7/2017
Student Name
Performance Management - Green Motor Ltd
Student Name
Performance Management - Green Motor Ltd
Paraphrase This Document
Need a fresh take? Get an instant paraphrase of this document with our AI Paraphraser
Contents
Introduction......................................................................................................................................1
How the Economist’s and Accountant’s breakeven charts differ....................................................1
Economist’s breakeven chart.......................................................................................................1
Accountants Breakeven Chart......................................................................................................1
Defining period of time, relevant range and fixed cost...................................................................2
Breakeven Point and Margin of Safety of the company..................................................................2
Recommendation to the Managing Director on Selecting Proposal................................................3
Proposal analysis..........................................................................................................................4
Proposal 1.....................................................................................................................................4
Proposal 2.....................................................................................................................................4
The Better Proposal......................................................................................................................4
Conclusion.......................................................................................................................................5
Introduction
It is critical for any new business to undertake a performance management evaluation to
determine the businesses and identify a position at which the business is likely to break even on
its investment and begin registering profits. This helps determine the number of products and
time Green Motor Ltd needs to sell before it begins registering profits. It also helps determine
how long the business will take to repay loans or capital invested into the business. This makes it
critical for any new business to evaluate performance and undertake analysis so as to secure this
data which can be used to improve the on areas of weakness (Bacal, 2012).
How the Economist’s and Accountant’s breakeven charts differ
It is important to understand predicted economists breakeven chart differs from the accountant's
break-even charts but both must be analysed together to help deliver a clear vision linked to
breaking even analysis (Media, 2017).
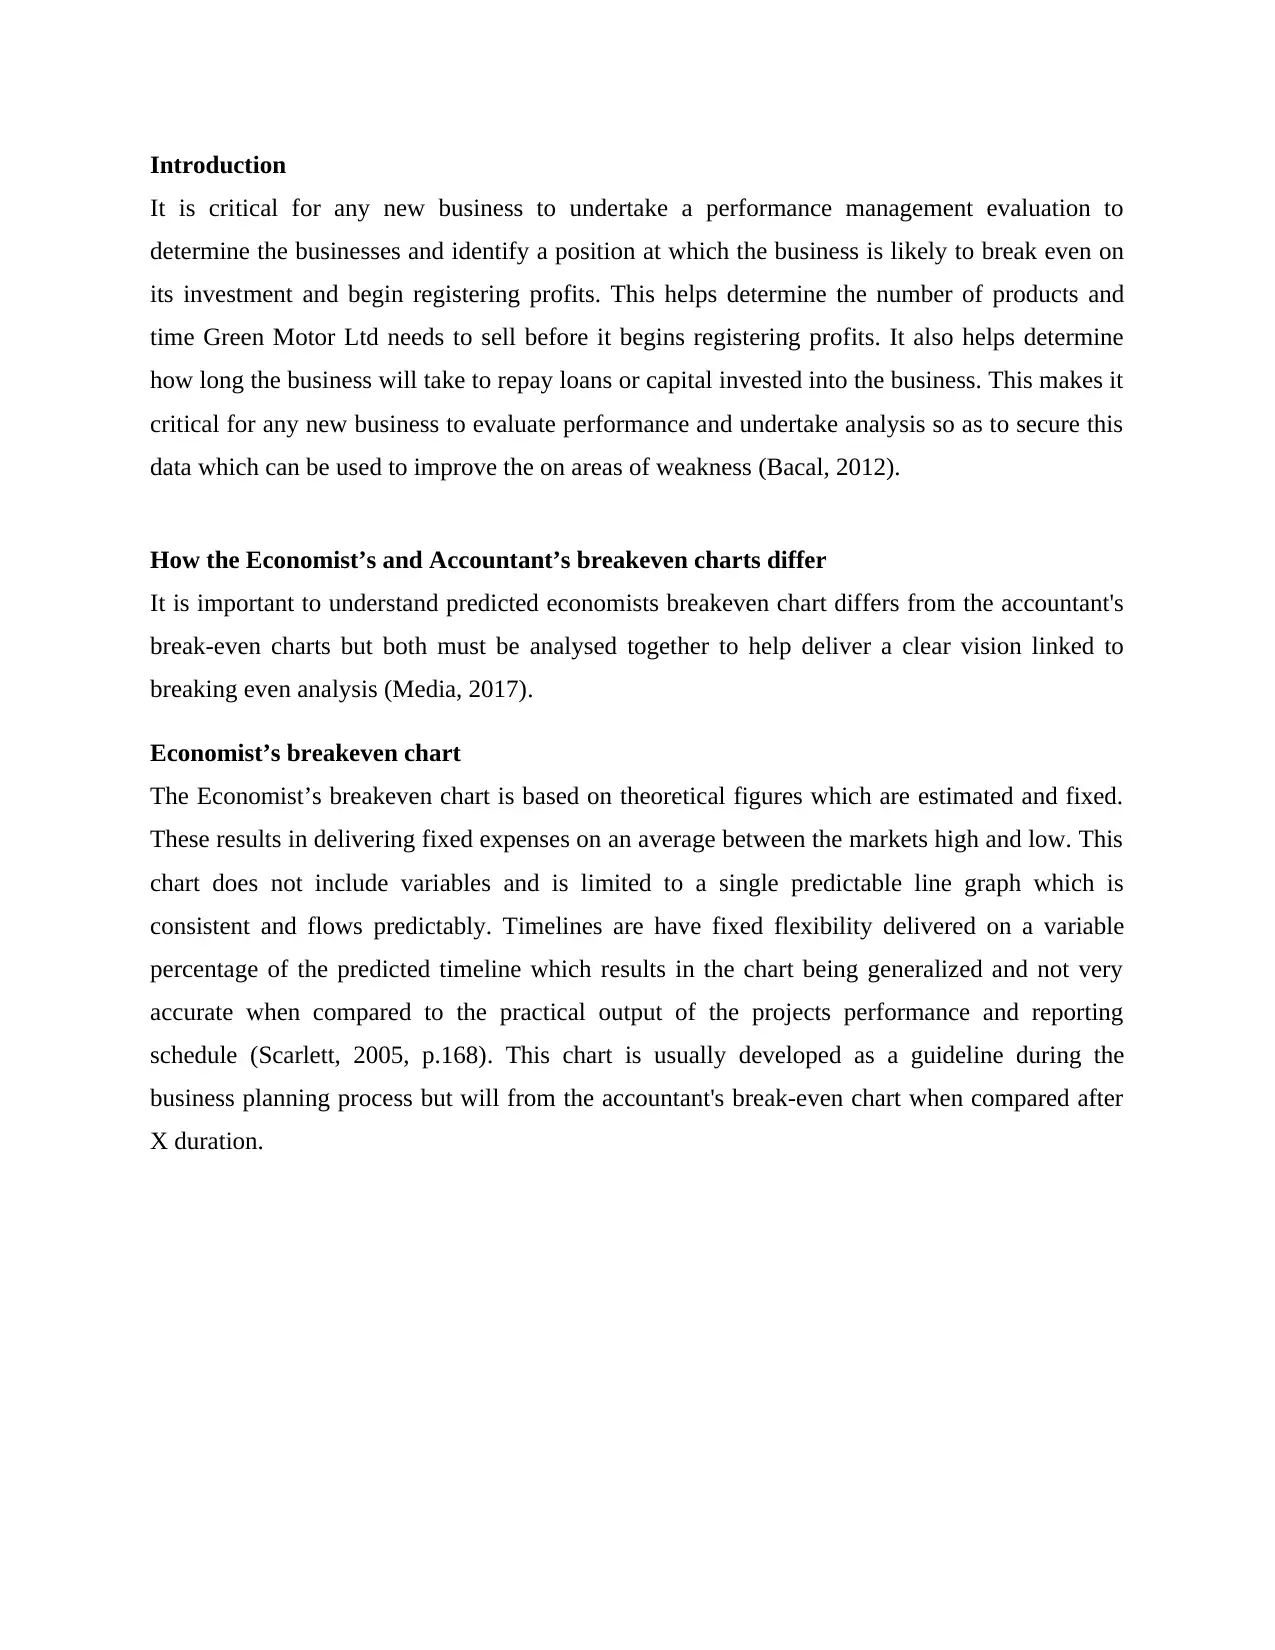
Economist’s breakeven chart
The Economist’s breakeven chart is based on theoretical figures which are estimated and fixed.
These results in delivering fixed expenses on an average between the markets high and low. This
chart does not include variables and is limited to a single predictable line graph which is
consistent and flows predictably. Timelines are have fixed flexibility delivered on a variable
percentage of the predicted timeline which results in the chart being generalized and not very
accurate when compared to the practical output of the projects performance and reporting
schedule (Scarlett, 2005, p.168). This chart is usually developed as a guideline during the
business planning process but will from the accountant's break-even chart when compared after
X duration.
It is critical for any new business to undertake a performance management evaluation to
determine the businesses and identify a position at which the business is likely to break even on
its investment and begin registering profits. This helps determine the number of products and
time Green Motor Ltd needs to sell before it begins registering profits. It also helps determine
how long the business will take to repay loans or capital invested into the business. This makes it
critical for any new business to evaluate performance and undertake analysis so as to secure this
data which can be used to improve the on areas of weakness (Bacal, 2012).
How the Economist’s and Accountant’s breakeven charts differ
It is important to understand predicted economists breakeven chart differs from the accountant's
break-even charts but both must be analysed together to help deliver a clear vision linked to
breaking even analysis (Media, 2017).
Economist’s breakeven chart
The Economist’s breakeven chart is based on theoretical figures which are estimated and fixed.
These results in delivering fixed expenses on an average between the markets high and low. This
chart does not include variables and is limited to a single predictable line graph which is
consistent and flows predictably. Timelines are have fixed flexibility delivered on a variable
percentage of the predicted timeline which results in the chart being generalized and not very
accurate when compared to the practical output of the projects performance and reporting
schedule (Scarlett, 2005, p.168). This chart is usually developed as a guideline during the
business planning process but will from the accountant's break-even chart when compared after
X duration.
⊘ This is a preview!⊘
Do you want full access?
Subscribe today to unlock all pages.
Trusted by 1+ million students worldwide
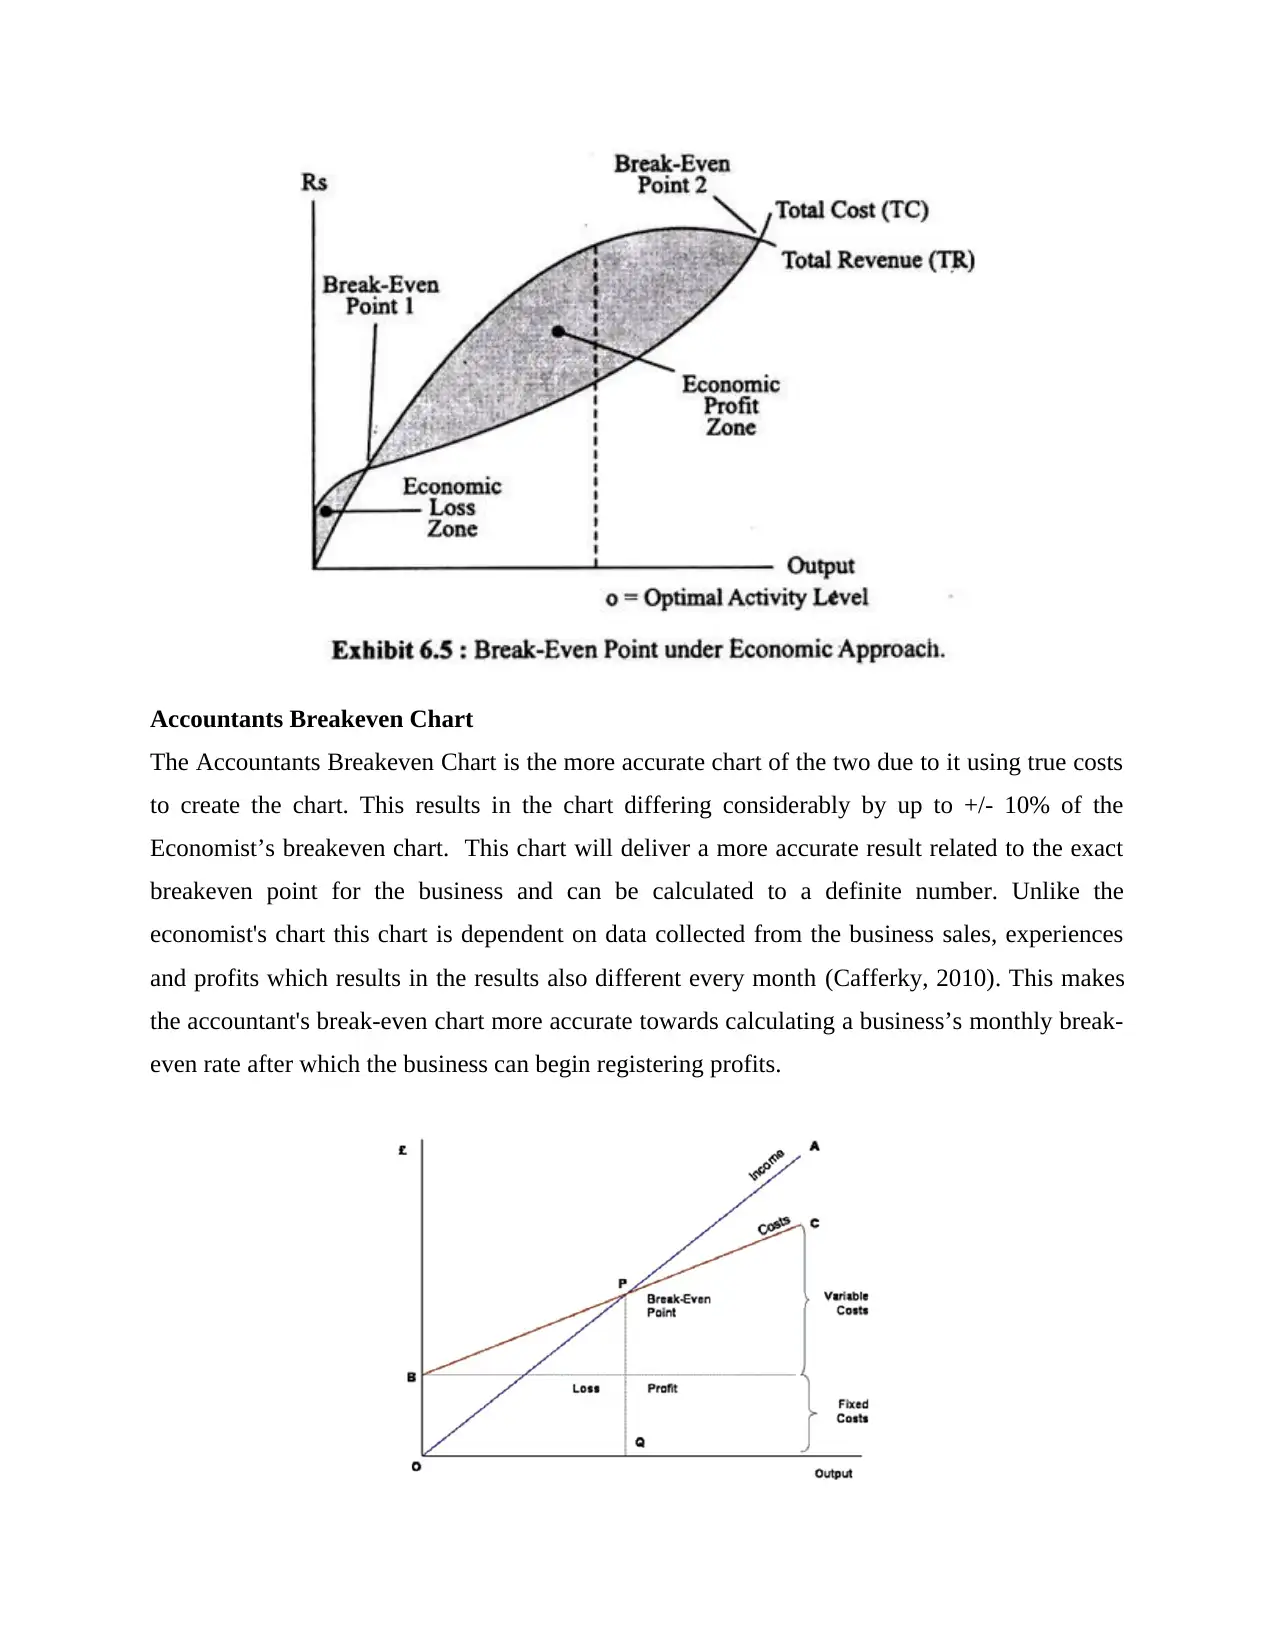
Accountants Breakeven Chart
The Accountants Breakeven Chart is the more accurate chart of the two due to it using true costs
to create the chart. This results in the chart differing considerably by up to +/- 10% of the
Economist’s breakeven chart. This chart will deliver a more accurate result related to the exact
breakeven point for the business and can be calculated to a definite number. Unlike the
economist's chart this chart is dependent on data collected from the business sales, experiences
and profits which results in the results also different every month (Cafferky, 2010). This makes
the accountant's break-even chart more accurate towards calculating a business’s monthly break-
even rate after which the business can begin registering profits.
Paraphrase This Document
Need a fresh take? Get an instant paraphrase of this document with our AI Paraphraser
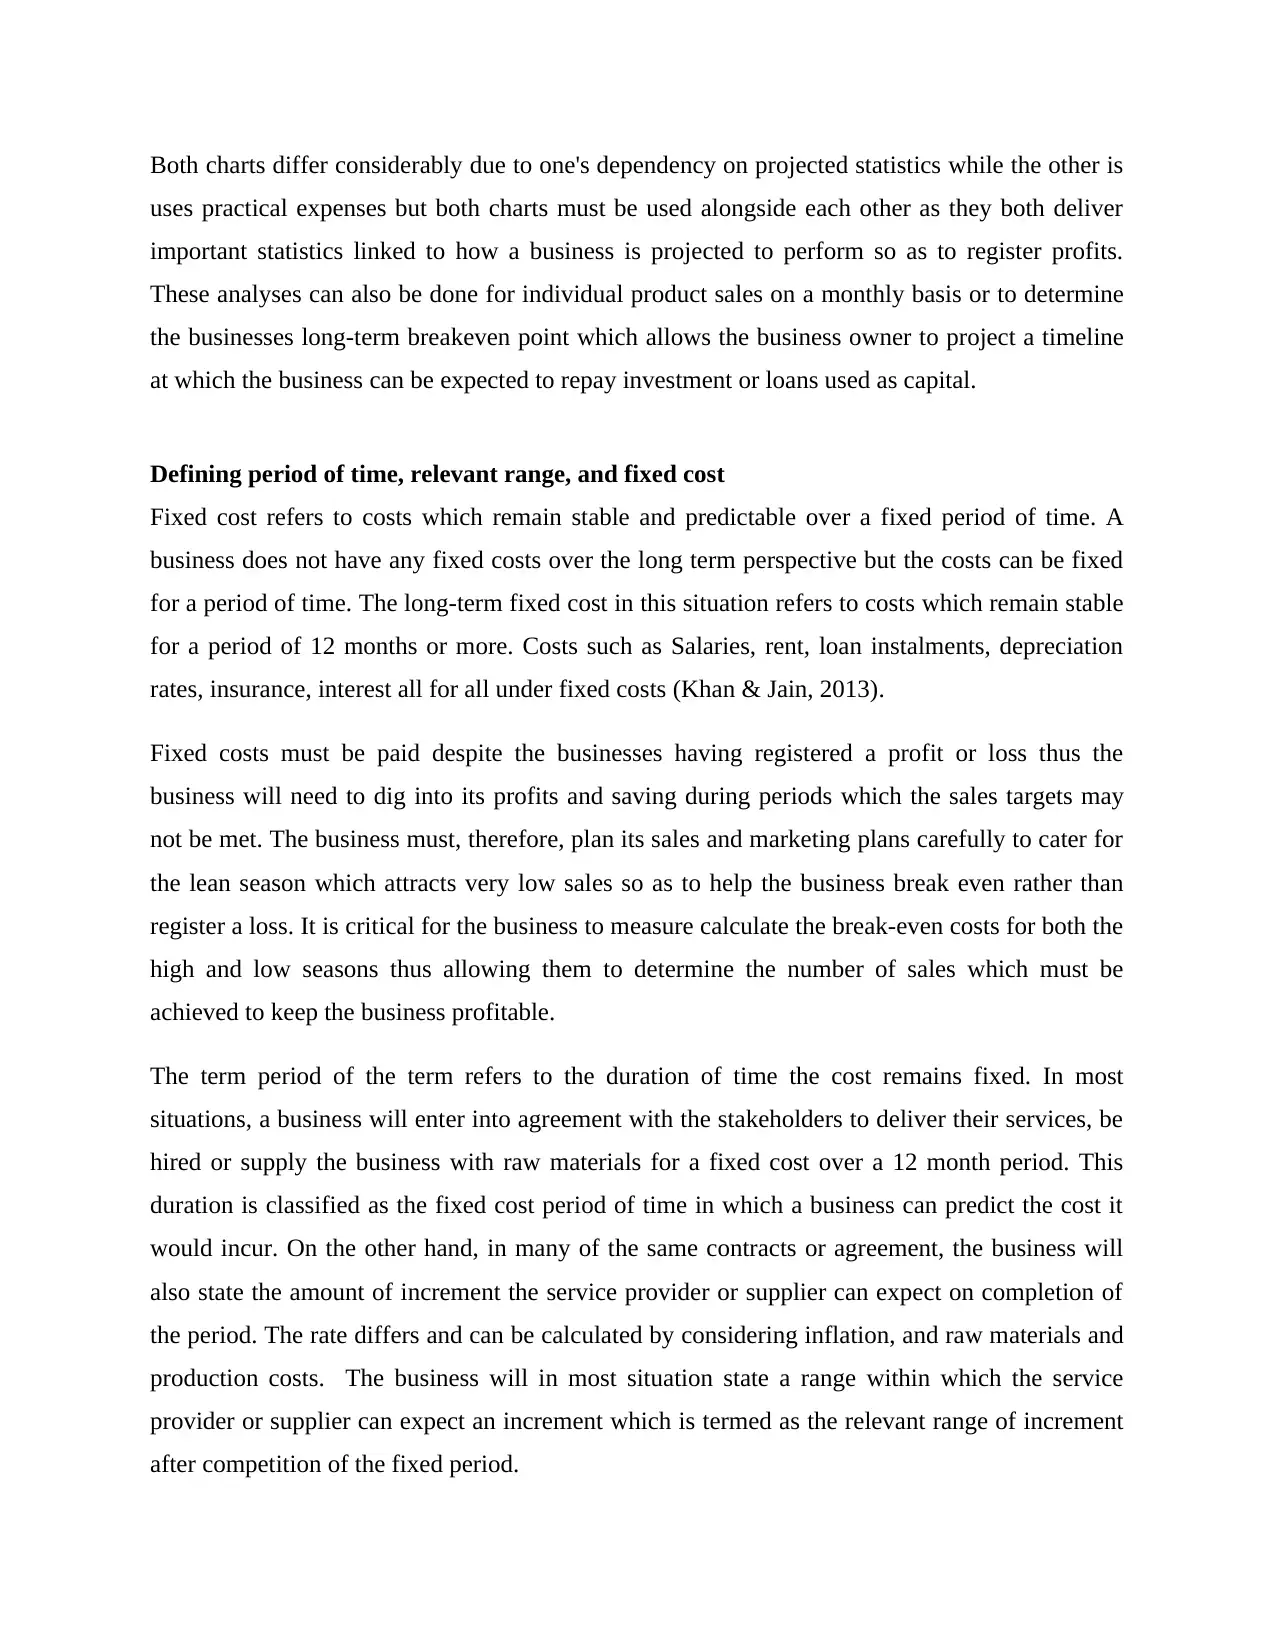
Both charts differ considerably due to one's dependency on projected statistics while the other is
uses practical expenses but both charts must be used alongside each other as they both deliver
important statistics linked to how a business is projected to perform so as to register profits.
These analyses can also be done for individual product sales on a monthly basis or to determine
the businesses long-term breakeven point which allows the business owner to project a timeline
at which the business can be expected to repay investment or loans used as capital.
Defining period of time, relevant range, and fixed cost
Fixed cost refers to costs which remain stable and predictable over a fixed period of time. A
business does not have any fixed costs over the long term perspective but the costs can be fixed
for a period of time. The long-term fixed cost in this situation refers to costs which remain stable
for a period of 12 months or more. Costs such as Salaries, rent, loan instalments, depreciation
rates, insurance, interest all for all under fixed costs (Khan & Jain, 2013).
Fixed costs must be paid despite the businesses having registered a profit or loss thus the
business will need to dig into its profits and saving during periods which the sales targets may
not be met. The business must, therefore, plan its sales and marketing plans carefully to cater for
the lean season which attracts very low sales so as to help the business break even rather than
register a loss. It is critical for the business to measure calculate the break-even costs for both the
high and low seasons thus allowing them to determine the number of sales which must be
achieved to keep the business profitable.
The term period of the term refers to the duration of time the cost remains fixed. In most
situations, a business will enter into agreement with the stakeholders to deliver their services, be
hired or supply the business with raw materials for a fixed cost over a 12 month period. This
duration is classified as the fixed cost period of time in which a business can predict the cost it
would incur. On the other hand, in many of the same contracts or agreement, the business will
also state the amount of increment the service provider or supplier can expect on completion of
the period. The rate differs and can be calculated by considering inflation, and raw materials and
production costs. The business will in most situation state a range within which the service
provider or supplier can expect an increment which is termed as the relevant range of increment
after competition of the fixed period.
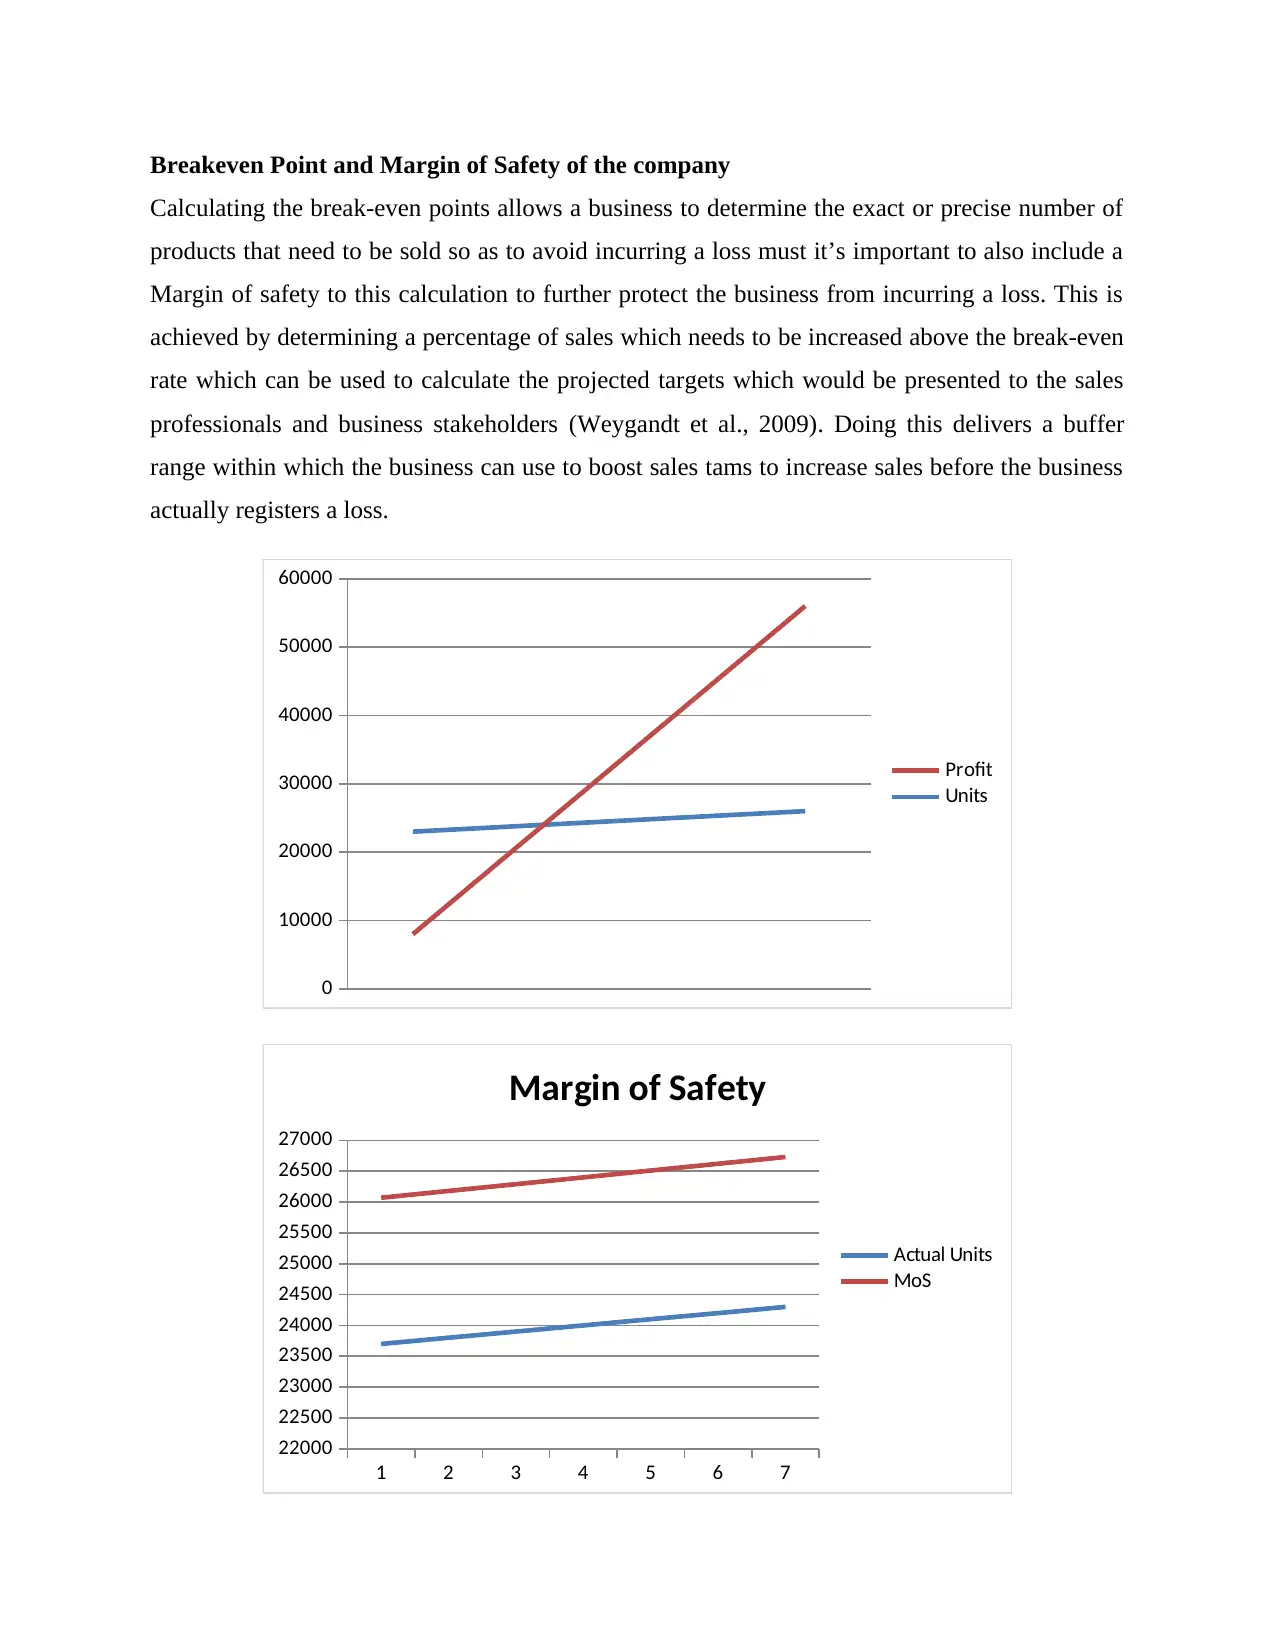
Breakeven Point and Margin of Safety of the company
Calculating the break-even points allows a business to determine the exact or precise number of
products that need to be sold so as to avoid incurring a loss must it’s important to also include a
Margin of safety to this calculation to further protect the business from incurring a loss. This is
achieved by determining a percentage of sales which needs to be increased above the break-even
rate which can be used to calculate the projected targets which would be presented to the sales
professionals and business stakeholders (Weygandt et al., 2009). Doing this delivers a buffer
range within which the business can use to boost sales tams to increase sales before the business
actually registers a loss.
0
10000
20000
30000
40000
50000
60000
Profit
Units
1 2 3 4 5 6 7
22000
22500
23000
23500
24000
24500
25000
25500
26000
26500
27000
Margin of Safety
Actual Units
MoS
⊘ This is a preview!⊘
Do you want full access?
Subscribe today to unlock all pages.
Trusted by 1+ million students worldwide
This can be observed on the above Margin of safety chart where the margin of safety has been
calculated at 10% of the actual breakeven point which shows a 10% increment in the number of
sales the sales team need to target achieving on a monthly basis. The main reason for delivering a
Margin of Safety is to ensure the business sales targets remain above the actual requirement thus
helping avert losses which may occur due to the lack of meeting targets (Wylie, 2010). Having
this margin of safety also provided the business at a fixed percentage of flexibility which the
business can use make modification and changes to their marketing strategy before the business
begins registering actual losses. The margin of safety can be calculated on any range of the
business sales and profits thus delivers additional flexibility linked to the business's performance.
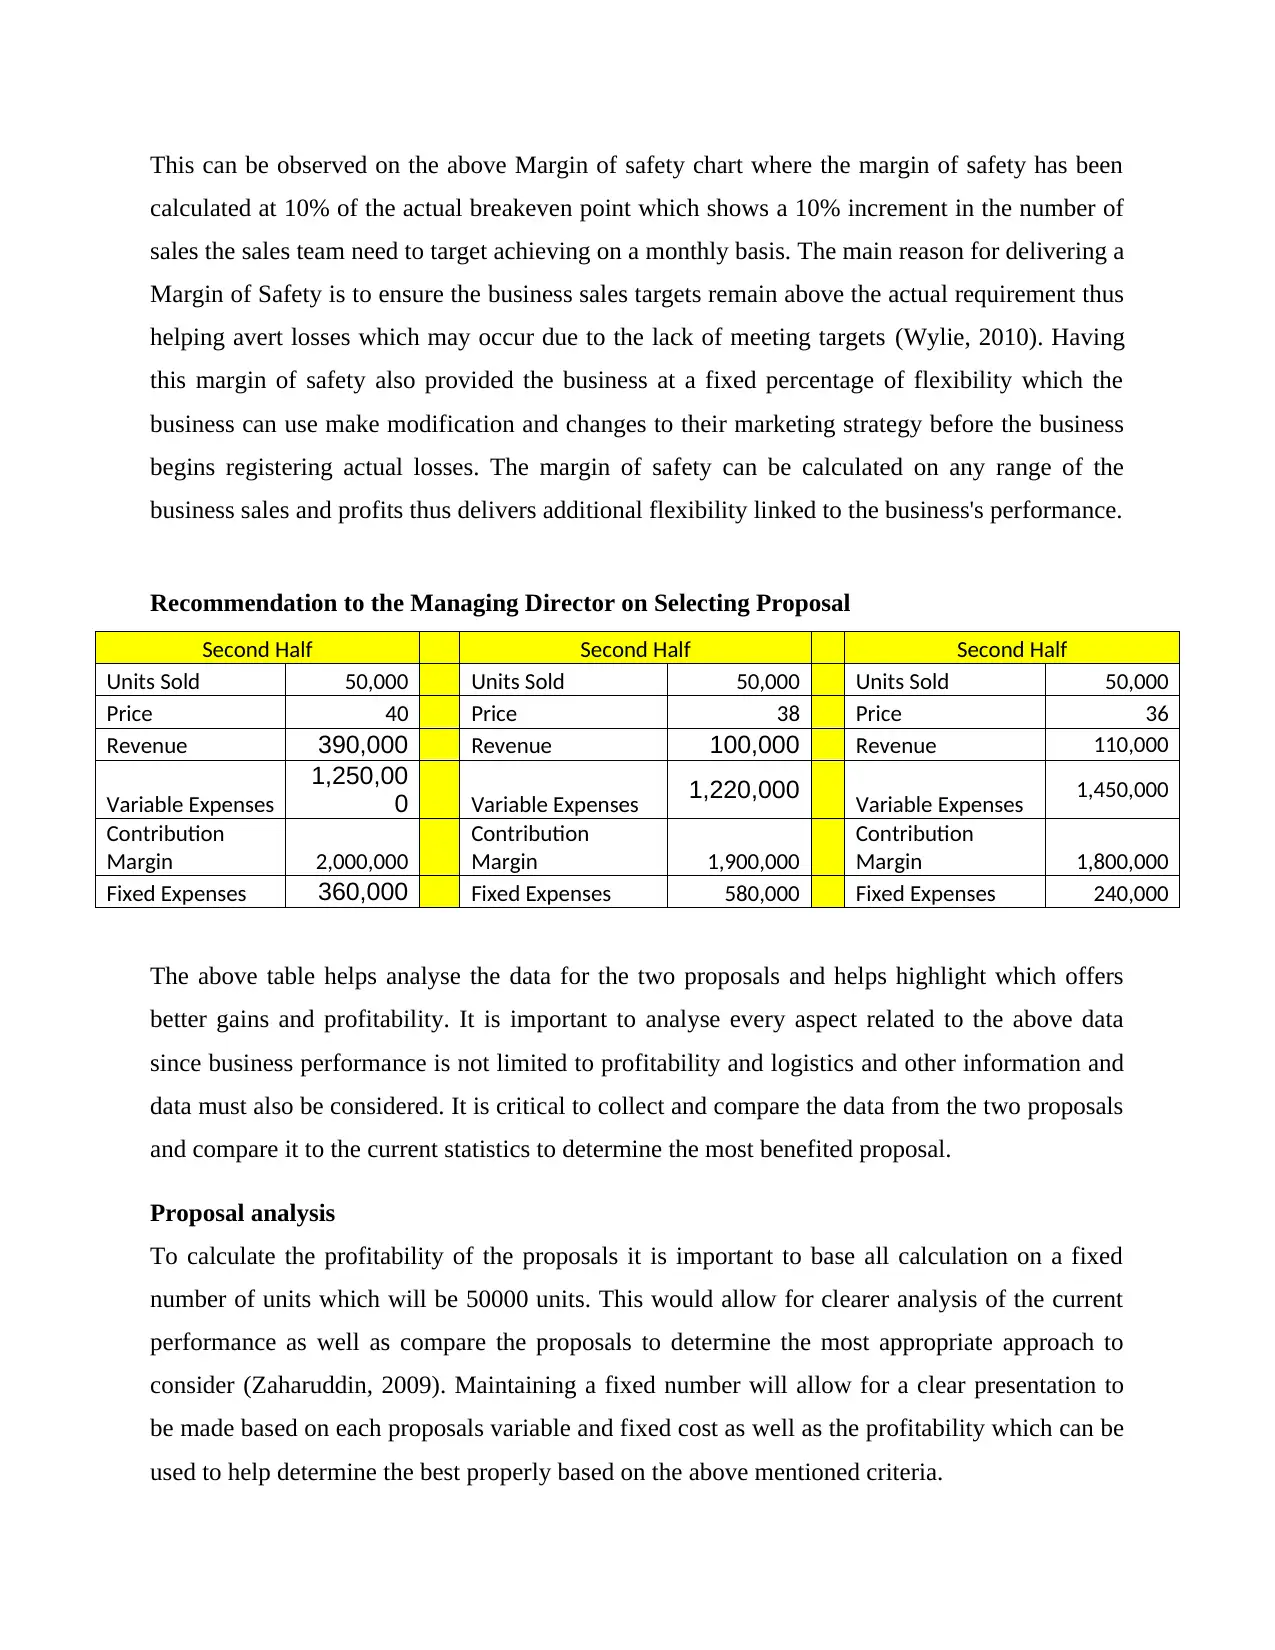
Recommendation to the Managing Director on Selecting Proposal
Second Half Second Half Second Half
Units Sold 50,000 Units Sold 50,000 Units Sold 50,000
Price 40 Price 38 Price 36
Revenue 390,000 Revenue 100,000 Revenue 110,000
Variable Expenses
1,250,00
0 Variable Expenses 1,220,000 Variable Expenses 1,450,000
Contribution
Margin 2,000,000
Contribution
Margin 1,900,000
Contribution
Margin 1,800,000
Fixed Expenses 360,000 Fixed Expenses 580,000 Fixed Expenses 240,000
The above table helps analyse the data for the two proposals and helps highlight which offers
better gains and profitability. It is important to analyse every aspect related to the above data
since business performance is not limited to profitability and logistics and other information and
data must also be considered. It is critical to collect and compare the data from the two proposals
and compare it to the current statistics to determine the most benefited proposal.
Proposal analysis
To calculate the profitability of the proposals it is important to base all calculation on a fixed
number of units which will be 50000 units. This would allow for clearer analysis of the current
performance as well as compare the proposals to determine the most appropriate approach to
consider (Zaharuddin, 2009). Maintaining a fixed number will allow for a clear presentation to
be made based on each proposals variable and fixed cost as well as the profitability which can be
used to help determine the best properly based on the above mentioned criteria.
calculated at 10% of the actual breakeven point which shows a 10% increment in the number of
sales the sales team need to target achieving on a monthly basis. The main reason for delivering a
Margin of Safety is to ensure the business sales targets remain above the actual requirement thus
helping avert losses which may occur due to the lack of meeting targets (Wylie, 2010). Having
this margin of safety also provided the business at a fixed percentage of flexibility which the
business can use make modification and changes to their marketing strategy before the business
begins registering actual losses. The margin of safety can be calculated on any range of the
business sales and profits thus delivers additional flexibility linked to the business's performance.
Recommendation to the Managing Director on Selecting Proposal
Second Half Second Half Second Half
Units Sold 50,000 Units Sold 50,000 Units Sold 50,000
Price 40 Price 38 Price 36
Revenue 390,000 Revenue 100,000 Revenue 110,000
Variable Expenses
1,250,00
0 Variable Expenses 1,220,000 Variable Expenses 1,450,000
Contribution
Margin 2,000,000
Contribution
Margin 1,900,000
Contribution
Margin 1,800,000
Fixed Expenses 360,000 Fixed Expenses 580,000 Fixed Expenses 240,000
The above table helps analyse the data for the two proposals and helps highlight which offers
better gains and profitability. It is important to analyse every aspect related to the above data
since business performance is not limited to profitability and logistics and other information and
data must also be considered. It is critical to collect and compare the data from the two proposals
and compare it to the current statistics to determine the most benefited proposal.
Proposal analysis
To calculate the profitability of the proposals it is important to base all calculation on a fixed
number of units which will be 50000 units. This would allow for clearer analysis of the current
performance as well as compare the proposals to determine the most appropriate approach to
consider (Zaharuddin, 2009). Maintaining a fixed number will allow for a clear presentation to
be made based on each proposals variable and fixed cost as well as the profitability which can be
used to help determine the best properly based on the above mentioned criteria.
Paraphrase This Document
Need a fresh take? Get an instant paraphrase of this document with our AI Paraphraser
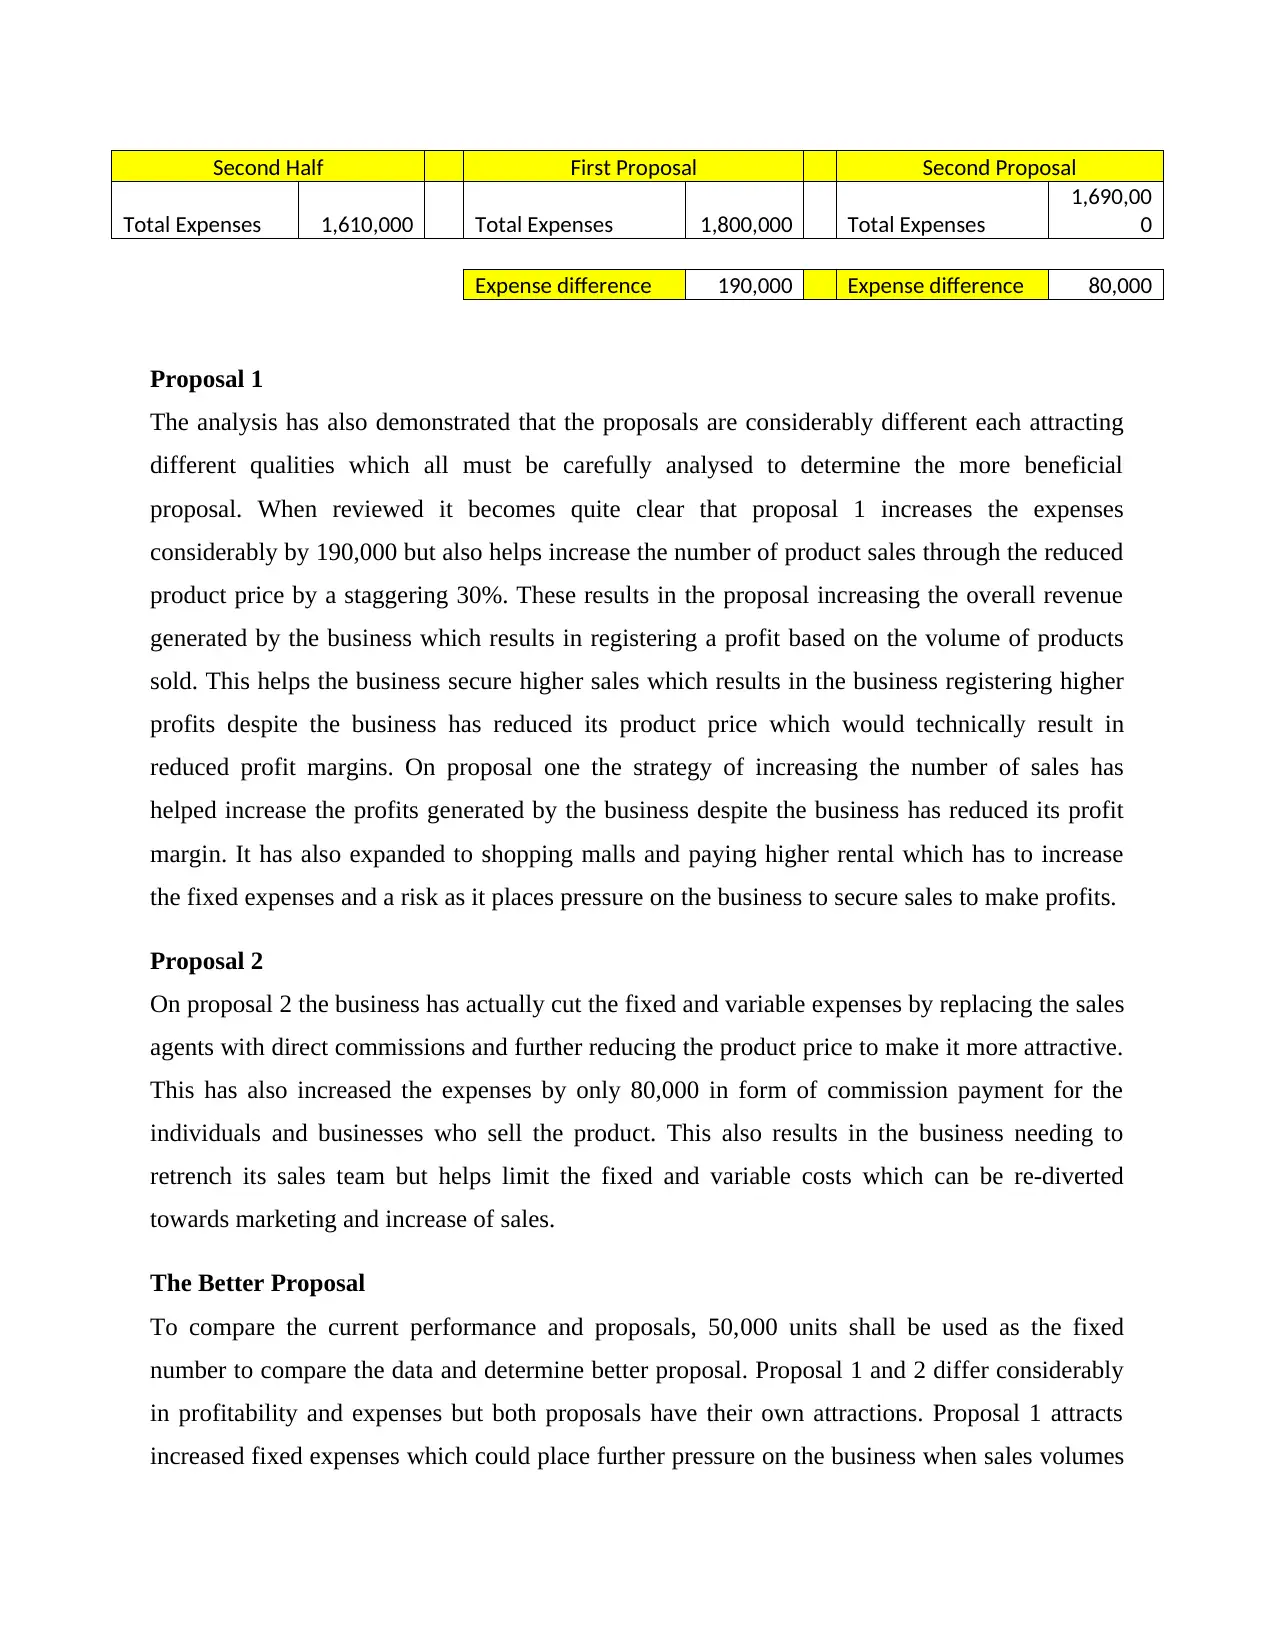
Second Half First Proposal Second Proposal
Total Expenses 1,610,000 Total Expenses 1,800,000 Total Expenses
1,690,00
0
Expense difference 190,000 Expense difference 80,000
Proposal 1
The analysis has also demonstrated that the proposals are considerably different each attracting
different qualities which all must be carefully analysed to determine the more beneficial
proposal. When reviewed it becomes quite clear that proposal 1 increases the expenses
considerably by 190,000 but also helps increase the number of product sales through the reduced
product price by a staggering 30%. These results in the proposal increasing the overall revenue
generated by the business which results in registering a profit based on the volume of products
sold. This helps the business secure higher sales which results in the business registering higher
profits despite the business has reduced its product price which would technically result in
reduced profit margins. On proposal one the strategy of increasing the number of sales has
helped increase the profits generated by the business despite the business has reduced its profit
margin. It has also expanded to shopping malls and paying higher rental which has to increase
the fixed expenses and a risk as it places pressure on the business to secure sales to make profits.
Proposal 2
On proposal 2 the business has actually cut the fixed and variable expenses by replacing the sales
agents with direct commissions and further reducing the product price to make it more attractive.
This has also increased the expenses by only 80,000 in form of commission payment for the
individuals and businesses who sell the product. This also results in the business needing to
retrench its sales team but helps limit the fixed and variable costs which can be re-diverted
towards marketing and increase of sales.
The Better Proposal
To compare the current performance and proposals, 50,000 units shall be used as the fixed
number to compare the data and determine better proposal. Proposal 1 and 2 differ considerably
in profitability and expenses but both proposals have their own attractions. Proposal 1 attracts
increased fixed expenses which could place further pressure on the business when sales volumes
are low thus Proposal 2 seems to be the better option which delivers a fixed expanse rate based
on the sales volume. Reducing fixed expanses reduced the pressure on Green Motor Ltd in case
the business encounters an unexpected reduction in sales or competition. Maintaining
commission based expenses helps fix the costs associated to each products sale this allowing the
business to determine its expenses and limit overhead expenses. This helps relieve pressure from
the business with relation to the fixed and variable expenses and allow the business determine
the product expenses based on the sales volumes (SANT, 2012). The product price may increase
due to the commission being charged but the commission will also encourage the service
providers to sell the product which will help increase the sales volume without Green Motor Ltd
needing to invest on renting additional space and paying utility bills which all contribute towards
the businesses overall expenses.
Recommendation
Analysis of the 1st and 2nd half as well as the Proposal 1 and 2 reveals some important statistics
which can be used to improve the performance of Green Motor Ltd. With sales dropping due to
competition and the reduction is old prices minimizing fixed expenses is critical towards the
business managing its expenses. Thus it is recommended that proposal two be given priority as
this proposal helps the businesses limit overhead fixed costs. The proposal also increases the
price of the finished product due to the commissions being offered to the workshops and motor
engineers used to sell the product but this is critical towards the businesses limiting expenses. By
converting the majority of expenses to variable costs the business can limit overhead costs
incurred on a monthly basis thus allowing the businesses to manage its expenses even during
times of crisis. It also encourages the workshops, engineers and agents to sell more of the brands
products so as to secure more commissions thus helping boost the businesses overall sales.
Proposal 2 is there for the recommended choice for Green Motor Ltd to adopt as it will help limit
the expenses incurred by the businesses
Conclusion
Performance management required for a business to evaluate their previous and current
performance history so as to make a modification to their future targets. This is a critical
requirement for every business so as to retain its competitive edge which would allow the
business map its history and determines important areas which may require improvement. It also
⊘ This is a preview!⊘
Do you want full access?
Subscribe today to unlock all pages.
Trusted by 1+ million students worldwide
helps encourage contribution of new ideas which is critical towards the business securing new
and innovative approaches which can be used to improve the business's performance. The same
has been applied by Green Motor Ltd which experiences a major fluctuation in its sales volume
and profits thus allowing the business analysis important strategies it can adapt to improve its
performance, sales, and market position.
References:
Bacal, R., 2012. Performance Management 2/E. 2nd ed. McGraw Hill Professional.
Cafferky, M., 2010. Breakeven Analysis: The Definitive Guide to Cost-Volume-Profit Analysis.
New York: Business Expert Press.
Khan, M.Y. & Jain, P.K., 2013. Management Accounting : Text, Problems and Cases. Tata
McGraw-Hill Education.
Media, B.L., 2017. ACCA F5 Performance Management. Singapore: BPP Learning Media.
SANT, T., 2012. Persuasive Business Proposals: Writing to Win More Customers, Clients, and
Contracts. 3rd ed. AMACOM Div American Mgmt Assn.
Paraphrase This Document
Need a fresh take? Get an instant paraphrase of this document with our AI Paraphraser
Scarlett, R., 2005. Management Accounting-Performance Evaluation. Oxford: Elsevier.
Weygandt, J.J., Kimmel, P.D. & Kieso, D.E., 2009. Managerial Accounting: Tools for Business
Decision Making. John Wiley & Sons.
Wylie, M., 2010. Wise Investing with a Margin of Safety: Investing at the Peak of Pessimism.
BPI Mentors.
Zaharuddin, H., 2009. Business Plan Analysis for Mini Market. Diskon.
1 out of 11
Related Documents


Your All-in-One AI-Powered Toolkit for Academic Success.
+13062052269
info@desklib.com
Available 24*7 on WhatsApp / Email
![[object Object]](/_next/static/media/star-bottom.7253800d.svg)
Unlock your academic potential
Copyright © 2020–2026 A2Z Services. All Rights Reserved. Developed and managed by ZUCOL.