Comprehensive Financial Strategic Analysis of Greggs PLC (2016-2017)
VerifiedAdded on 2020/10/22
|11
|1682
|61
Report
AI Summary
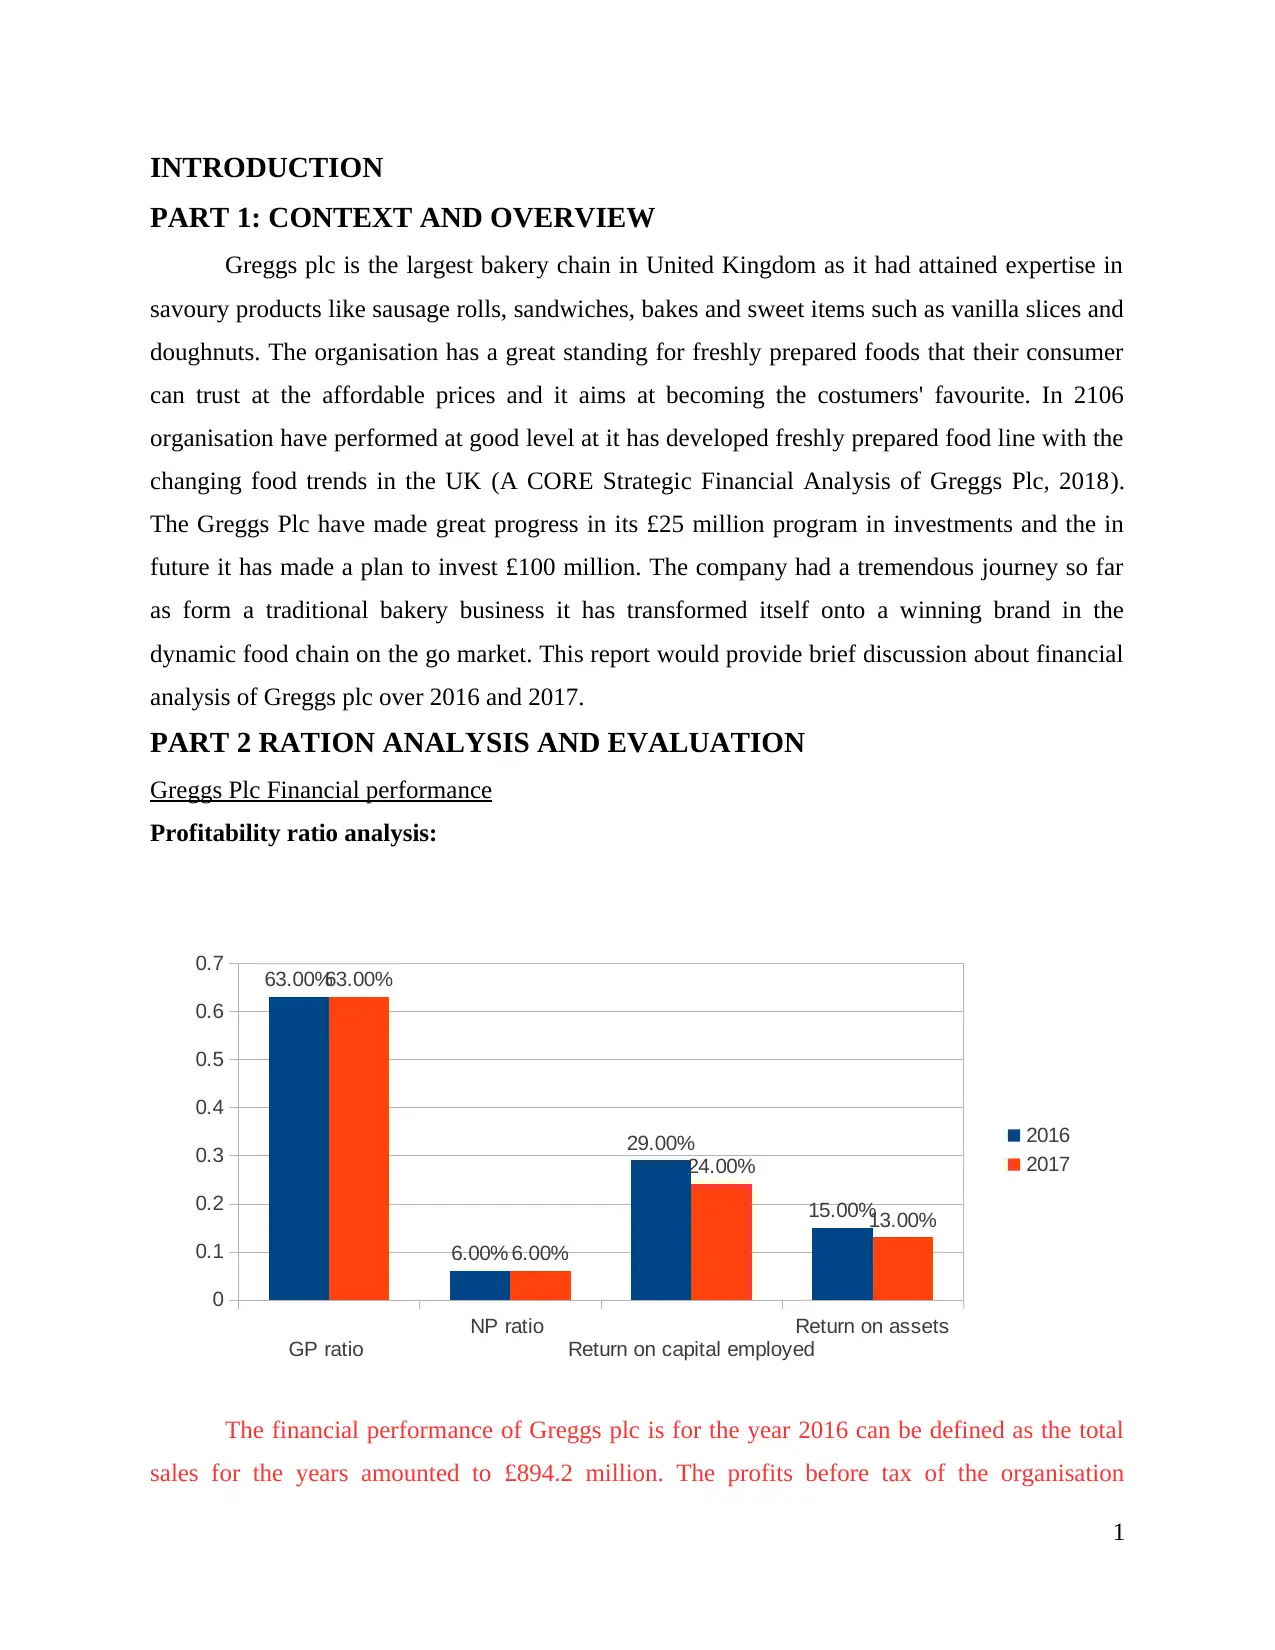
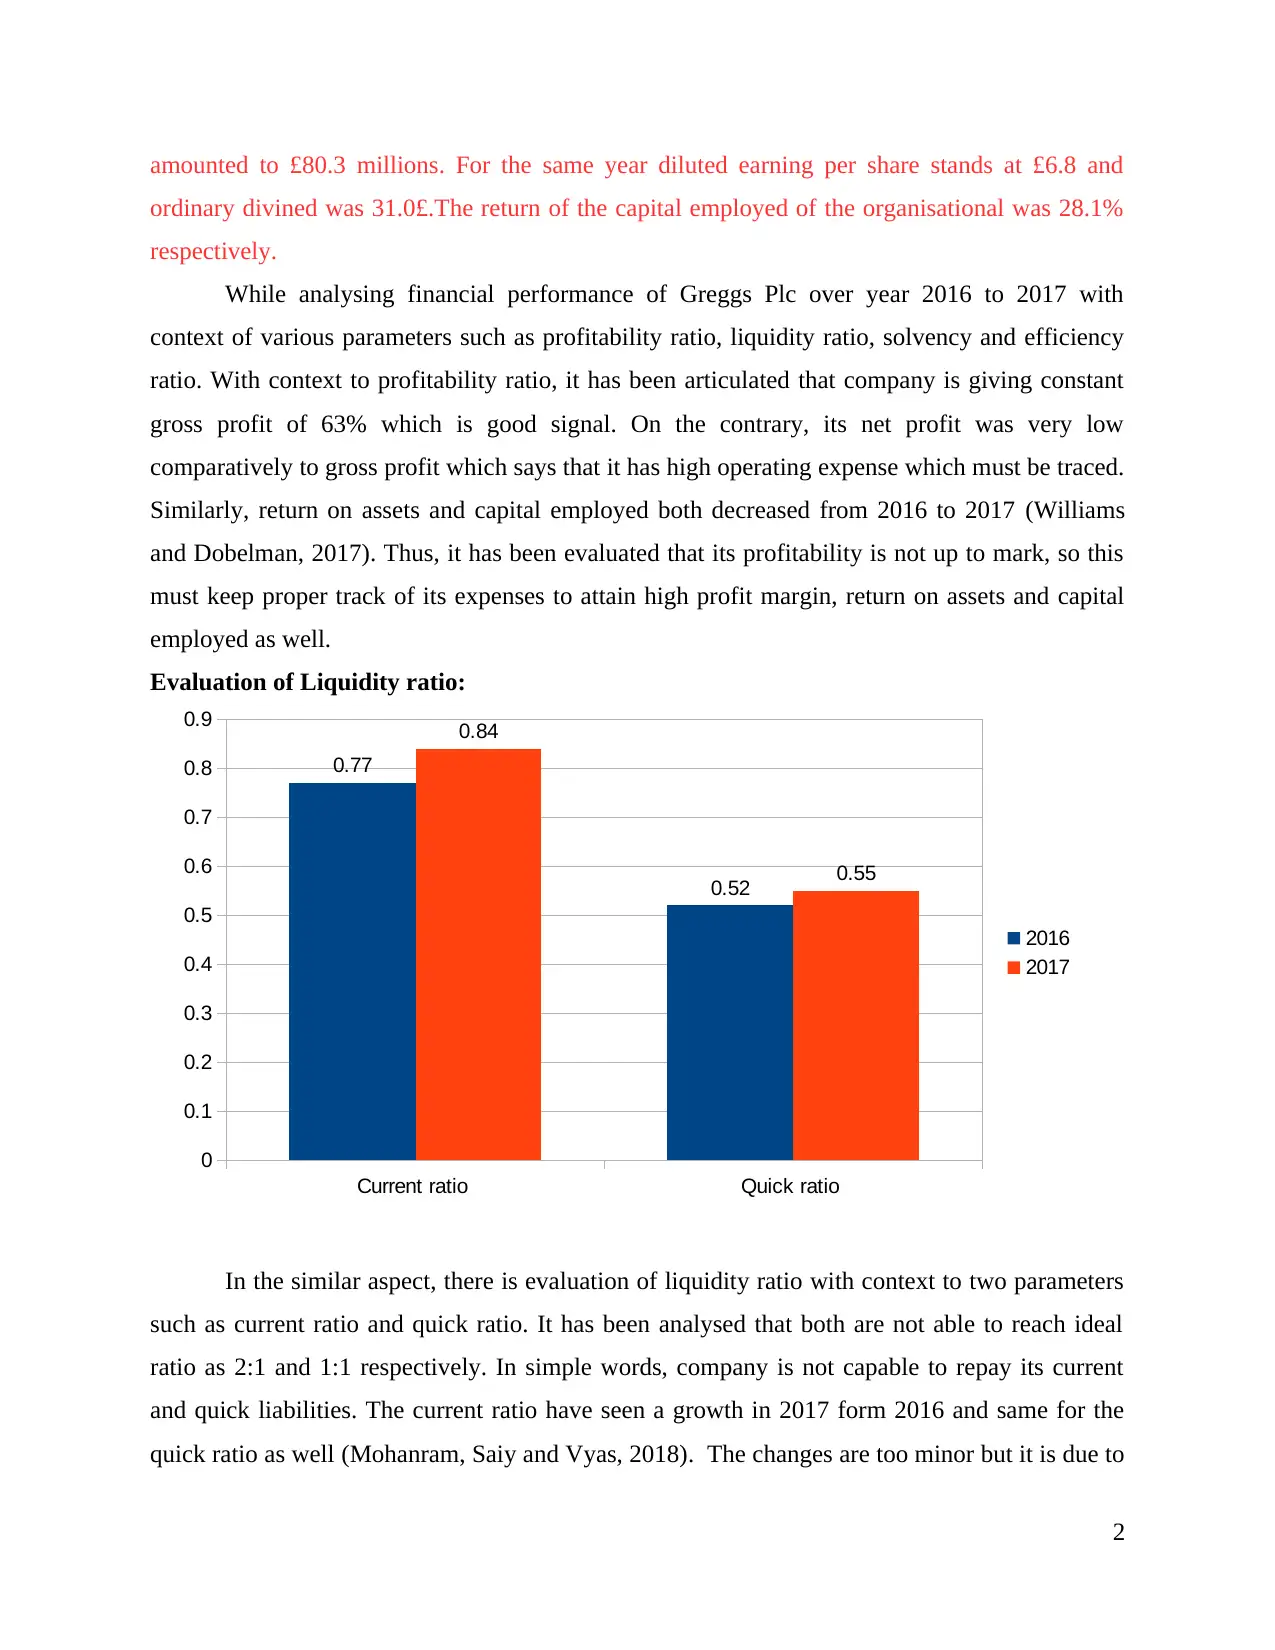
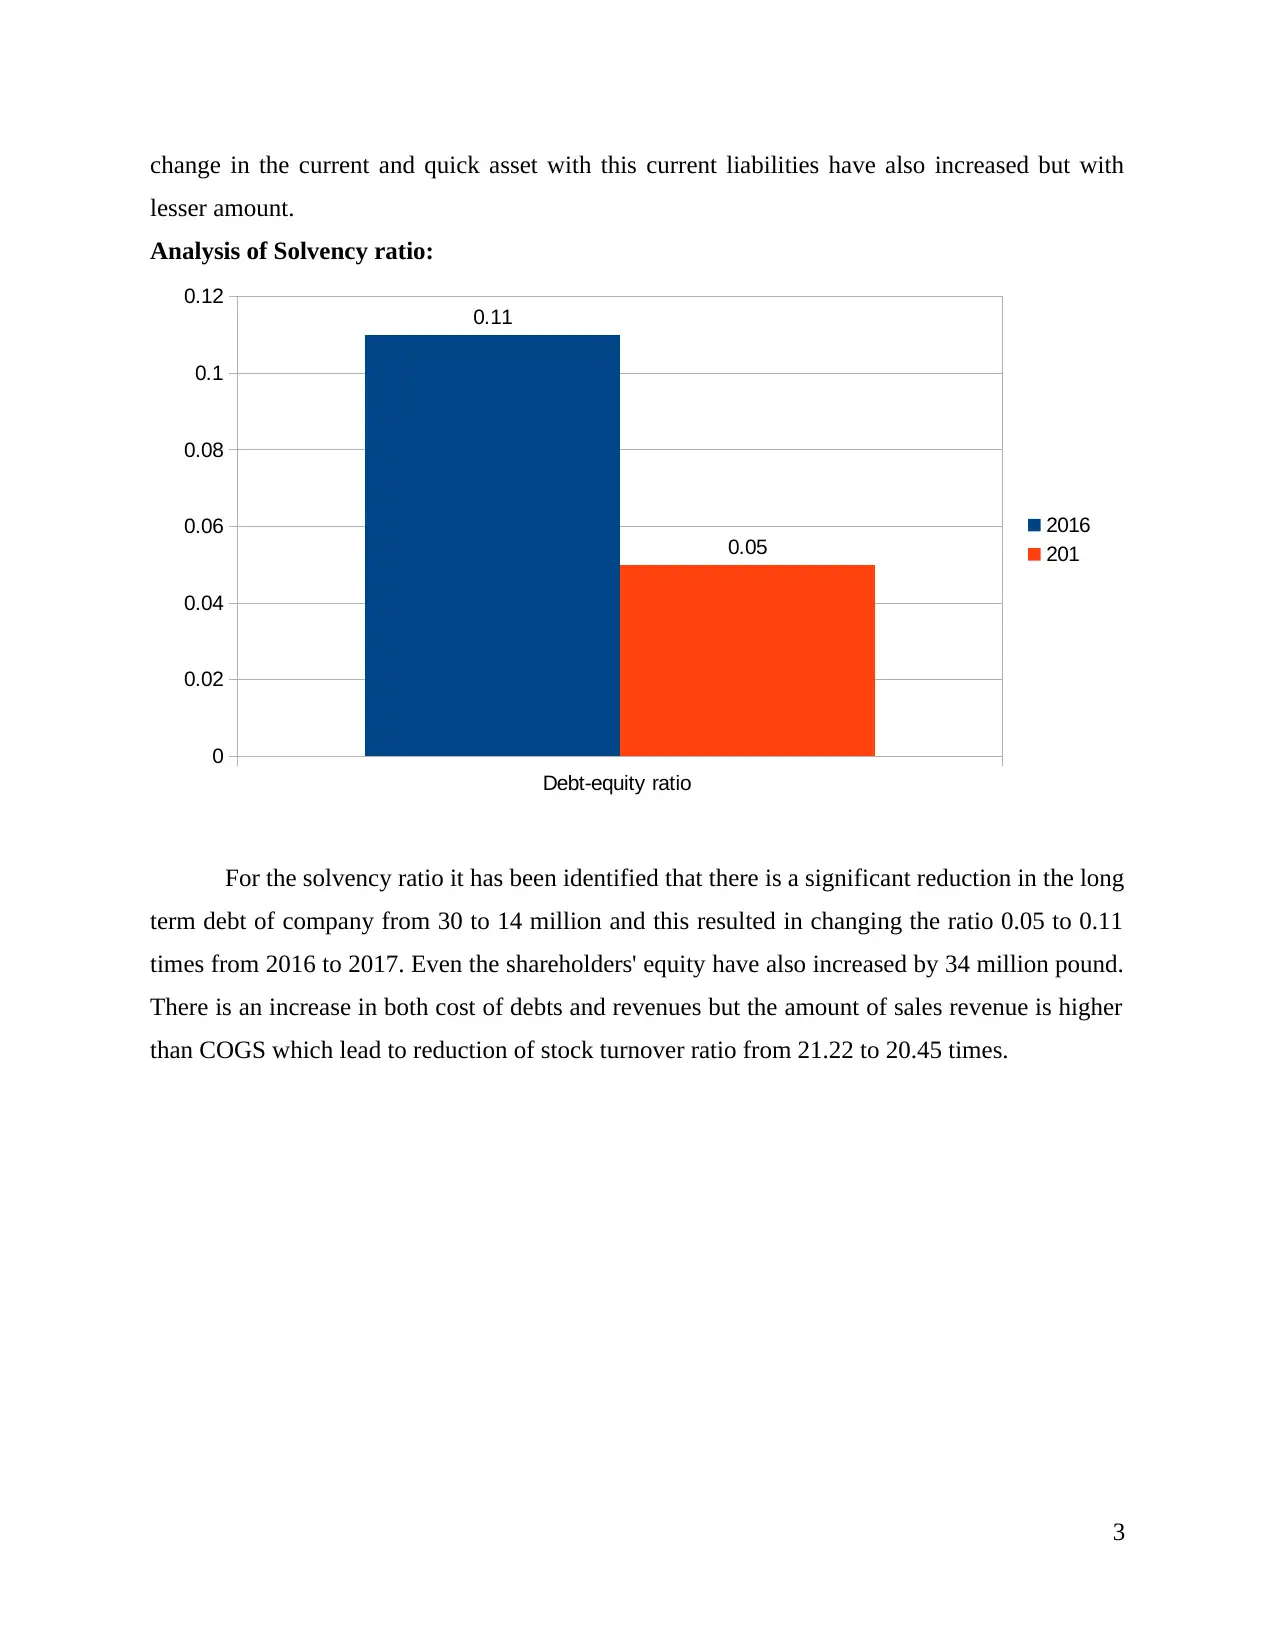
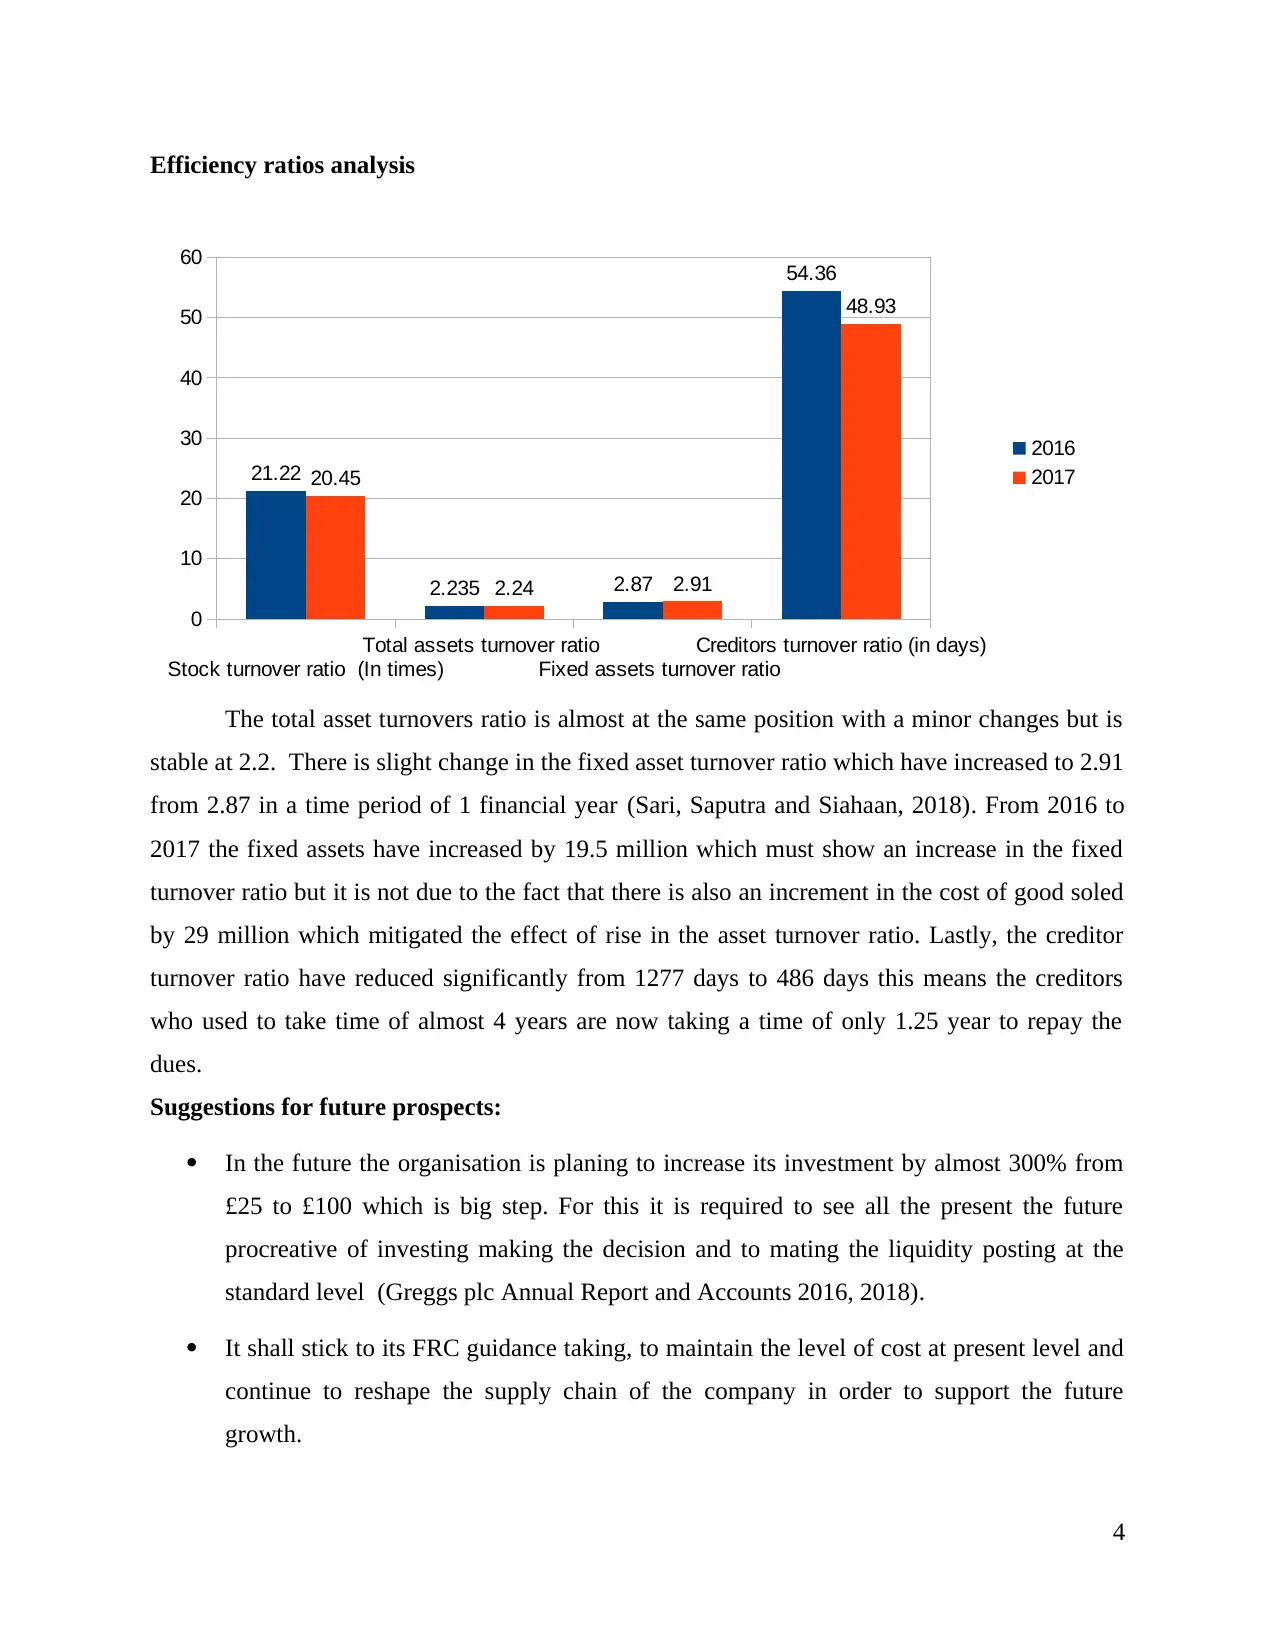
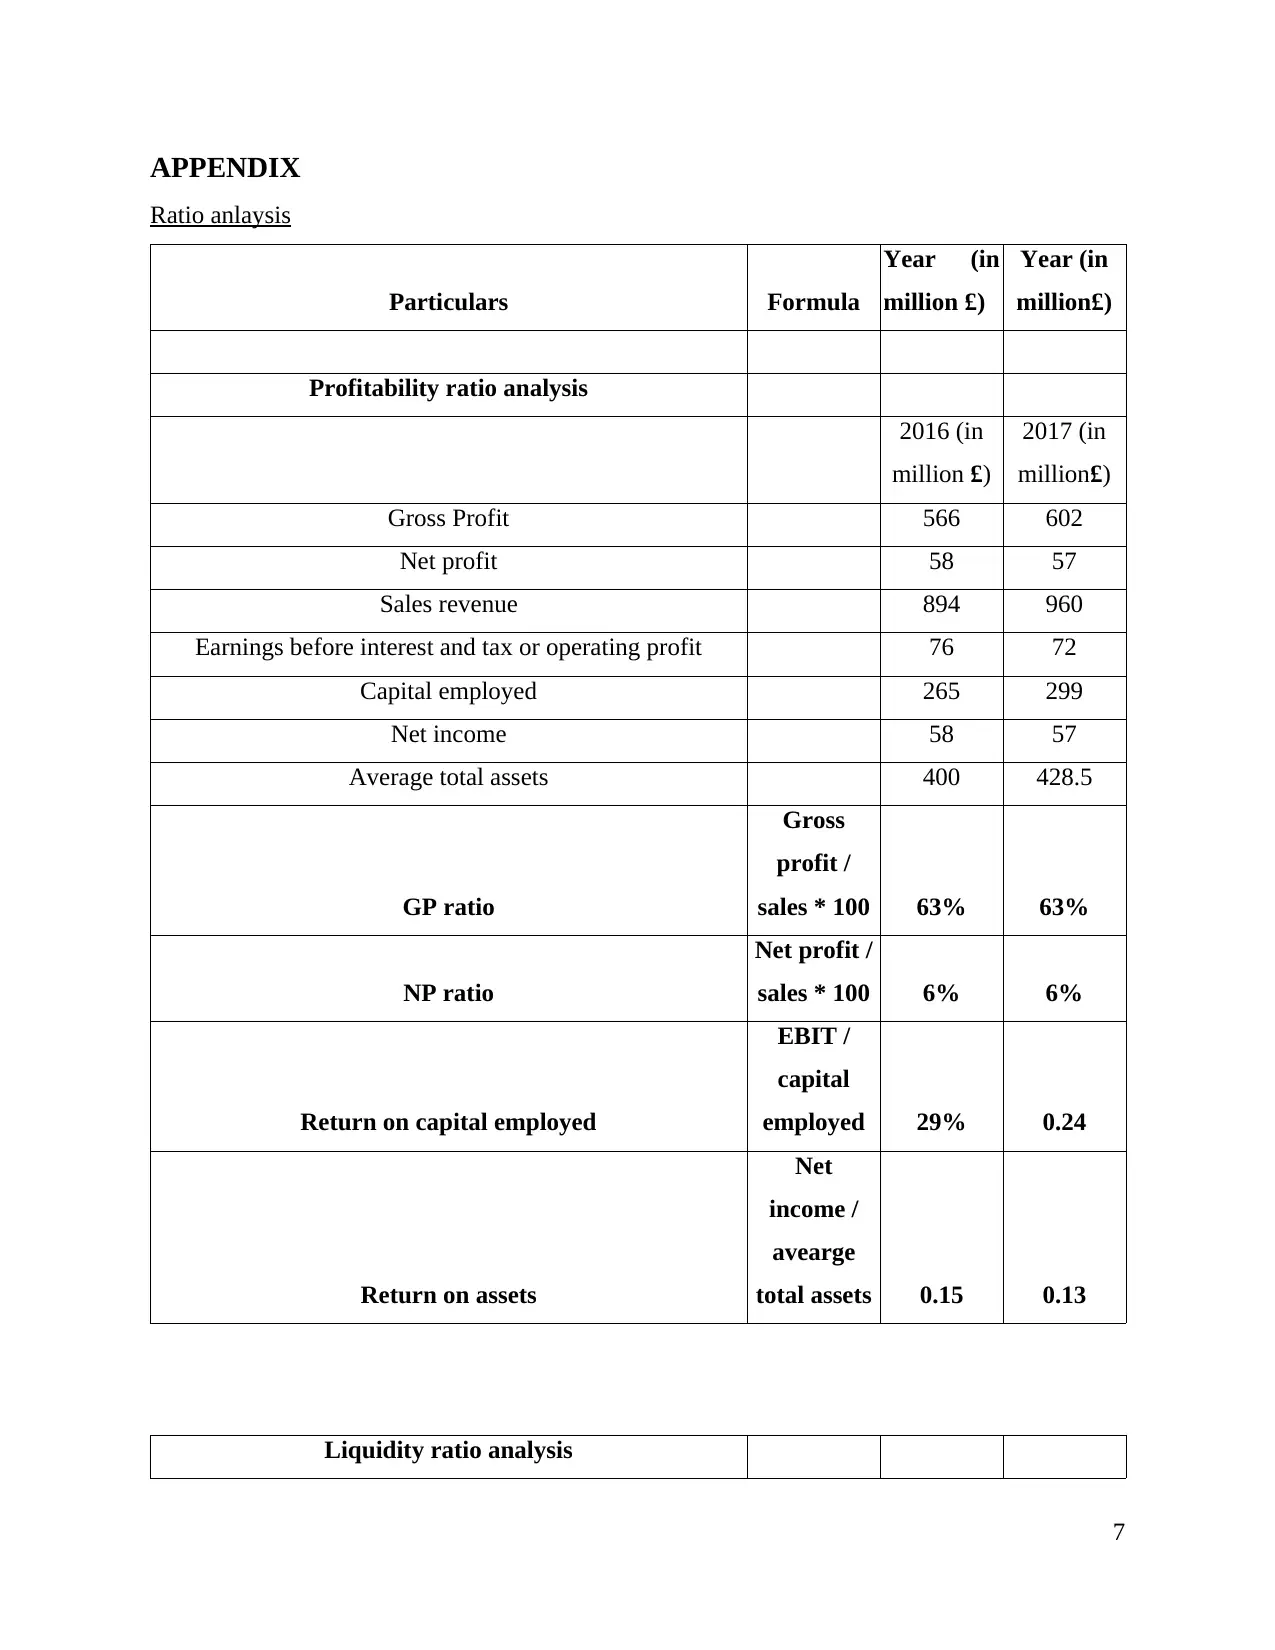
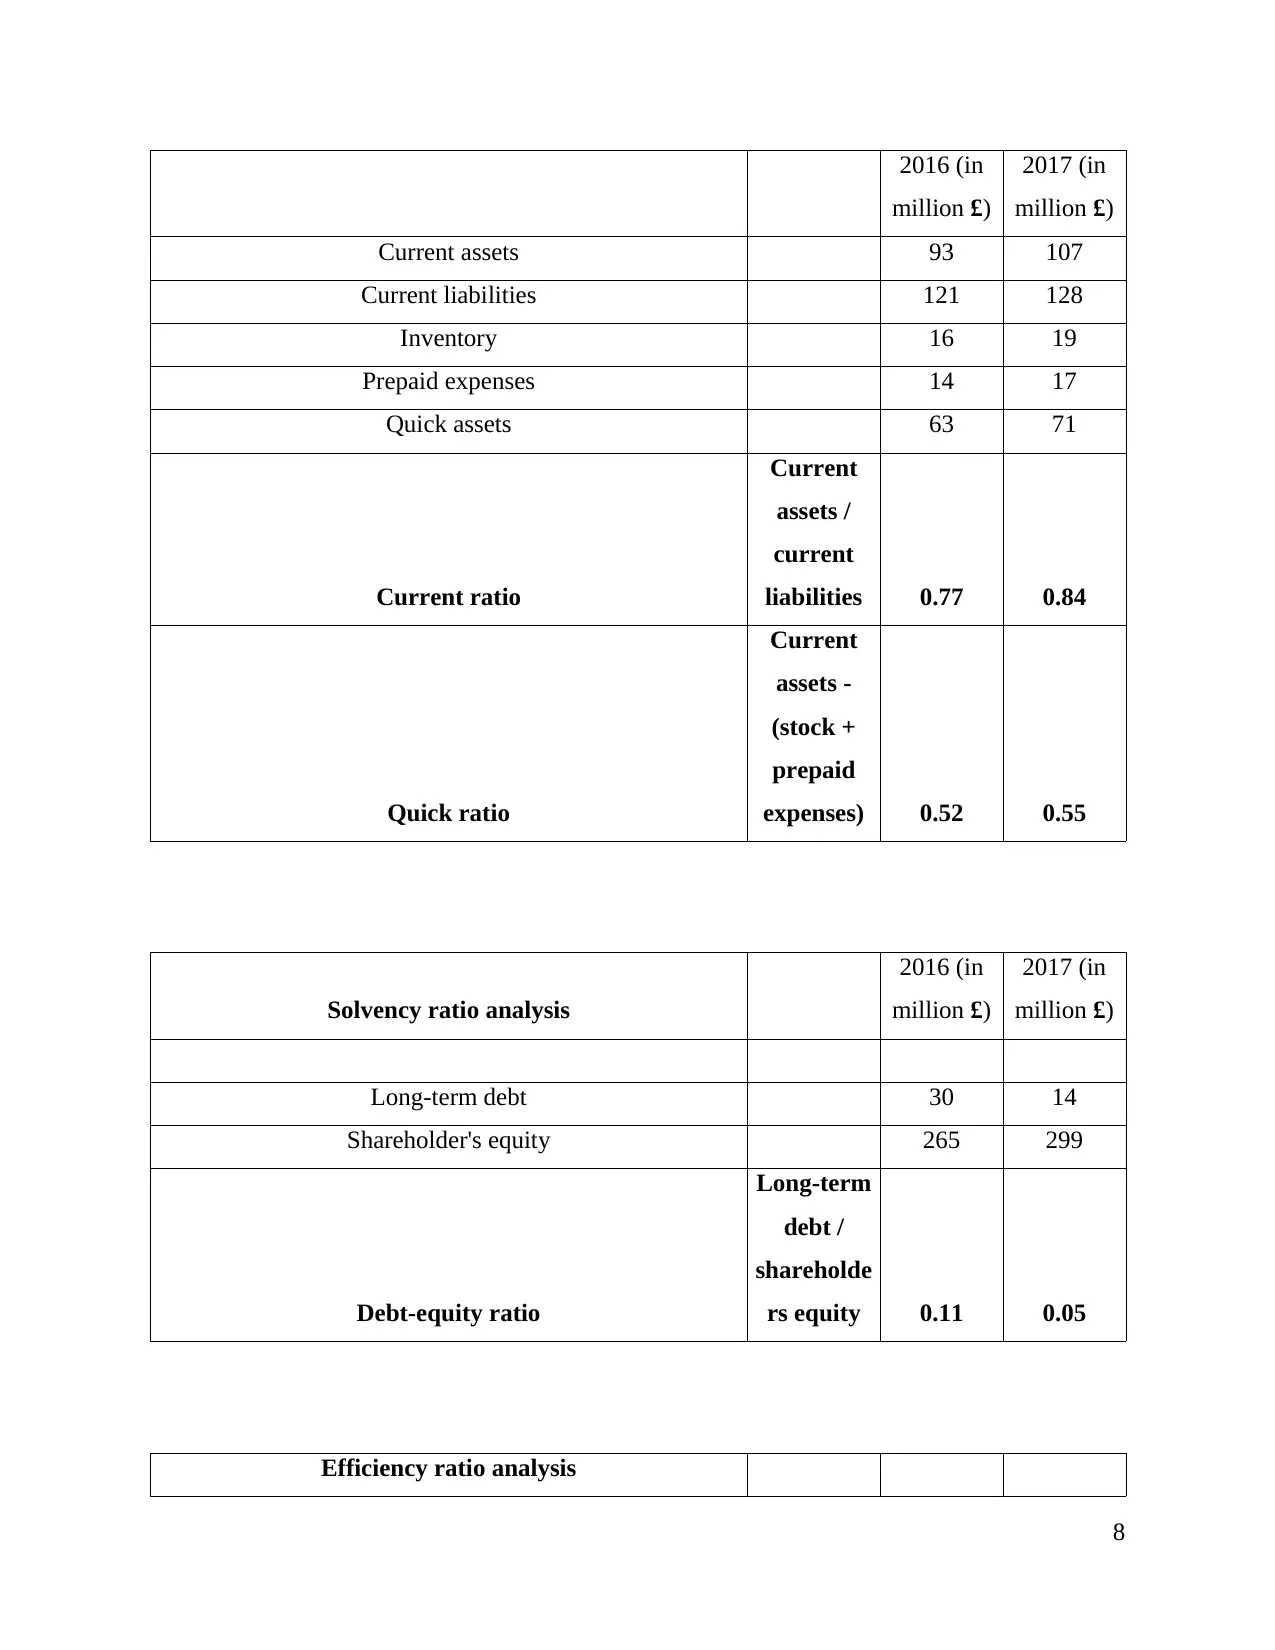
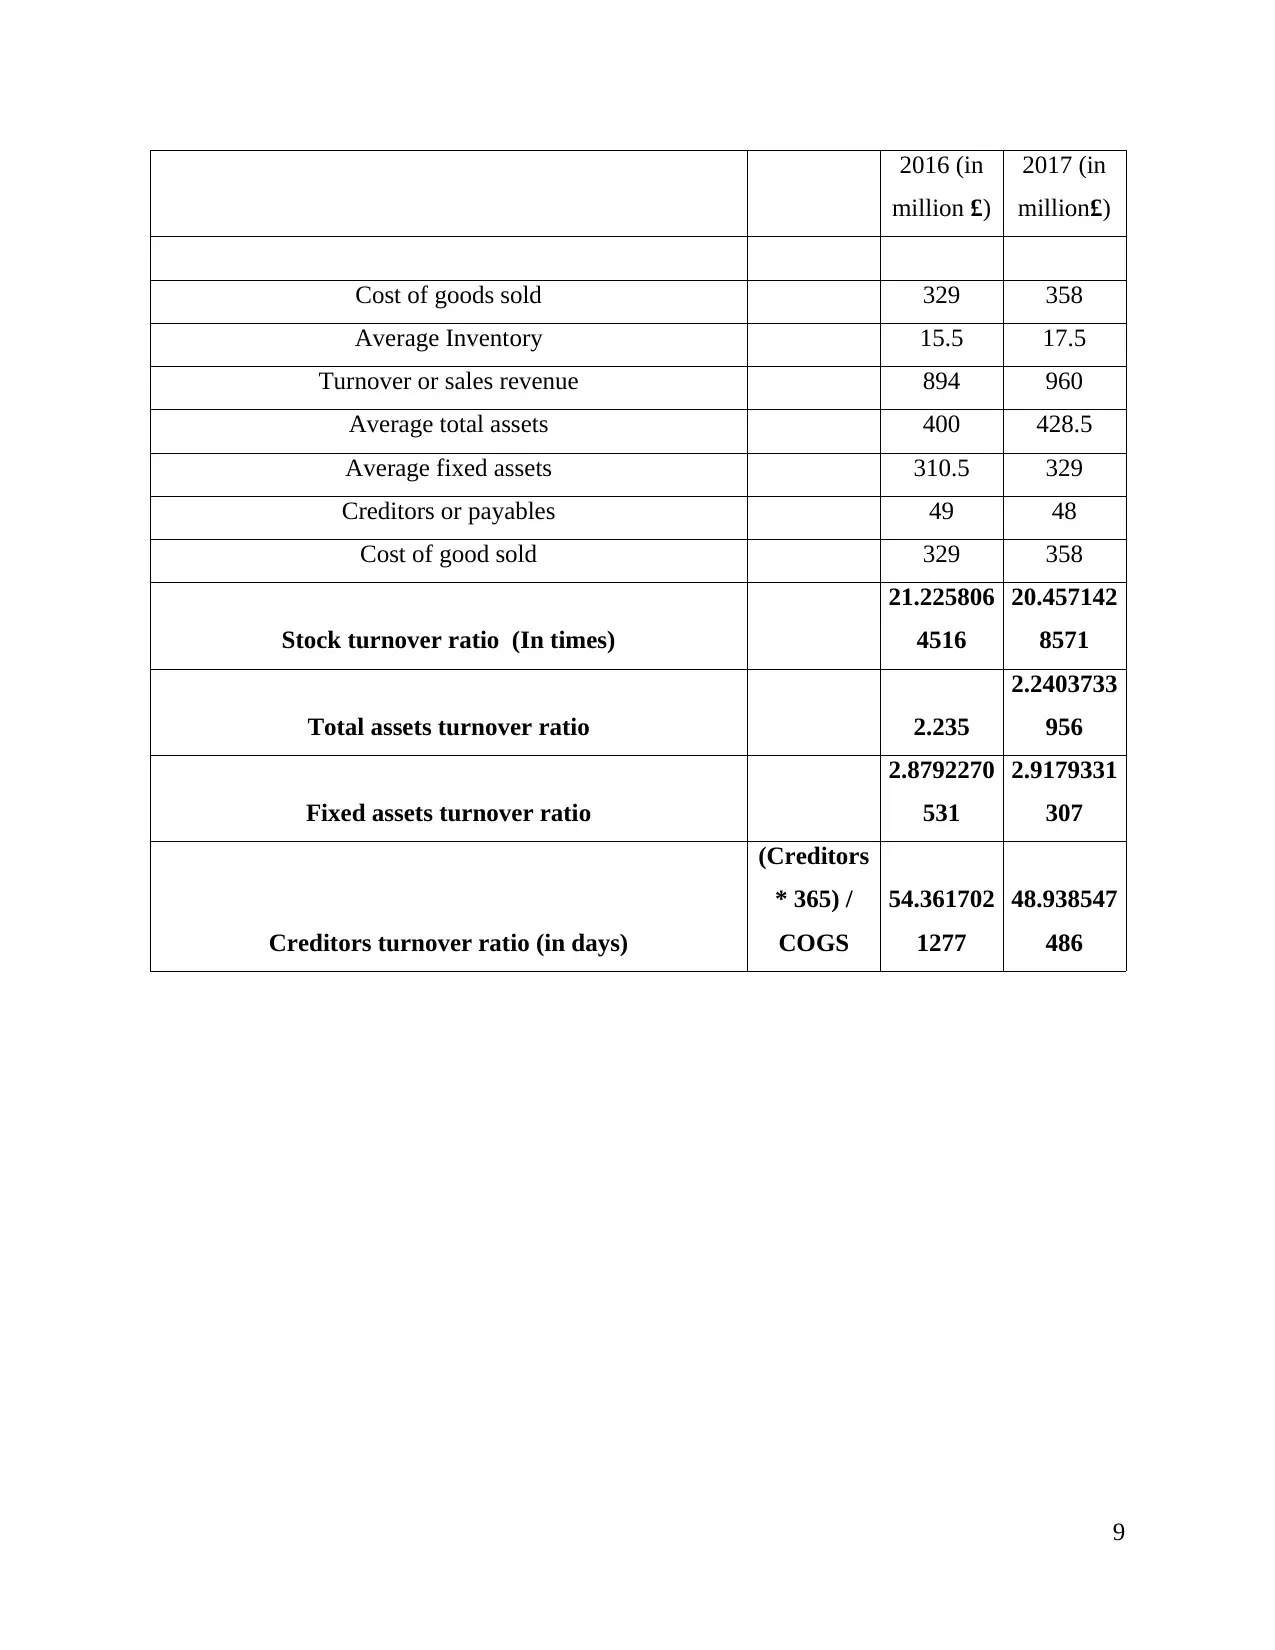
This report presents a financial strategic analysis of Greggs PLC, the largest bakery chain in the UK, focusing on its performance between 2016 and 2017. The analysis begins with an overview of Greggs PLC, highlighting its market position and strategic investments. The core of the report involves a detailed ratio analysis, evaluating profitability (gross profit, net profit, return on capital employed, and return on assets), liquidity (current and quick ratios), solvency (debt-equity ratio), and efficiency ratios (stock turnover, total asset turnover, fixed asset turnover, and creditor turnover). The analysis reveals key trends, such as a consistent gross profit margin, but lower net profit, indicating high operating expenses. The report also highlights the company's liquidity challenges and improvements in solvency. Finally, the report provides suggestions for future prospects, including the importance of strategic investments, cost management, supply chain optimization, and maintaining a going concern status for long-term success. The report concludes with references to books, journals, and online resources used in the analysis, along with an appendix containing detailed ratio calculations.

FINANCIAL STRATEGIC
ANALYSIS OF GREGGS PLC.
Paraphrase This Document
Need a fresh take? Get an instant paraphrase of this document with our AI Paraphraser

TABLE OF CONTENTS
INTRODUCTION...........................................................................................................................1
PART 1: CONTEXT AND OVERVIEW........................................................................................1
PART 2 RATION ANALYSIS AND EVALUATION...................................................................1
Greggs Plc Financial performance..............................................................................................1
REFERENCES................................................................................................................................3
APPENDIX......................................................................................................................................4
Ratio anlaysis..............................................................................................................................4

INTRODUCTION
PART 1: CONTEXT AND OVERVIEW
Greggs plc is the largest bakery chain in United Kingdom as it had attained expertise in
savoury products like sausage rolls, sandwiches, bakes and sweet items such as vanilla slices and
doughnuts. The organisation has a great standing for freshly prepared foods that their consumer
can trust at the affordable prices and it aims at becoming the costumers' favourite. In 2106
organisation have performed at good level at it has developed freshly prepared food line with the
changing food trends in the UK (A CORE Strategic Financial Analysis of Greggs Plc, 2018).
The Greggs Plc have made great progress in its £25 million program in investments and the in
future it has made a plan to invest £100 million. The company had a tremendous journey so far
as form a traditional bakery business it has transformed itself onto a winning brand in the
dynamic food chain on the go market. This report would provide brief discussion about financial
analysis of Greggs plc over 2016 and 2017.
PART 2 RATION ANALYSIS AND EVALUATION
Greggs Plc Financial performance
Profitability ratio analysis:
GP ratio
NP ratio
Return on capital employed
Return on assets
0
0.1
0.2
0.3
0.4
0.5
0.6
0.7 63.00%
6.00%
29.00%
15.00%
63.00%
6.00%
24.00%
13.00%
2016
2017
The financial performance of Greggs plc is for the year 2016 can be defined as the total
sales for the years amounted to £894.2 million. The profits before tax of the organisation
1
⊘ This is a preview!⊘
Do you want full access?
Subscribe today to unlock all pages.

Trusted by 1+ million students worldwide

amounted to £80.3 millions. For the same year diluted earning per share stands at £6.8 and
ordinary divined was 31.0£.The return of the capital employed of the organisational was 28.1%
respectively.
While analysing financial performance of Greggs Plc over year 2016 to 2017 with
context of various parameters such as profitability ratio, liquidity ratio, solvency and efficiency
ratio. With context to profitability ratio, it has been articulated that company is giving constant
gross profit of 63% which is good signal. On the contrary, its net profit was very low
comparatively to gross profit which says that it has high operating expense which must be traced.
Similarly, return on assets and capital employed both decreased from 2016 to 2017 (Williams
and Dobelman, 2017). Thus, it has been evaluated that its profitability is not up to mark, so this
must keep proper track of its expenses to attain high profit margin, return on assets and capital
employed as well.
Evaluation of Liquidity ratio:
In the similar aspect, there is evaluation of liquidity ratio with context to two parameters
such as current ratio and quick ratio. It has been analysed that both are not able to reach ideal
ratio as 2:1 and 1:1 respectively. In simple words, company is not capable to repay its current
and quick liabilities. The current ratio have seen a growth in 2017 form 2016 and same for the
quick ratio as well (Mohanram, Saiy and Vyas, 2018). The changes are too minor but it is due to
2
Current ratio Quick ratio
0
0.1
0.2
0.3
0.4
0.5
0.6
0.7
0.8
0.9
0.77
0.52
0.84
0.55
2016
2017
Paraphrase This Document
Need a fresh take? Get an instant paraphrase of this document with our AI Paraphraser

change in the current and quick asset with this current liabilities have also increased but with
lesser amount.
Analysis of Solvency ratio:
For the solvency ratio it has been identified that there is a significant reduction in the long
term debt of company from 30 to 14 million and this resulted in changing the ratio 0.05 to 0.11
times from 2016 to 2017. Even the shareholders' equity have also increased by 34 million pound.
There is an increase in both cost of debts and revenues but the amount of sales revenue is higher
than COGS which lead to reduction of stock turnover ratio from 21.22 to 20.45 times.
3
Debt-equity ratio
0
0.02
0.04
0.06
0.08
0.1
0.12 0.11
0.05
2016
201

Efficiency ratios analysis
Stock turnover ratio (In times)
Total assets turnover ratio
Fixed assets turnover ratio
Creditors turnover ratio (in days)
0
10
20
30
40
50
60
21.22
2.235 2.87
54.36
20.45
2.24 2.91
48.93
2016
2017
The total asset turnovers ratio is almost at the same position with a minor changes but is
stable at 2.2. There is slight change in the fixed asset turnover ratio which have increased to 2.91
from 2.87 in a time period of 1 financial year (Sari, Saputra and Siahaan, 2018). From 2016 to
2017 the fixed assets have increased by 19.5 million which must show an increase in the fixed
turnover ratio but it is not due to the fact that there is also an increment in the cost of good soled
by 29 million which mitigated the effect of rise in the asset turnover ratio. Lastly, the creditor
turnover ratio have reduced significantly from 1277 days to 486 days this means the creditors
who used to take time of almost 4 years are now taking a time of only 1.25 year to repay the
dues.
Suggestions for future prospects:
In the future the organisation is planing to increase its investment by almost 300% from
£25 to £100 which is big step. For this it is required to see all the present the future
procreative of investing making the decision and to mating the liquidity posting at the
standard level (Greggs plc Annual Report and Accounts 2016, 2018).
It shall stick to its FRC guidance taking, to maintain the level of cost at present level and
continue to reshape the supply chain of the company in order to support the future
growth.
4
⊘ This is a preview!⊘
Do you want full access?
Subscribe today to unlock all pages.

Trusted by 1+ million students worldwide

The organisation must also continue the practice of being operating as a going concern in
the future as this is challenge for the company with meeting it effectively it can achieve
new heights of success and ensure it long term survival and sustainable success.
5
the future as this is challenge for the company with meeting it effectively it can achieve
new heights of success and ensure it long term survival and sustainable success.
5
Paraphrase This Document
Need a fresh take? Get an instant paraphrase of this document with our AI Paraphraser

REFERENCES
Books and Journals
Williams, E. E. and Dobelman, J. A., 2017. Financial statement analysis. World Scientific Book
Chapters. pp.109-169.
Mohanram, P., Saiy, S. and Vyas, D., 2018. Fundamental analysis of banks: the use of financial
statement information to screen winners from losers. Review of Accounting Studies. 23(1).
pp.200-233.
Sari, A. K., Saputra, H. and Siahaan, A. P. U. P. U., 2018. Financial Distress Analysis on
Indonesia Stock Exchange Companies. International Journal For Innovative Research in
Multidisciplinary Field. 4(3). pp.73-74.
Online
Greggs plc Annual Report and Accounts 2016. 2018. [PDF]. Available through
:<file:///home/user/Downloads/GREGGS_26280_AR20161553008336_1553236481.pdf>.
A CORE Strategic Financial Analysis of Greggs Plc. 2018. [PDF]. Available through
:<file:///home/user/Downloads/ACOREFinancialAnalysisofGreggsCaseStudy20181155300
8353_redacted_1553236481.pdf>.
6

APPENDIX
Ratio anlaysis
Particulars Formula
Year (in
million £)
Year (in
million£)
Profitability ratio analysis
2016 (in
million £)
2017 (in
million£)
Gross Profit 566 602
Net profit 58 57
Sales revenue 894 960
Earnings before interest and tax or operating profit 76 72
Capital employed 265 299
Net income 58 57
Average total assets 400 428.5
GP ratio
Gross
profit /
sales * 100 63% 63%
NP ratio
Net profit /
sales * 100 6% 6%
Return on capital employed
EBIT /
capital
employed 29% 0.24
Return on assets
Net
income /
avearge
total assets 0.15 0.13
Liquidity ratio analysis
7
⊘ This is a preview!⊘
Do you want full access?
Subscribe today to unlock all pages.

Trusted by 1+ million students worldwide

2016 (in
million £)
2017 (in
million £)
Current assets 93 107
Current liabilities 121 128
Inventory 16 19
Prepaid expenses 14 17
Quick assets 63 71
Current ratio
Current
assets /
current
liabilities 0.77 0.84
Quick ratio
Current
assets -
(stock +
prepaid
expenses) 0.52 0.55
Solvency ratio analysis
2016 (in
million £)
2017 (in
million £)
Long-term debt 30 14
Shareholder's equity 265 299
Debt-equity ratio
Long-term
debt /
shareholde
rs equity 0.11 0.05
Efficiency ratio analysis
8
million £)
2017 (in
million £)
Current assets 93 107
Current liabilities 121 128
Inventory 16 19
Prepaid expenses 14 17
Quick assets 63 71
Current ratio
Current
assets /
current
liabilities 0.77 0.84
Quick ratio
Current
assets -
(stock +
prepaid
expenses) 0.52 0.55
Solvency ratio analysis
2016 (in
million £)
2017 (in
million £)
Long-term debt 30 14
Shareholder's equity 265 299
Debt-equity ratio
Long-term
debt /
shareholde
rs equity 0.11 0.05
Efficiency ratio analysis
8
Paraphrase This Document
Need a fresh take? Get an instant paraphrase of this document with our AI Paraphraser

2016 (in
million £)
2017 (in
million£)
Cost of goods sold 329 358
Average Inventory 15.5 17.5
Turnover or sales revenue 894 960
Average total assets 400 428.5
Average fixed assets 310.5 329
Creditors or payables 49 48
Cost of good sold 329 358
Stock turnover ratio (In times)
21.225806
4516
20.457142
8571
Total assets turnover ratio 2.235
2.2403733
956
Fixed assets turnover ratio
2.8792270
531
2.9179331
307
Creditors turnover ratio (in days)
(Creditors
* 365) /
COGS
54.361702
1277
48.938547
486
9
1 out of 11
Related Documents

Your All-in-One AI-Powered Toolkit for Academic Success.
+13062052269
info@desklib.com
Available 24*7 on WhatsApp / Email
Unlock your academic potential
Copyright © 2020–2025 A2Z Services. All Rights Reserved. Developed and managed by ZUCOL.