HE6 Civil Engineering: CIE5005 Sieve Analysis & Meter Test Report

Verified

Added on  2023/06/10

|14
|2058
|184
Practical Assignment
AI Summary
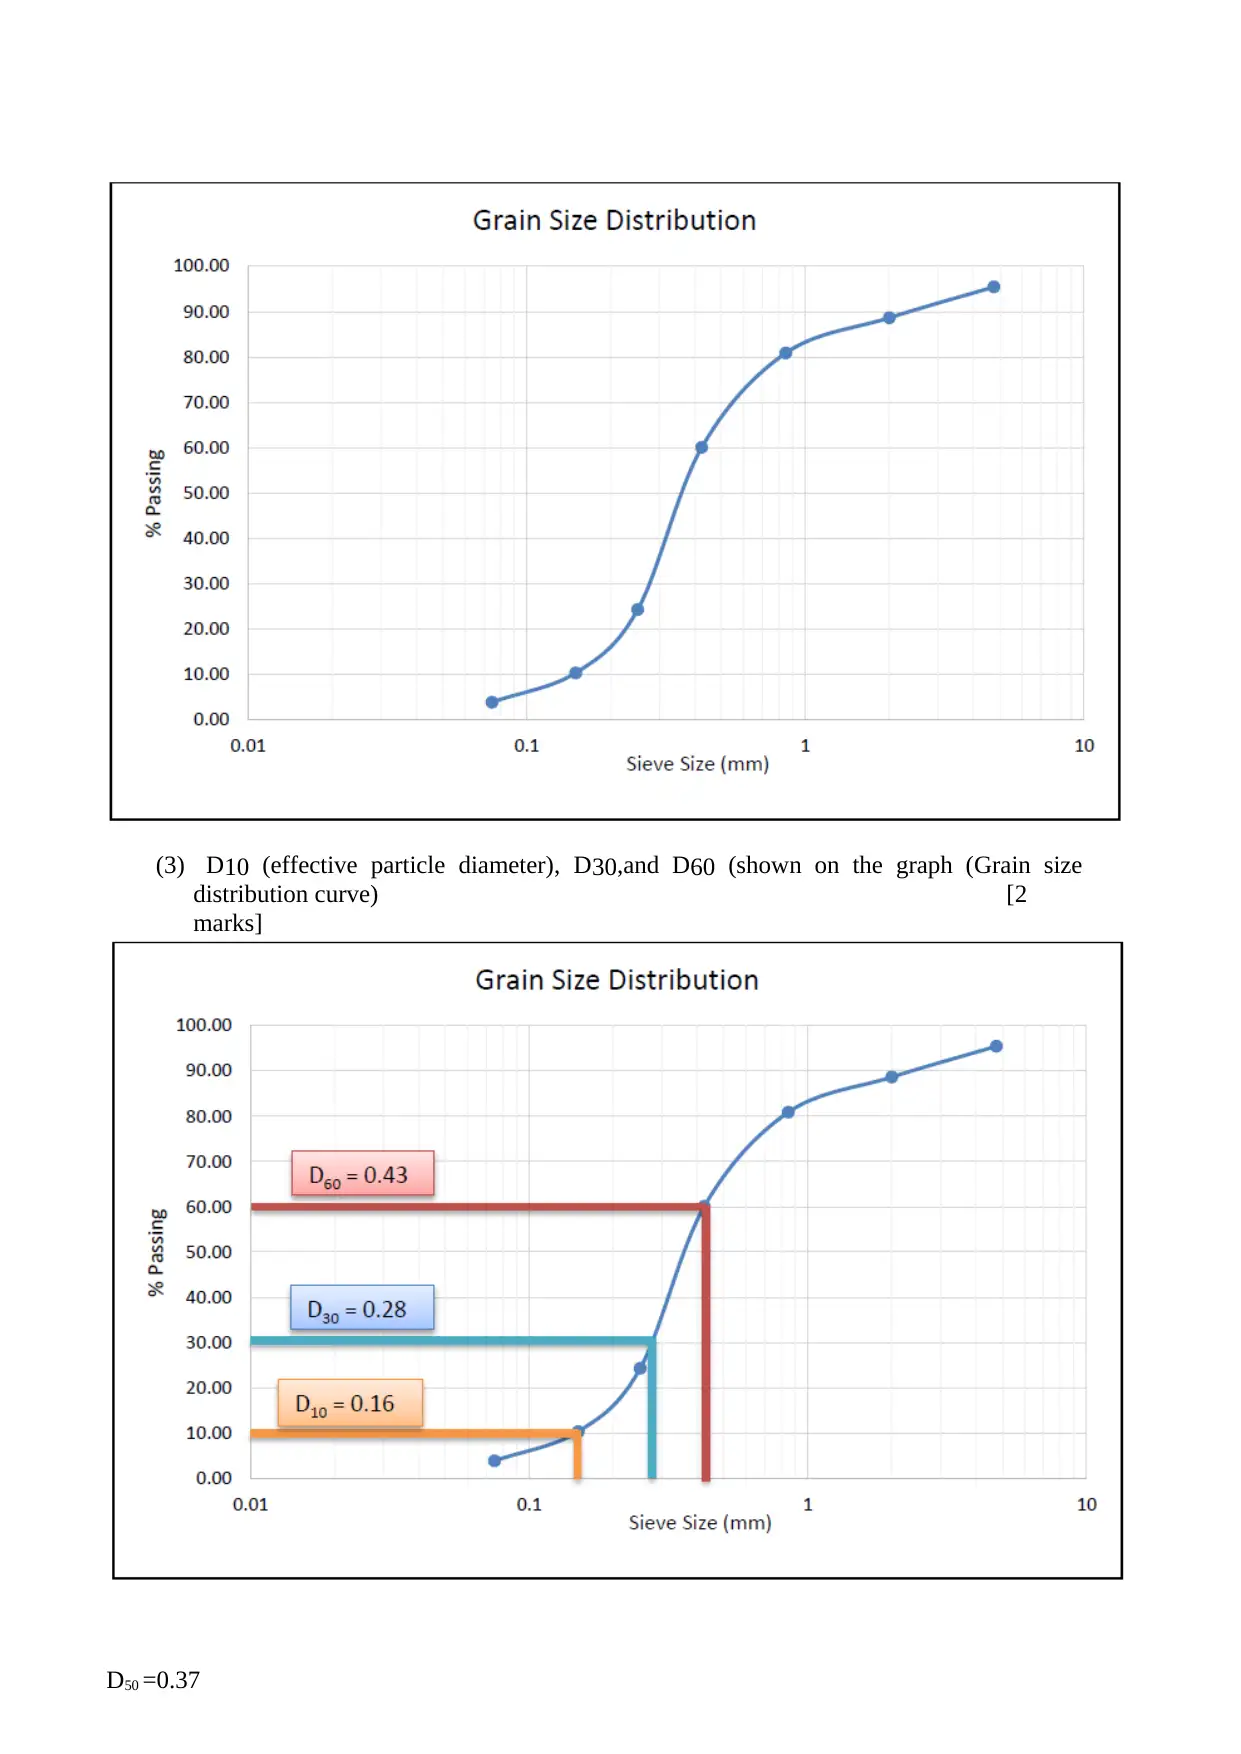
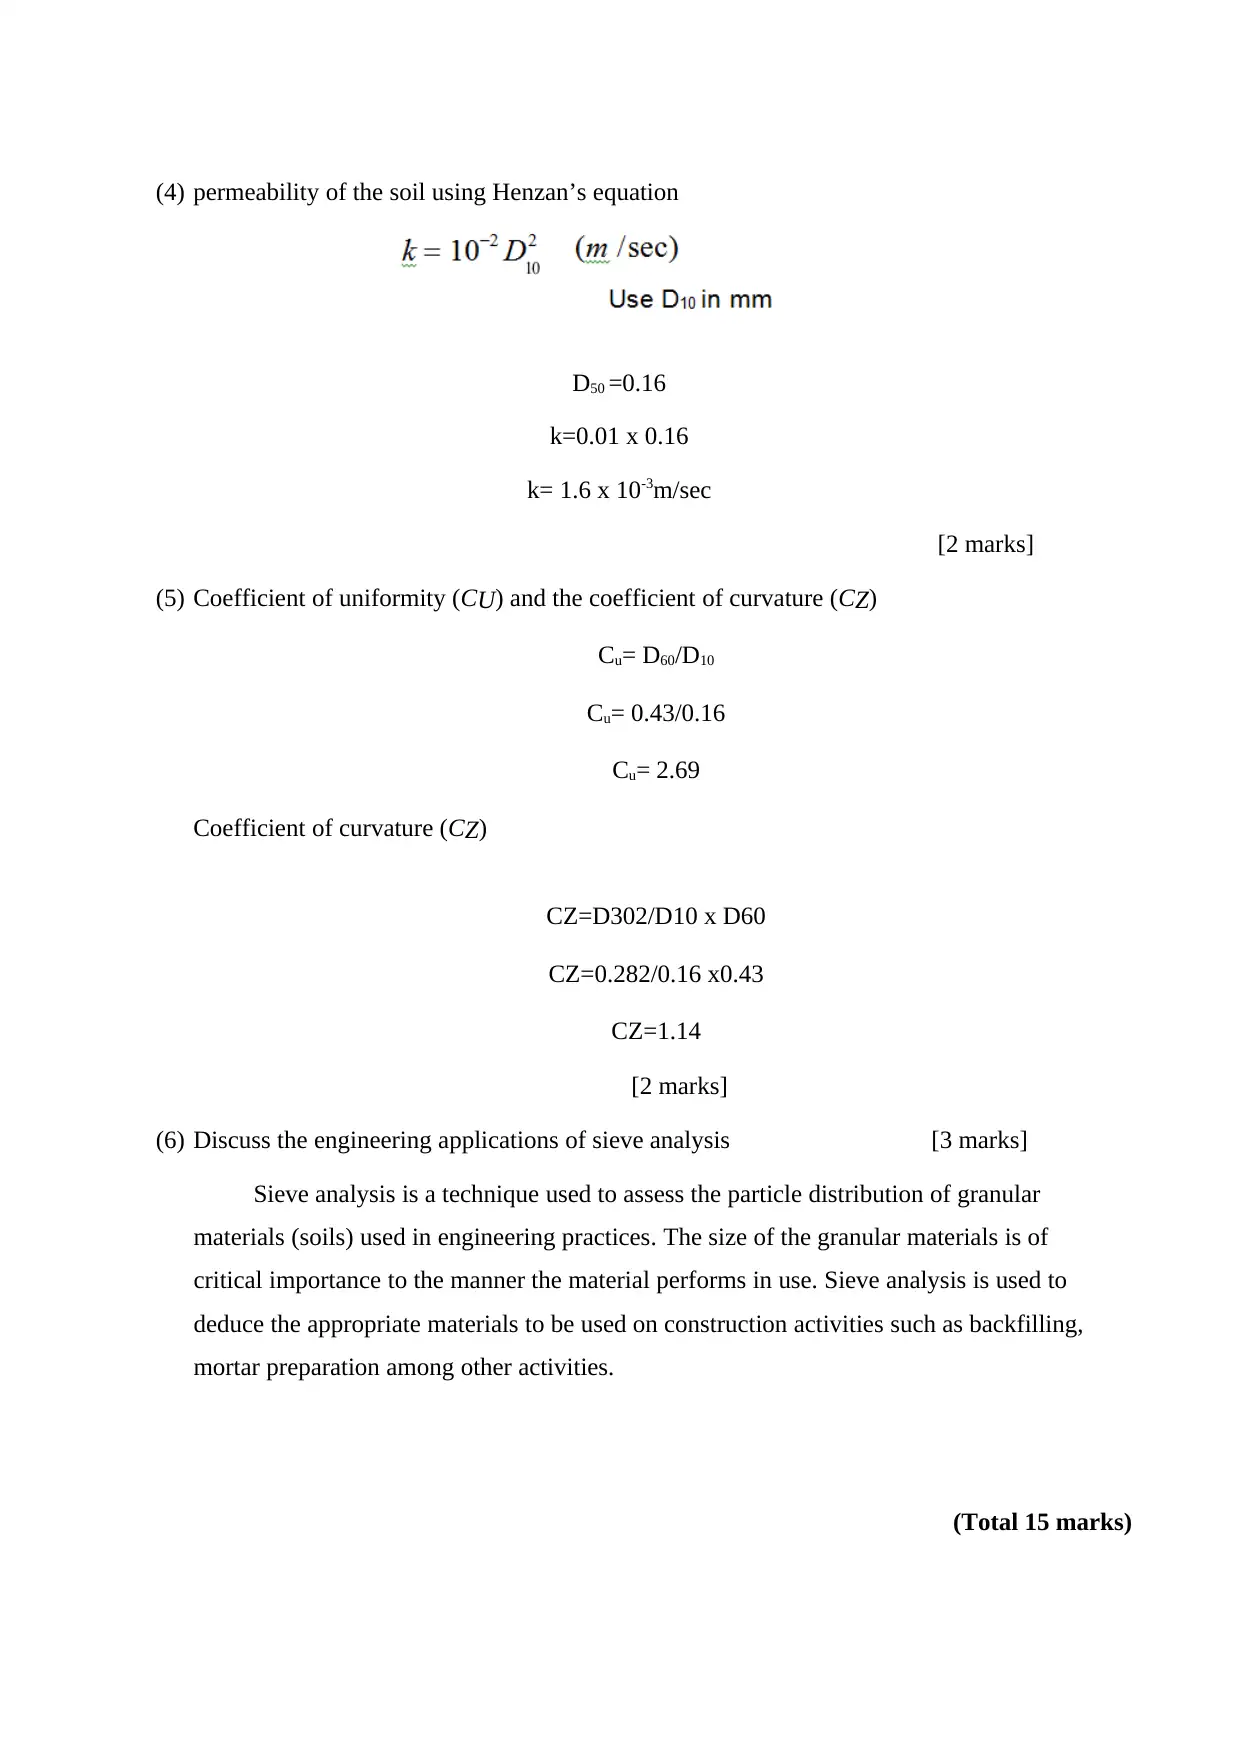
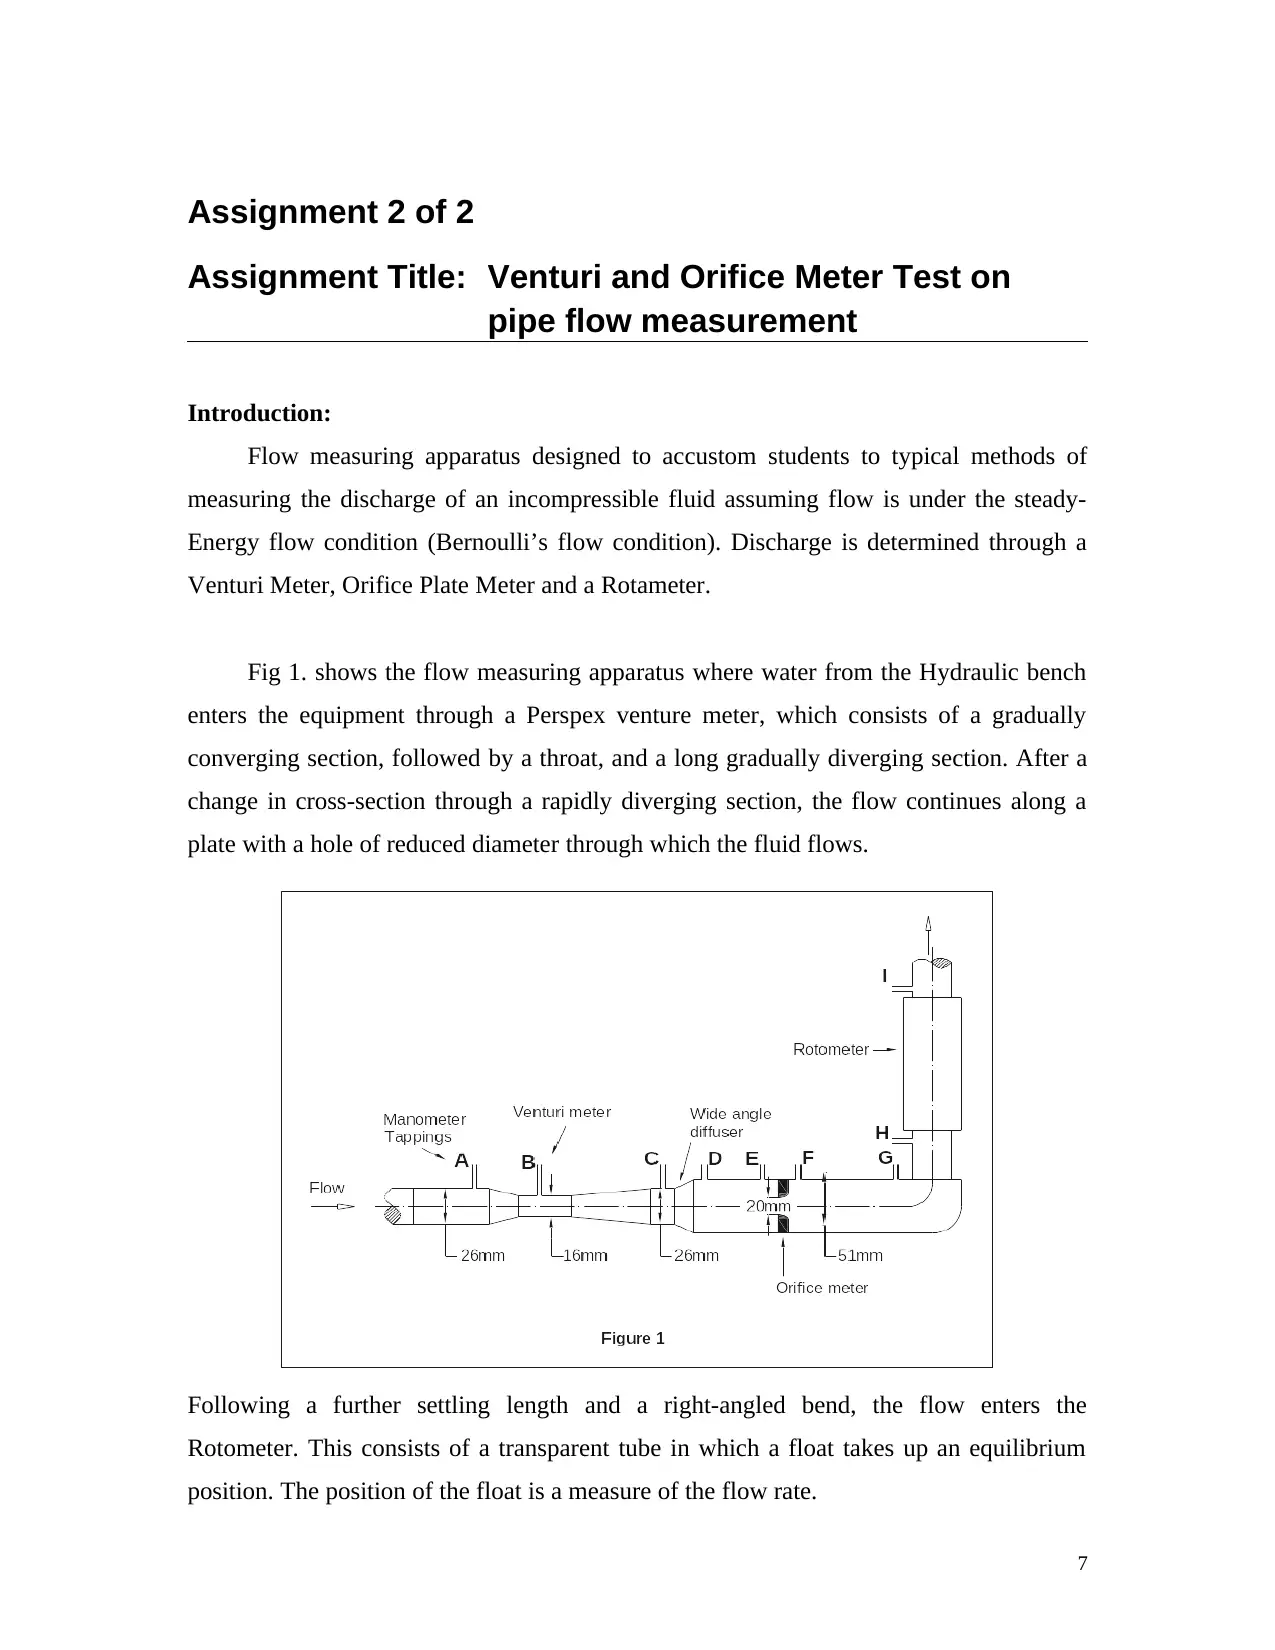
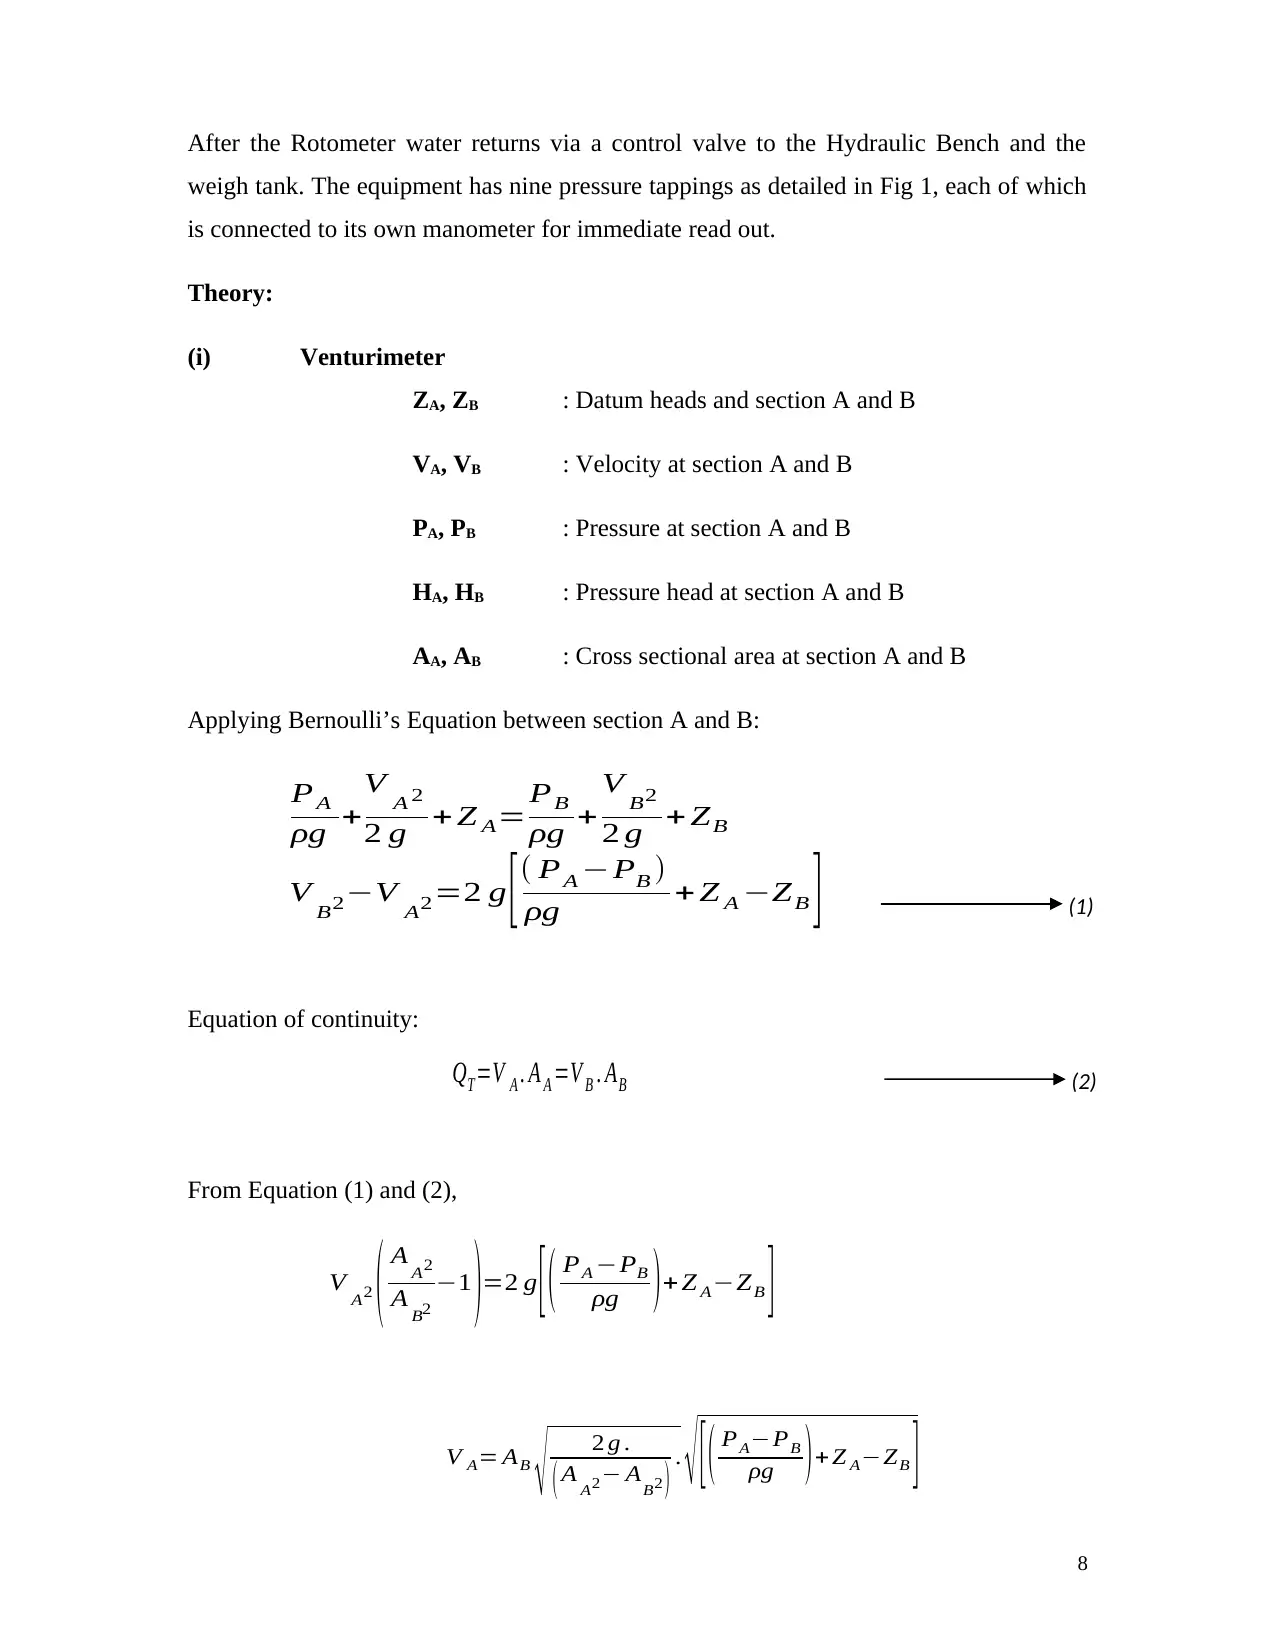
This document presents a student's lab report focusing on two key experiments: Sieve Analysis and Venturi & Orifice Meter tests. The Sieve Analysis experiment details the process of determining particle size distribution in a soil sample, including calculations of uniformity and curvature coefficients, and a discussion of engineering applications. The Venturi and Orifice Meter test explores methods for measuring fluid discharge, comparing the performance and characteristics of Venturi and Orifice meters, including head loss and kinetic energy considerations. The report includes experimental procedures, results, calculations, and discussions, providing a comprehensive overview of these fundamental civil engineering practices. Desklib provides access to a wealth of similar assignments and study resources for students.
Document Page
STUDY WORLD LANKA CAMPUS
BEng (Hons) in Civil Engineering
___________________________________________________________________
Level HE6
___________________________________________________________________
Module Title: GROUND AND WATER STUDIES 2
Module Number: CIE5005
Assignment 1 of 2
Assignment Title: Sieve Analysis Test
________________________________________________________________
Module Tutor : Mr Charith Fonseka
A total of 30 marks are allocated for laboratory reports
tabler-icon-diamond-filled.svg

Paraphrase This Document

Need a fresh take? Get an instant paraphrase of this document with our AI Paraphraser
Document Page
Aim
The success of any geotechnical engineering design is heavily dependent on engineering properties
of soils/rocks that involve with the project. Therefore, it is essential to measure engineering
properties of soils/rocks accurately following the given standards and specifications.
Objectives
Give students some hands on experience on laboratory testing of geo materials
Classify clay fines using plastic properties and identify its engineering applications
Give experience on group work, data sharing, and reporting experimental findings
Problem statement
In this Lab practice, we are required to:
Conduct the practical following the instructions given in the lab sheet.
Clean up the equipment and area after the session
Prepare a report, which consists of answers to all questions in “Calculations & Discussions”
section of all three experiments.
Practical
This test is carried out to determine the percentages present of various sizes (governed by sieves
used) of particles in a soil (generally on soil particles coarser than 212 μm).
Equipment:
Set of sieves with different mesh opening sizes
Brush to clean sieves
Electronic balance
Shaker to shake that stack of sieves
Oven to dry soil
Watch (or Stopwatch)
Document Page
Figure 1: Equipment used for sieve analysis
Materials: Soil (sand)
Procedure:
a. A set of sieves was selected and cleaned
b. The weight of each sieve was measured and recorded
c. The sieves were stack in shaking apparatus
d. 500g of dry sand was obtained and poured it into the top sieve in the stack (Mass of sand
was measured and noted before putting into the top sieve)
e. The top sieve was closed by use of a lid and the stack of sieves were shaken for 3 ~ 5
min
f. The mass of each sieve was measured with retained sand and the values recorded.
g. The retained sand in each sieve was removed and the sieves were cleaned.
Note: The water content of the sand was assumed to be zero since the sand was oven dried.
Document Page
Calculations & Discussions:
(1) Completed data sheet [3 marks]
(2) The
‘Percentage finer’ vs. the ‘Particle size’ plot
[3 marks]
Col 1 Col 2 Col 3 Col 4 Col 5 Col 6 Col 7
Sieve
Size
(mm)
Mass
Of sieve
(g)
Mass
Of sieve
+
retained
Soil (g)
Mass of
Retained
Soil(g)
(Col3-
C0l 2)
Cumulative
Retained
Mass(g)
Cumulativ
e
% retained
(Col5/ms
*100)
%
passing
(100-
Col 6)
4.75 116.23 166.13 49.9 49.9 4.53 95.47
2.0 99.27 135.77 36.5 86.4 11.34 88.66
0.84 97.58 139.68 42.1 128.5 19.13 80.87
0.425 98.96 138.96 40 168.5 39.87 60.13
0.25 91.46 114.46 23 191.5 75.69 24.31
0.106 93.15 184.15 91 282.5 89.64 10.36
0.075 90.92 101.12 10.2 292.7 96.12 3.88
PAN 70.19 301.19 231 523.7 100 0.00
tabler-icon-diamond-filled.svg

Paraphrase This Document

Need a fresh take? Get an instant paraphrase of this document with our AI Paraphraser
Document Page
(3) D10 (effective particle diameter), D30,and D60 (shown on the graph (Grain size
distribution curve) [2
marks]
D50 =0.37
Document Page
(4) permeability of the soil using Henzan’s equation
D50 =0.16
k=0.01 x 0.16
k= 1.6 x 10⁻³m/sec
[2 marks]
(5) Coefficient of uniformity (CU) and the coefficient of curvature (CZ)
Cu= D60/D10
Cu= 0.43/0.16
Cu= 2.69
Coefficient of curvature (CZ)
CZ=D302/D10 x D60
CZ=0.282/0.16 x0.43
CZ=1.14
[2 marks]
(6) Discuss the engineering applications of sieve analysis [3 marks]
Sieve analysis is a technique used to assess the particle distribution of granular
materials (soils) used in engineering practices. The size of the granular materials is of
critical importance to the manner the material performs in use. Sieve analysis is used to
deduce the appropriate materials to be used on construction activities such as backfilling,
mortar preparation among other activities.
(Total 15 marks)
Document Page
Assignment 2 of 2
Assignment Title: Venturi and Orifice Meter Test on
pipe flow measurement
Introduction:
Flow measuring apparatus designed to accustom students to typical methods of
measuring the discharge of an incompressible fluid assuming flow is under the steady-
Energy flow condition (Bernoulli’s flow condition). Discharge is determined through a
Venturi Meter, Orifice Plate Meter and a Rotameter.
Fig 1. shows the flow measuring apparatus where water from the Hydraulic bench
enters the equipment through a Perspex venture meter, which consists of a gradually
converging section, followed by a throat, and a long gradually diverging section. After a
change in cross-section through a rapidly diverging section, the flow continues along a
plate with a hole of reduced diameter through which the fluid flows.
Following a further settling length and a right-angled bend, the flow enters the
Rotometer. This consists of a transparent tube in which a float takes up an equilibrium
position. The position of the float is a measure of the flow rate.
7
tabler-icon-diamond-filled.svg

Paraphrase This Document

Need a fresh take? Get an instant paraphrase of this document with our AI Paraphraser
Document Page
After the Rotometer water returns via a control valve to the Hydraulic Bench and the
weigh tank. The equipment has nine pressure tappings as detailed in Fig 1, each of which
is connected to its own manometer for immediate read out.
Theory:
(i) Venturimeter
ZA, ZB : Datum heads and section A and B
VA, VB : Velocity at section A and B
PA, PB : Pressure at section A and B
HA, HB : Pressure head at section A and B
AA, AB : Cross sectional area at section A and B
Applying Bernoulli’s Equation between section A and B:
Equation of continuity:
From Equation (1) and (2),
(1)
(2)
8
PA
ρg +
V A 2
2 g + Z A=PB
ρg +
V B2
2 g + ZB
V B2V A2=2 g [ ( PA PB )
ρg + Z A ZB ]
QT =V A . A A =V B . AB
V A2 ( A A2
A B2
1 )=2 g [ ( PA PB
ρg ) + Z AZB ]
V A= AB
2 g .
( A A2 AB2 ) . [ ( PAPB
ρg ) + Z AZB ]
Document Page
Compared to pressure head and velocity head, datum head is negligible;
Compared to theoretical flow rate actual flow rate is little short. Hence Actual flow rate is
given by;
Cd - Coefficient of discharge
By considering Log and rearranging above equation;
Log ( Qactual ) =1
2 Log ( H AH B ) + Log
( Cd . A A
2 g
( A A
AB )
2
1 )
Y = m . X + C
Cd Can be found from the intercept (C) of the equation 3.
Head loss across the Venturi meter is H AH c
Inlet Kinetic Energy :
V A2
2 g
(ii) Orifice meter
Applying Bernoulli’s Equation between section E and F:
Qactual=Cd . AE . AF
2 g ( H EH F )
( AE2A F2 )
(3)
9
QA= A A . AB
2 g ( H AH B )
( A A2A B2 )
Qactual=Cd . A A . AB
2 g ( H A HB )
( A A2AB2 )
Document Page
Here Cd consists of two factors;
Cd = Cc . Cv
Cv : Ratio of actual velocity to ideal velocity at the orifice.
Cc : Ratio of effective cross sectional area of flow at the contracted section to the actual
cross sectional area of the orifice.
Head loss across the Orifice meter is 0 . 83× ( H EH F ) .
In orifice meter there is a slight increase of pressure head due to reflection of impact
pressure from the orifice wall. Hence desired head difference across the Orifice meter is
less than that of measured.
Inlet Kinetic Energy:
1
16 .
V A2
2 g
For comparison purposes we can define a dimensionless parameter as follows;
Apparatus:
1. Flow measuring apparatus
2. Measuring cylinder
3. Stop watch
10
I = head loss
inlet kinetic energy
tabler-icon-diamond-filled.svg

Paraphrase This Document

Need a fresh take? Get an instant paraphrase of this document with our AI Paraphraser
Document Page
Procedure:
1. The inlet valve was opened by keeping the flow rate minimum.
2. Manometer reading was recorded corresponding to Venturi meter and Orifice meter
once flow reach steady state condition.
3. The time taken to fill the volumetric cylinder was recorded.
Results and Calculations
Venturimeter Orifice meter
D 1=26mm, D2=16 D1= 20mm,
D2=51mm
Test Mass
Kg
Time
(S)
Flow
rate
m3/s
x10-4
H1mm H2mm ∆H
m
H1mm H2mm ∆H
m
1 6 12.80 4.7 380 113 0.267 368 63 0.305
2 6 13.39 4.5 360 113 0.247 352 80 0.272
3 6 14.74 4.1 340 138 0.202 333 100 0.233
4 6 13.39 3.7 320 158 0.162 313 128 0.185
5 6 18.58 3.3 300 175 0.125 295 153 0.142
6 6 22.75 2.7 279 195 0.084 274 183 0.091
11
Document Page
Plot;
Discussion:
Variation in the height of the water column of the venture meter is less than the
variation in the height of water column in the orifice plate this is for the reason that the
difference in diameter of the areas of orifice is more than the venture meter. So we can
say that the difference in height of water column is directly proportional to the difference
in the diameter of the area.
1. Venturimeter
Advantages of Venturimeter
12
chevron_up_icon
1 out of 14
circle_padding
hide_on_mobile
zoom_out_icon
[object Object]