GSB003 Managing Financial Resources: Billabong International Analysis
VerifiedAdded on 2023/06/11
|21
|4235
|423
Report
AI Summary
This report provides an in-depth financial statement analysis of Billabong International Limited, an Australian clothing retailer. It covers the company's financial performance, key financial issues, and a global overview of its market position. The analysis includes a comparison of average prices with competitors, an examination of branding and market position events, and an assessment of the impact of the Global Financial Crisis (GFC). Critical factors for financial viability are identified, and a comprehensive ratio analysis is performed, including liquidity, asset management, profitability, and leverage ratios. The report concludes with a summary of the findings, offering insights into Billabong's financial health and strategic direction. Desklib provides access to similar past papers and solved assignments for students.
Running Head: FINANCIAL STATEMNET ANALYSIS 0
Billabong International Limited
Financial Statement Analysis
Billabong International Limited
Financial Statement Analysis
Paraphrase This Document
Need a fresh take? Get an instant paraphrase of this document with our AI Paraphraser
FINANCIAL STATEMNET ANALYSIS 1
Executive Summary
The below report provides an overview about an Australian Company Billabong International
which deals in clothing segment of the industry. An in depth analysis of the financial
performance of the company has been done along with the ratio analysis. Further, the global
review is also done to view the market position of the company in terms of its competitors.
Also the impact of the global financial crisis has been undertaken and the list of events that
lead to this kind of financial position has also been discussed relevantly.
FINANCIAL STATEMNET ANALYSIS 2
Table of Contents
Introduction................................................................................................................................2
Financial Performance...............................................................................................................2
Financial issues.......................................................................................................................3
Global Overview........................................................................................................................3
Average Price Comparison........................................................................................................4
Events Branding and Market position........................................................................................5
Impact of GFC........................................................................................................................6
Critical Factors of financial viability......................................................................................7
Ratio Analysis............................................................................................................................7
Liquidity ratios.......................................................................................................................7
Assets management ratio........................................................................................................9
Fixed asset ratio..................................................................................................................9
Profitability Ratios................................................................................................................11
Profit Margin.....................................................................................................................12
Return on Assets...............................................................................................................13
Return on Capital Employed.............................................................................................13
Leverage Ratios....................................................................................................................14
Debt to Equity Ratio.........................................................................................................15
Asset to Equity Ratio........................................................................................................15
Debt to EBITDA...............................................................................................................16
Conclusion................................................................................................................................16
References................................................................................................................................17
⊘ This is a preview!⊘
Do you want full access?
Subscribe today to unlock all pages.
Trusted by 1+ million students worldwide
FINANCIAL STATEMNET ANALYSIS 3
Introduction
Billabong Australia is a surf company, primarily a clothing retailer which is also involved in
the businesses of wide range of accessories such as backpacks, skate boards and products
related to snowboard. This company came into existence on 1973 by Rena merchant and
Gordan and was founded in the Gold coast, Queensland. On 11th of August 2000, the
company was first traded on the Australian Securities Exchange. The name of the company
was derived from the word “bilaban” which means a creek that is operating only in the rainy
season. The most prominent and futuristic brands owned by the company billabong are Von
Zipper and Element.
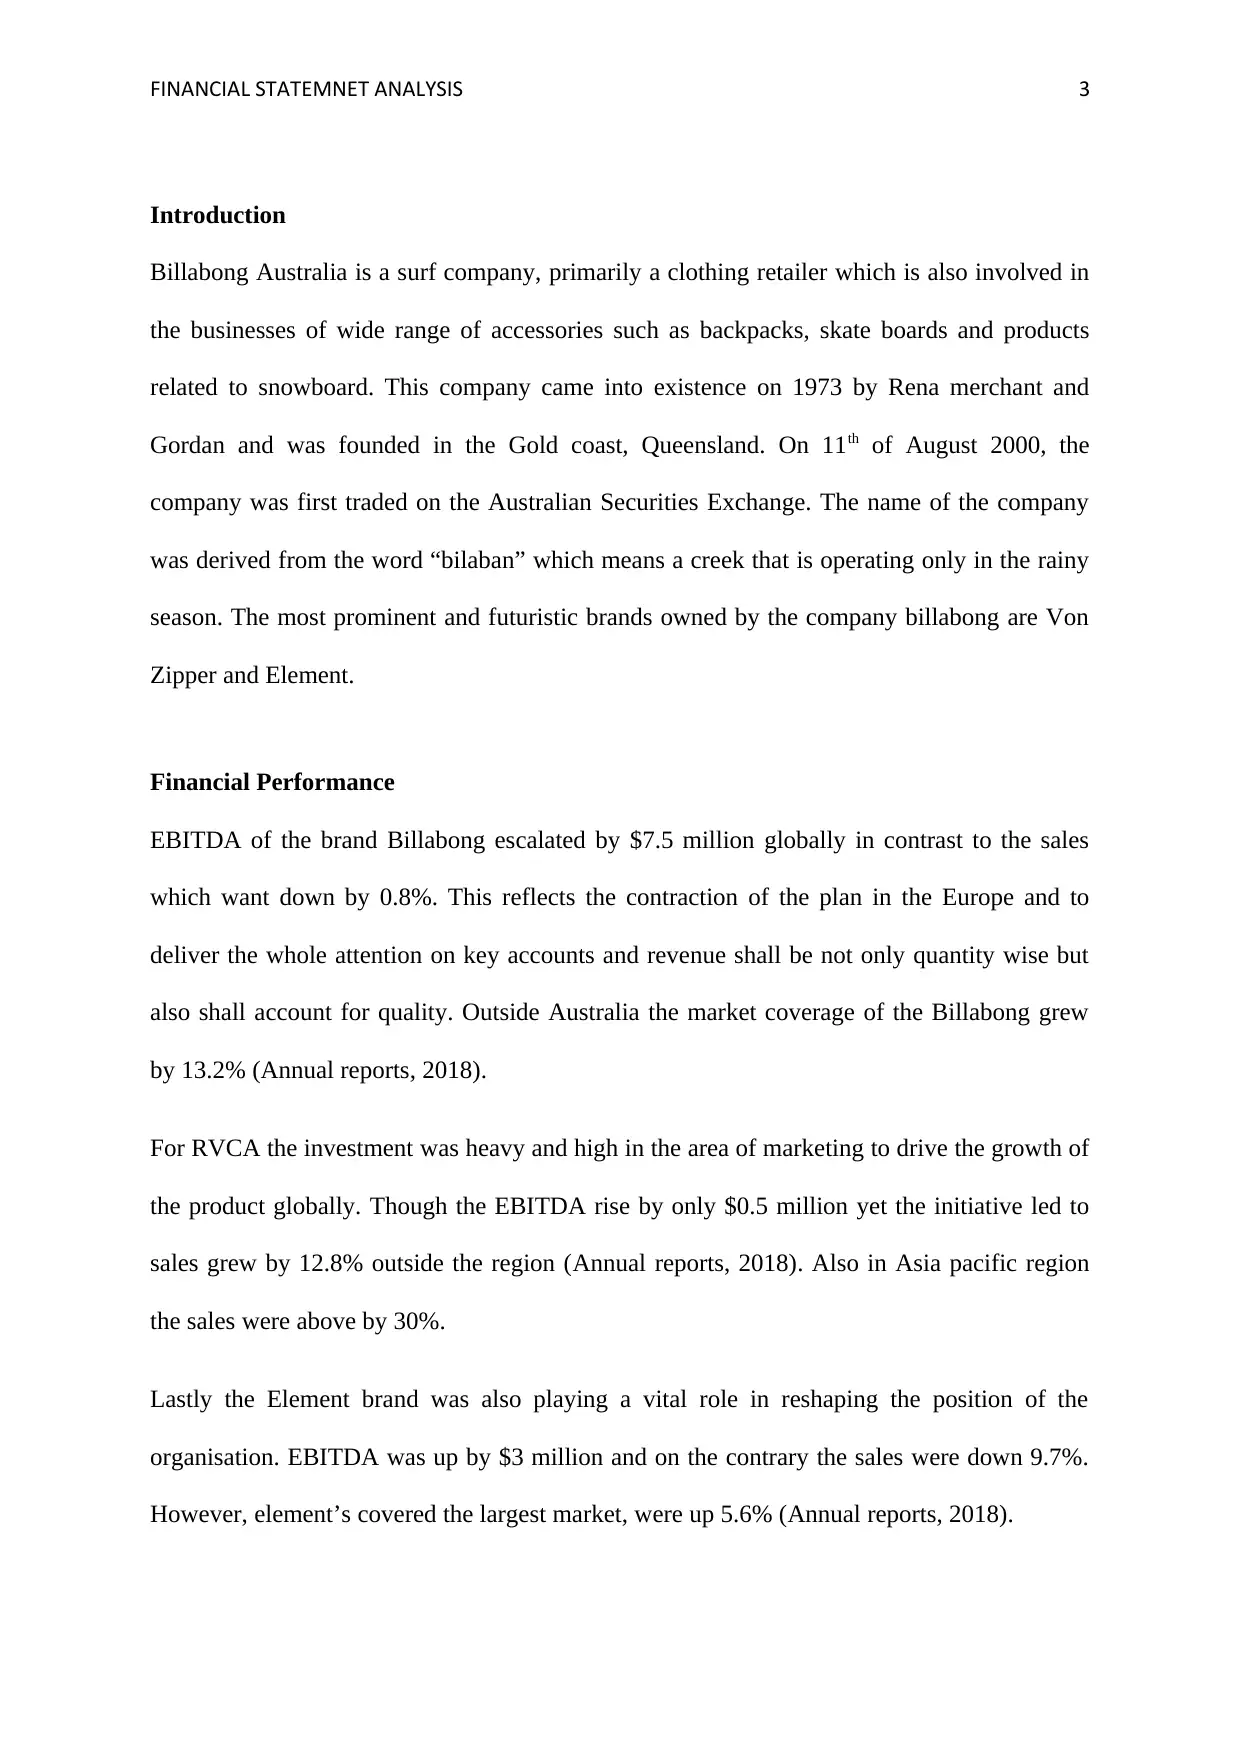
Financial Performance
EBITDA of the brand Billabong escalated by $7.5 million globally in contrast to the sales
which want down by 0.8%. This reflects the contraction of the plan in the Europe and to
deliver the whole attention on key accounts and revenue shall be not only quantity wise but
also shall account for quality. Outside Australia the market coverage of the Billabong grew
by 13.2% (Annual reports, 2018).
For RVCA the investment was heavy and high in the area of marketing to drive the growth of
the product globally. Though the EBITDA rise by only $0.5 million yet the initiative led to
sales grew by 12.8% outside the region (Annual reports, 2018). Also in Asia pacific region
the sales were above by 30%.
Lastly the Element brand was also playing a vital role in reshaping the position of the
organisation. EBITDA was up by $3 million and on the contrary the sales were down 9.7%.
However, element’s covered the largest market, were up 5.6% (Annual reports, 2018).
Introduction
Billabong Australia is a surf company, primarily a clothing retailer which is also involved in
the businesses of wide range of accessories such as backpacks, skate boards and products
related to snowboard. This company came into existence on 1973 by Rena merchant and
Gordan and was founded in the Gold coast, Queensland. On 11th of August 2000, the
company was first traded on the Australian Securities Exchange. The name of the company
was derived from the word “bilaban” which means a creek that is operating only in the rainy
season. The most prominent and futuristic brands owned by the company billabong are Von
Zipper and Element.
Financial Performance
EBITDA of the brand Billabong escalated by $7.5 million globally in contrast to the sales
which want down by 0.8%. This reflects the contraction of the plan in the Europe and to
deliver the whole attention on key accounts and revenue shall be not only quantity wise but
also shall account for quality. Outside Australia the market coverage of the Billabong grew
by 13.2% (Annual reports, 2018).
For RVCA the investment was heavy and high in the area of marketing to drive the growth of
the product globally. Though the EBITDA rise by only $0.5 million yet the initiative led to
sales grew by 12.8% outside the region (Annual reports, 2018). Also in Asia pacific region
the sales were above by 30%.
Lastly the Element brand was also playing a vital role in reshaping the position of the
organisation. EBITDA was up by $3 million and on the contrary the sales were down 9.7%.
However, element’s covered the largest market, were up 5.6% (Annual reports, 2018).
Paraphrase This Document
Need a fresh take? Get an instant paraphrase of this document with our AI Paraphraser
FINANCIAL STATEMNET ANALYSIS 4
The financial results of the company after the Net Profit after Tax for the full year to 30th
June were $4.2 million, compared to $233.7 million loss for the previous year entirely. It was
almost a surprise for the company as it returned to full year EBITDA after the year 2008. The
overall result which was derived after eliminating certain items and discounted business the
value amounted to $65.7 million. Also when compared to the previous year the result was up
by 8.9% (Corporate Finance Institute, 2016).
Financial issues
Due to the initial recovery of the company the dividend was not allocated for the year 2015.
For the year 2016-2017 the EBITDA was of $10.8 million for as compared to $21.8 million
of the previous year. If the performance is reviewed from the regional side than the EBITDA
of $11.9 million for the Asia Pacific was highest. EBITDA was $4.8 million for the American
region and $1.3 million for the European region (Annual reports, 2018). On the contrary in
terms of the revenue, the revenue of the American region was highest 1.1% higher, otherwise
for both the European region and Asia pacific region the revenue was 6.5% lower and 3.7%
lower respectively (Sarlin, 2015).
Global Overview
Strong second half lifts EBITDA to $51.1 million up by 2.8%. The results mark a
turning point for the company to build itself for long term.
Europe also rebounded after facing the tough market conditions.
Totals sales are of $974.7 million exclusive of Tigerlily and Sector 9.
Particulars Asia Pacific American European
Bricks and
Comparable Store
0.8% higher 0.7% higher 2.3% down
FINANCIAL STATEMNET ANALYSIS 5
Gross Margin 120 basis point 110 basis point 100 basis point
Ecommerce 28.7% growth Grew by19.5% A growth of 15.1%
Revenue 6.6% lower 1.15% higher 3.7% lower
Income Tax Expense $2.2 million $2.8 million $2.1 million
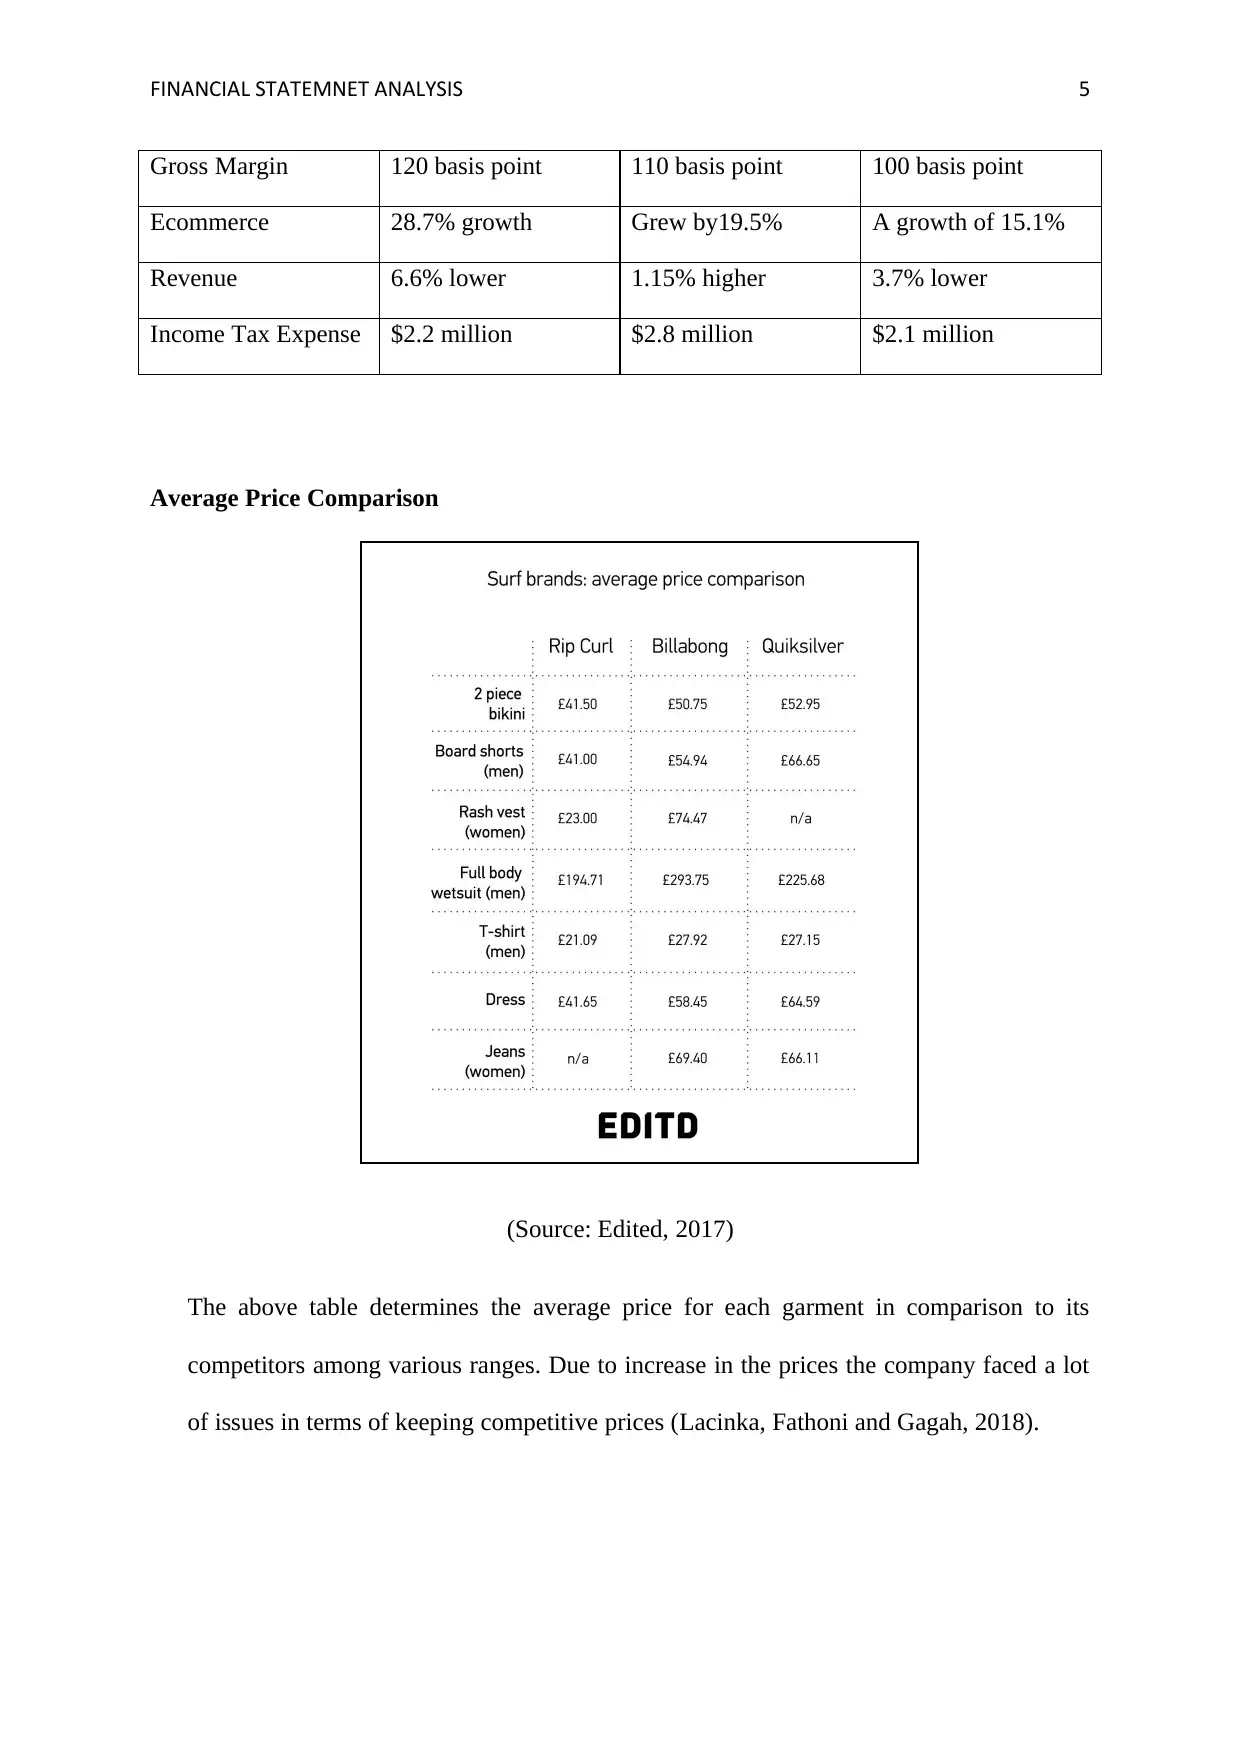
Average Price Comparison
(Source: Edited, 2017)
The above table determines the average price for each garment in comparison to its
competitors among various ranges. Due to increase in the prices the company faced a lot
of issues in terms of keeping competitive prices (Lacinka, Fathoni and Gagah, 2018).
Gross Margin 120 basis point 110 basis point 100 basis point
Ecommerce 28.7% growth Grew by19.5% A growth of 15.1%
Revenue 6.6% lower 1.15% higher 3.7% lower
Income Tax Expense $2.2 million $2.8 million $2.1 million
Average Price Comparison
(Source: Edited, 2017)
The above table determines the average price for each garment in comparison to its
competitors among various ranges. Due to increase in the prices the company faced a lot
of issues in terms of keeping competitive prices (Lacinka, Fathoni and Gagah, 2018).
⊘ This is a preview!⊘
Do you want full access?
Subscribe today to unlock all pages.
Trusted by 1+ million students worldwide
FINANCIAL STATEMNET ANALYSIS 6
Events Branding and Market position
These events provide a wide range of platform through which the company can take
challenge itself for revamping the business to support our world class brands. The year 2014-
2015 has been year of the rebuilding because of the fact that the company was returning to its
original profit state after 2011 (Annual reports, 2018). The performance was achieved
specially by having a team which is focused globally and uniformly. The company had strong
collaborations and relations both within the region as well as in the brands (Sarlin, 2015).
After an in depth analysis the company sold the interest in SurfStitch and the completely
owned Swell in September 2014. Due to this step the transactions were retrieved and entire
control was given to the company. The previously licensed websites which were allocated for
the SurfStithc also retains the supply agreements in bulk (Annual reports, 2018).
The second move was towards the mono brand focus and in particular the major attention
was on three big brands namely Billabong, RVCA, Element are the key drivers in improving
the overall performance of the business (My Accounting Course, 2017).
Consistently following an old logo, the new mantra for success was “fewer, bigger, better”. A
heavy load of the projects were segregated among the four major projects which are given
priority namely Omni-channel, distribution and transportation, customer the cream and
sourcing and chain of supply (Kaur, Aggarwal and Gupta, 2017). These four projects were
provided more evaluation and attention and eventually they helped in accelerating the volume
globally.
The reduction in the distribution costs by $10 million per annum is now an initiative of sober
implementation. The group worked on the closure of the Canadian Warehouse and also
transitioned the third party logistics.
Paraphrase This Document
Need a fresh take? Get an instant paraphrase of this document with our AI Paraphraser
FINANCIAL STATEMNET ANALYSIS 7
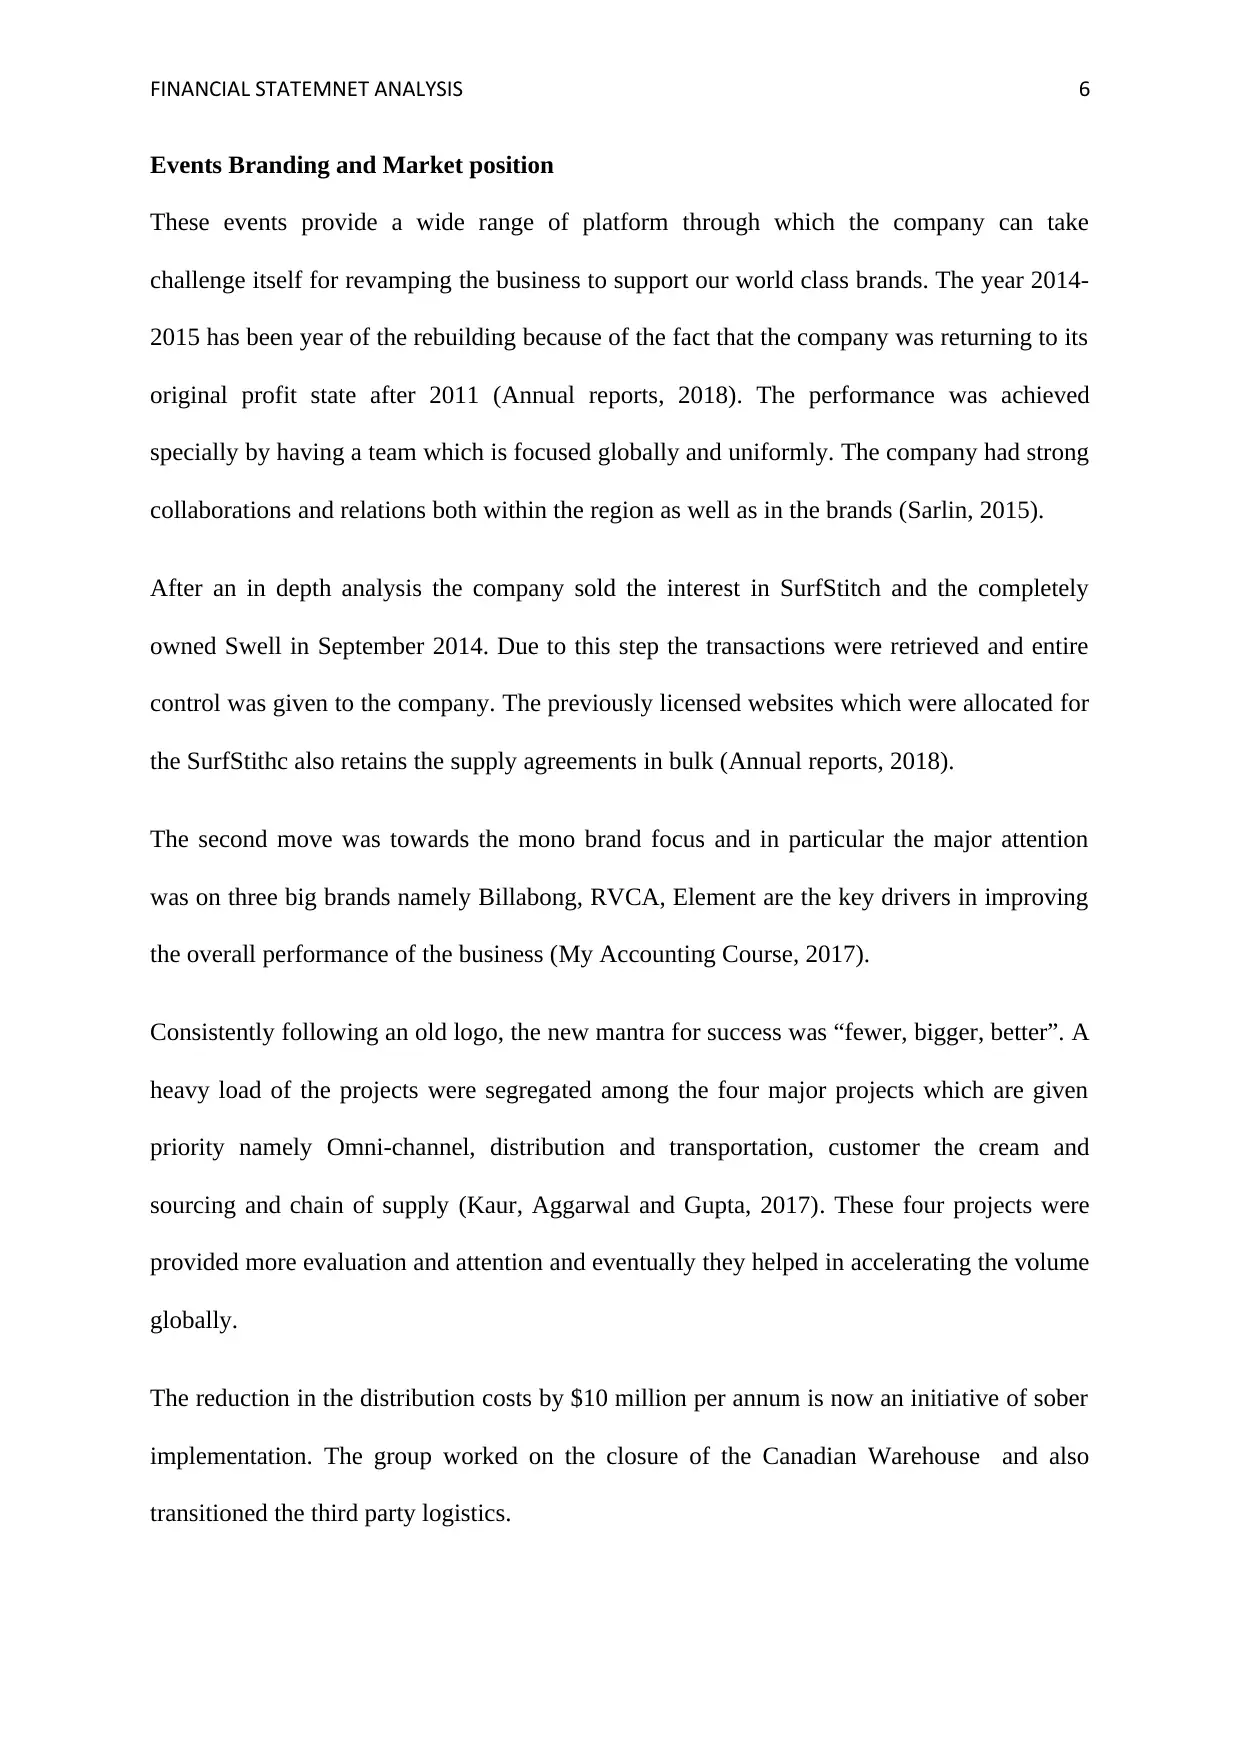
(Source: Edited, 2017).
The above picture depicts the market position of the company among the other similar
companies.
Impact of GFC
The global financial crisis made a square pit for the Billabong International to test itself on
account of performance in the emerging retail operations with a wider wholesale account
base. The Australian dollar stays at US92c and the net profit is down by 6%, excluding the
prior year’s impairment change if there is any fluctuation in the rate as what is recorded. The
overall impact was held on the net profit after tax attributable to the shareholders which
amounted to $152.8 after a drop by more than 13%.
FINANCIAL STATEMNET ANALYSIS 8
Critical Factors of financial viability
Global sourcing of the products and the services
The preferred vendors are included in the new initiatives and the schemes
To convert the losses into at par profits through the highly strategic moves and
transformational methods.
To improve the gross margin is also one of the critical factors for the future
sustainability.
To continue to gain the effective cost in the productivity of the company.
To keep the top line inventory cautiously.
Ratio Analysis
Ratio analysis is the quantitative analysis of the financial statements which is used to evaluate
the various aspects of the company such as efficiency, liquidity, solvency and profitability.
This type of comparison is particularly useful for many users of the financial statements both
within the organisation as well as outside it. The investors, shareholders, suppliers, customers
and employees majorly take decisions on the basis of the ratio analysis (Alin-Eliodor, 2014).
There are majorly four types of ratios liquidity, Asset Management Ratio, Profitability and
Leverage Ratios.
Liquidity ratios
A liquidity ratio is an indicator in which it can be determined that how much of the current
assets are sufficient to pay back the company’s obligations as and when they become due. It
is also known as the acid test ratio (Entwistle, 2015). Under the liquidity ratio there are
majorly three ratios which are current ratio, quick ratio and working capital ratio.
⊘ This is a preview!⊘
Do you want full access?
Subscribe today to unlock all pages.
Trusted by 1+ million students worldwide
FINANCIAL STATEMNET ANALYSIS 9
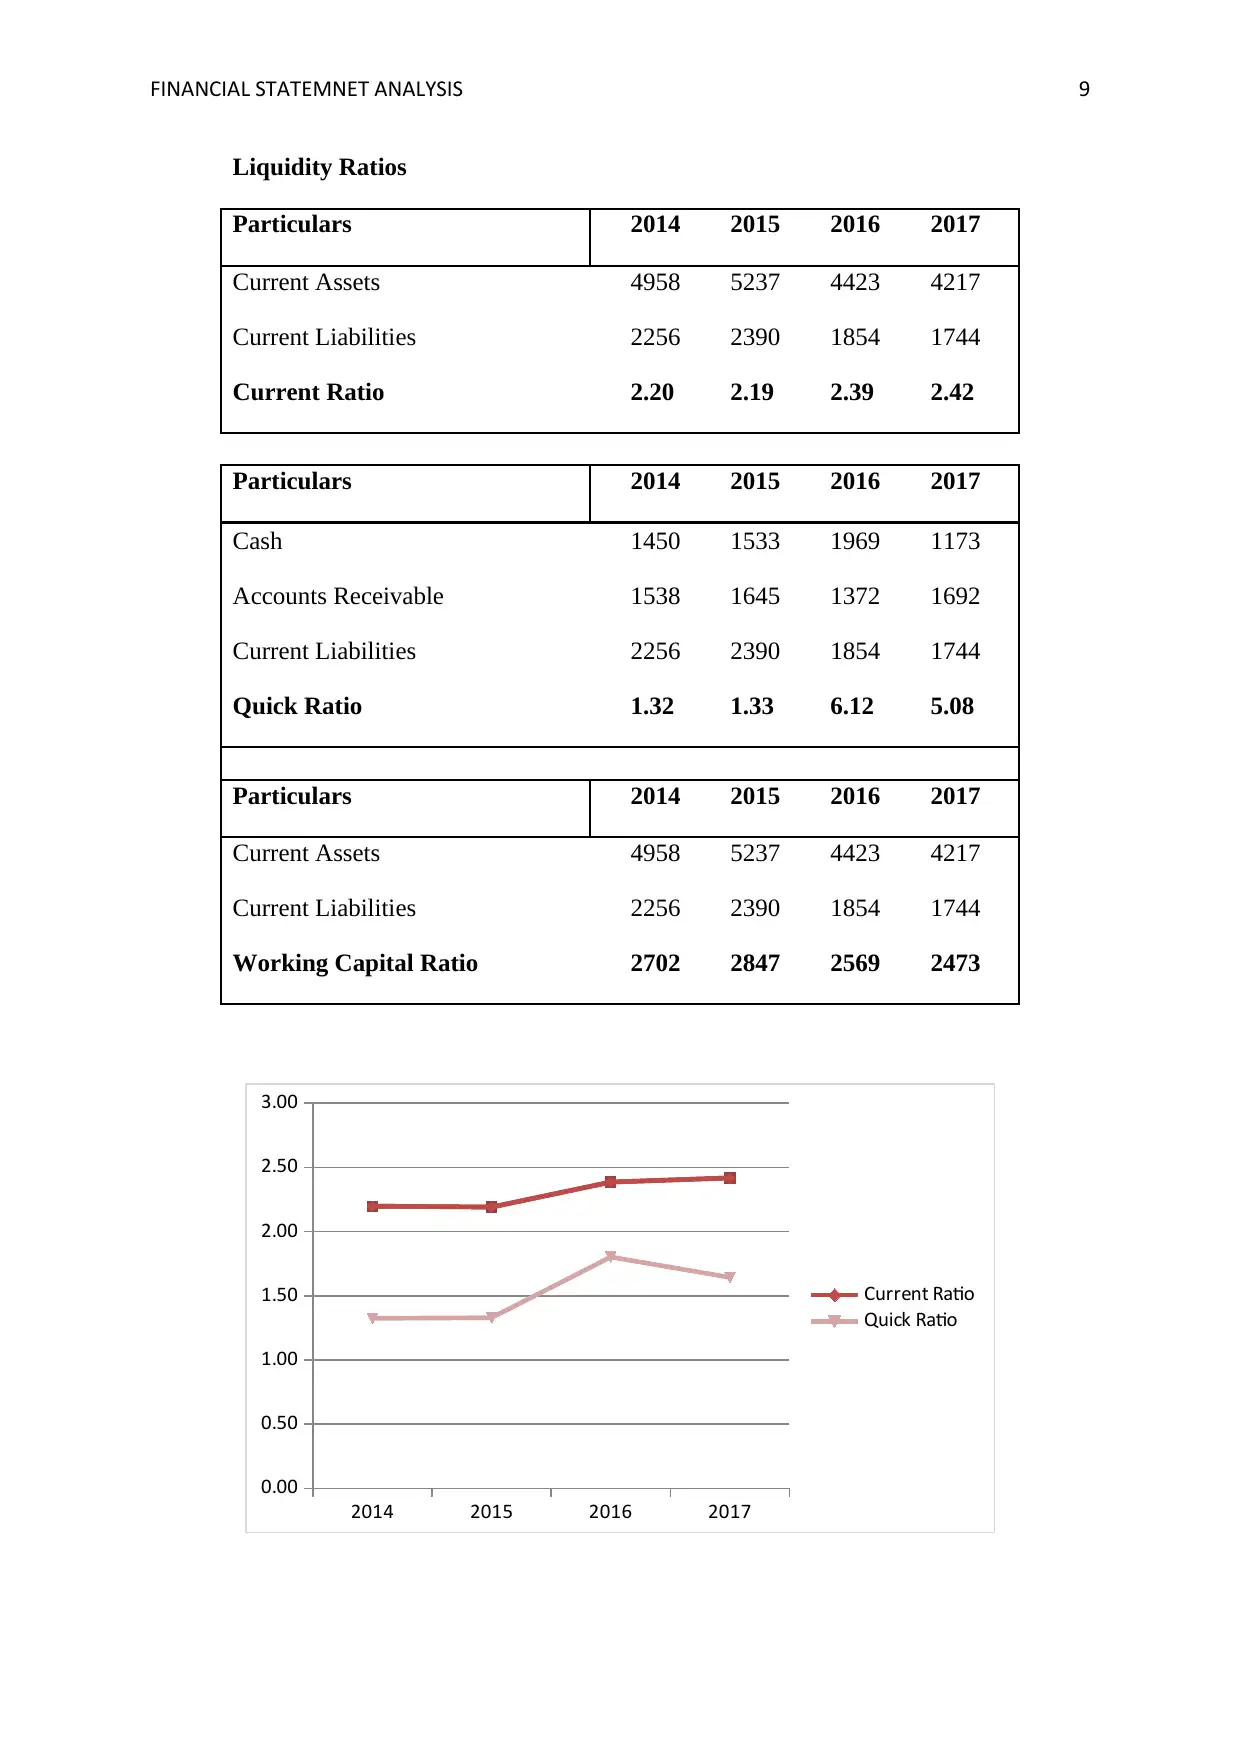
Liquidity Ratios
Particulars 2014 2015 2016 2017
Current Assets 4958 5237 4423 4217
Current Liabilities 2256 2390 1854 1744
Current Ratio 2.20 2.19 2.39 2.42
Particulars 2014 2015 2016 2017
Cash 1450 1533 1969 1173
Accounts Receivable 1538 1645 1372 1692
Current Liabilities 2256 2390 1854 1744
Quick Ratio 1.32 1.33 6.12 5.08
Particulars 2014 2015 2016 2017
Current Assets 4958 5237 4423 4217
Current Liabilities 2256 2390 1854 1744
Working Capital Ratio 2702 2847 2569 2473
2014 2015 2016 2017
0.00
0.50
1.00
1.50
2.00
2.50
3.00
Current Ratio
Quick Ratio
Paraphrase This Document
Need a fresh take? Get an instant paraphrase of this document with our AI Paraphraser
FINANCIAL STATEMNET ANALYSIS 10
(Source: By author)
From the above graph it can be analysed that the current ratio of the Billabong International is
consistently within the rule of the ideal ratio. The ideal ratio is 2:1. However as can be seen
from the above calculations the current ratio is more than 2:1 in all the four years.
The quick ratio of the company is also consistent around 1.5, whereas the ideal ratio is 1:1. A
higher quick ratio shows the company’s ability to liquidate its assets to pay back the
obligations (Flammer, 2015).
And lastly the working capital ratio will determine how much of the current assets are
available against the current liabilities.
Assets management ratio
Asset Management Ratios are available to measure the firm's success in managing its assets
to generate volume of sales (Uechi, et al 2015). For example, these ratios can provide insight
into the success of the firm's credit policy and inventory management. These ratios are also
termed as Activity or Turnover Ratios.
Fixed asset ratio
It is the ratio of sales to the net asset of the company which is very important for knowing
how much the asset of the company are contributing towards the sales of the company. A
positive ratio tells the assets are contributing in the required manner and negative means
declining ratio explains that the assets are not in the favour of sales that is required for the
company. It is the magnitude relation of sales to cyber web plus of the corporate that is
incredibly vital for knowing what proportion the plus of the corporate square measure
FINANCIAL STATEMNET ANALYSIS 11
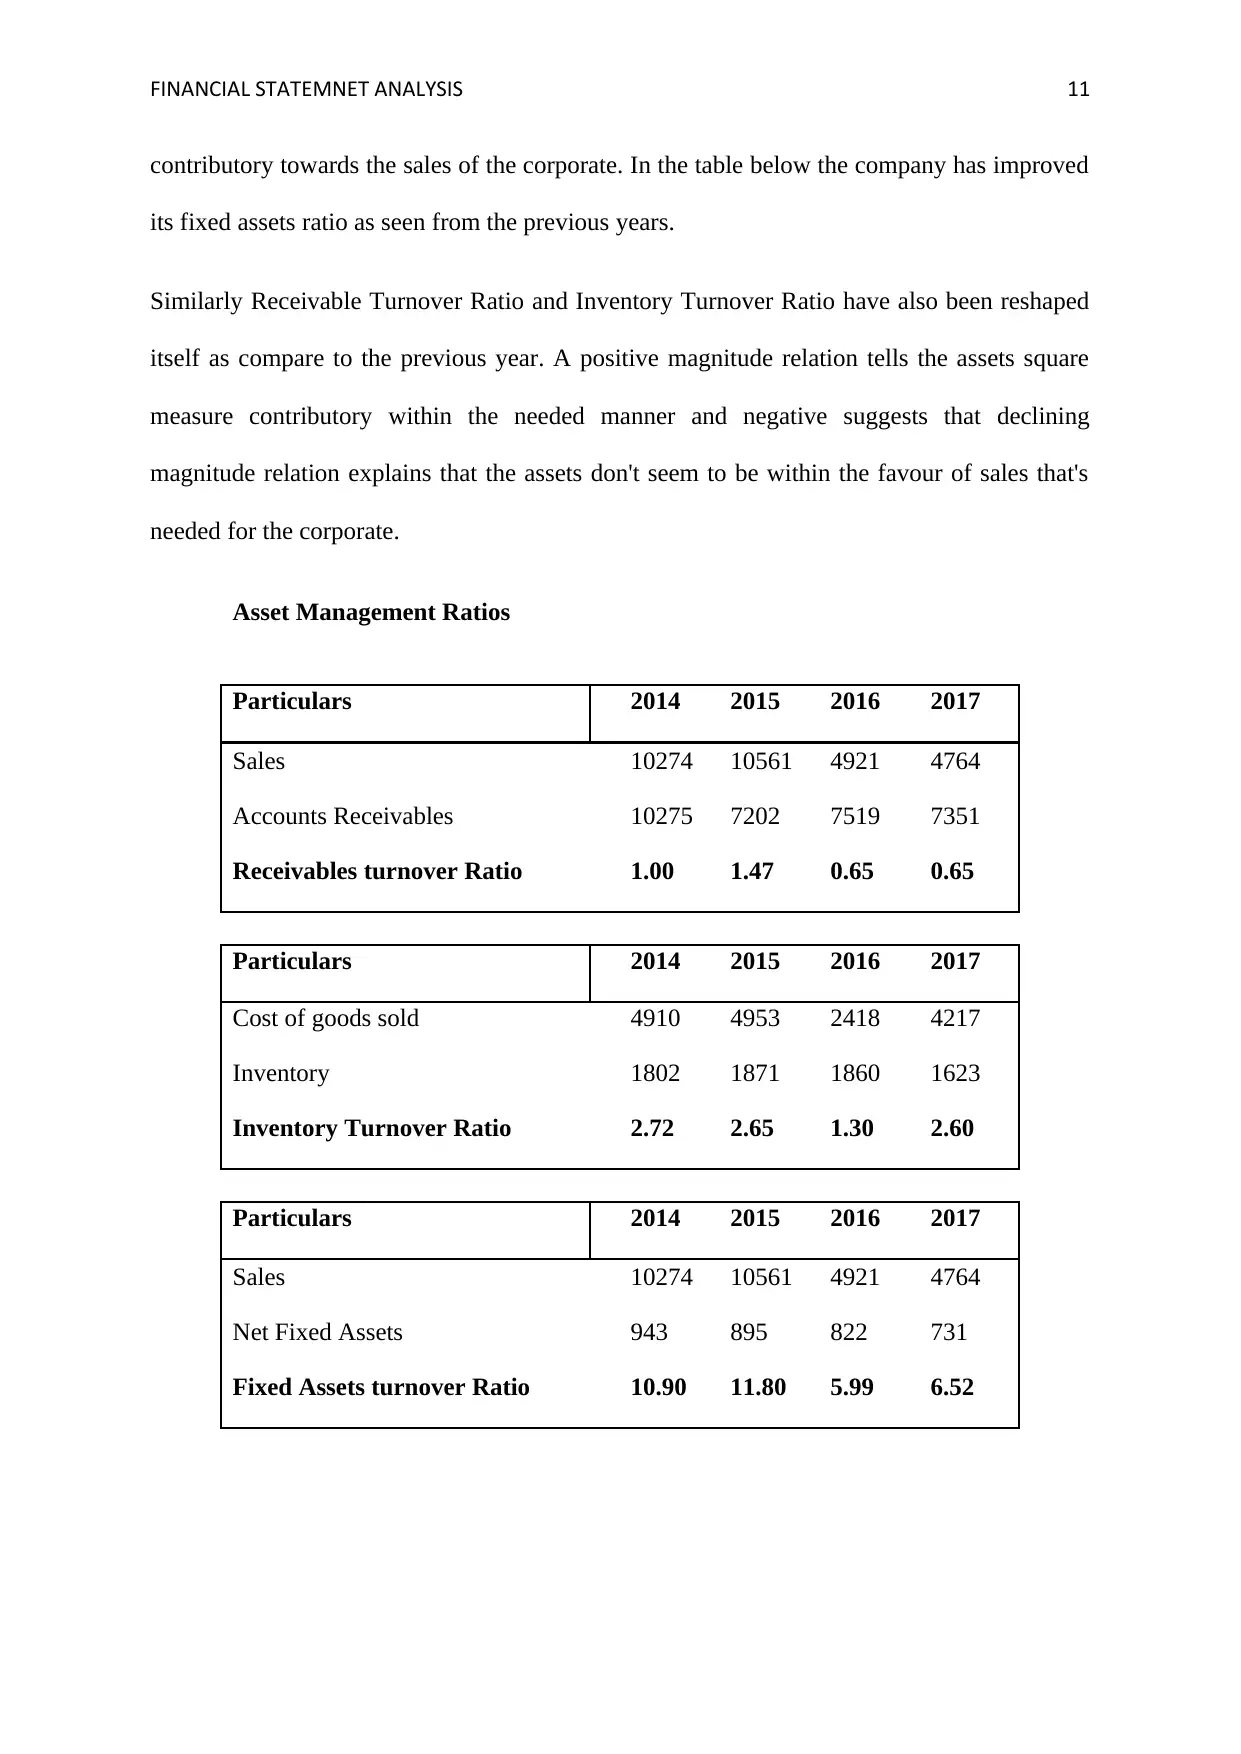
contributory towards the sales of the corporate. In the table below the company has improved
its fixed assets ratio as seen from the previous years.
Similarly Receivable Turnover Ratio and Inventory Turnover Ratio have also been reshaped
itself as compare to the previous year. A positive magnitude relation tells the assets square
measure contributory within the needed manner and negative suggests that declining
magnitude relation explains that the assets don't seem to be within the favour of sales that's
needed for the corporate.
Asset Management Ratios
Particulars 2014 2015 2016 2017
Sales 10274 10561 4921 4764
Accounts Receivables 10275 7202 7519 7351
Receivables turnover Ratio 1.00 1.47 0.65 0.65
Particulars 2014 2015 2016 2017
Cost of goods sold 4910 4953 2418 4217
Inventory 1802 1871 1860 1623
Inventory Turnover Ratio 2.72 2.65 1.30 2.60
Particulars 2014 2015 2016 2017
Sales 10274 10561 4921 4764
Net Fixed Assets 943 895 822 731
Fixed Assets turnover Ratio 10.90 11.80 5.99 6.52
⊘ This is a preview!⊘
Do you want full access?
Subscribe today to unlock all pages.
Trusted by 1+ million students worldwide
1 out of 21
Related Documents


Your All-in-One AI-Powered Toolkit for Academic Success.
+13062052269
info@desklib.com
Available 24*7 on WhatsApp / Email
![[object Object]](/_next/static/media/star-bottom.7253800d.svg)
Unlock your academic potential
Copyright © 2020–2026 A2Z Services. All Rights Reserved. Developed and managed by ZUCOL.