Corporate Accounting Report: Analyzing GSK's Financial Health
VerifiedAdded on 2023/04/08
|18
|3343
|327
Report
AI Summary
This report provides a comprehensive analysis of GlaxoSmithKline (GSK) from a corporate accounting perspective, focusing on a potential merger with AL HAYAT pharmaceuticals. It includes a SWOT analysis to identify GSK's strengths, weaknesses, opportunities, and threats, evaluating its research and development, sales network, financial position, and market presence. The report also examines GSK's business model, highlighting its resources, operating model, and outputs. A detailed financial performance review is conducted using ratio analysis, including current ratio, quick ratio, debt ratio, and return on equity, alongside an assessment of working capital. Furthermore, the report calculates the weighted average cost of capital (WACC) and terminal value, and presents a cash flow statement. The analysis concludes with recommendations for GSK based on the findings, aiming to improve its market position and financial health. Desklib provides access to this and many other solved assignments for students.
Corporate Accounting
1
1
Paraphrase This Document
Need a fresh take? Get an instant paraphrase of this document with our AI Paraphraser
Contents
Introduction......................................................................................................................................3
SWOT analysis of the GSK.........................................................................................................3
Business Model............................................................................................................................6
Financial performance.....................................................................................................................8
Ratio Analysis..............................................................................................................................8
Weighted Average Cost of Capital............................................................................................11
Terminal value...........................................................................................................................13
Cash Flow Statement.................................................................................................................14
Recommendations..........................................................................................................................15
Conclusion.....................................................................................................................................16
References......................................................................................................................................17
2
Introduction
Corporate accounting is one of the main branches which cover all the business accounting
transactions related to the merger and acquisition. Merger is basically done to increase the
business operation and enhance profitability aspects of both companies. In this report, merger of
GSK pharmaceutical is done by AL HAYAT pharmaceuticals. This would become one of the
biggest mergers in the UAE in pharmaceutical industry. This merger gives a competitive
advantage to the company to cover a market. Hereunder, SWOT analysis is used in order to
know the strength and weaknesses of the GSK. In this report the GSK financial position will
evaluate by using the annual report. By using acquisition technique, it could expand its
operations in the market.
SWOT analysis of the GSK
SWOT analysis is one of the tool which is used by the organization for knowing the internal and
external scanning. Here, GSK pharmaceuticals produce drugs which are related to the consumer
health goods it operates more than 100 countries and has sound operations in US, Europe and
Asia-Pacific (Blockeel, et. al., 2016).
Strengths:-
Sound Research and development portfolio expansion: It concentrates for vast
research and development wing. Cited company has made strong presence in respiratory,
HIV and heart disease related medicines. Its management is driving to strengthen its
market position.
Sound sales and distribution network: GSK has framed a sound sales and distribution
network in all over the world. A sound distribution network makes sure that availability
of its products all over the place and increases its ability to offer its newer and unique
products to the consumer.
Strong worldwide presence: GSK quality products and services are accessible in over
100 countries across the world which minimizes overdependence risks on limited
markets.
3
⊘ This is a preview!⊘
Do you want full access?
Subscribe today to unlock all pages.
Trusted by 1+ million students worldwide
Financial Position or status: GSK has a sound financial position with successive profits
in every year, along with accumulated revenue reserves that can be utilized to finance
capital expenditures in the future.
Social Media: GSK has a strong and sound image on social media with more than
millions followers on Facebook and Instagram. It also has high levels of customer visit
on these media with less customer response time.
Weaknesses:-
Healthcare fraud allegations affect Company’s goodwill: GSK Company has been
charged in some countries due to unlawful promotion of drugs, failure to report safety
data and false pricing charges.
Research & Development: GSK Company investment in R&D is less than the fastest
growing competitors in the industry. Although GlaxoSmithKline is spending above the
industry average on R&D but it is not enough to beat the competition in the market.
High attrition rate in work force: By doing comparison with other organization in the
same industry, the GSK has a maximum attrition rate as compared to the other
competitors. The company spends a lot in training and development program for
improvement of its workforce.
Market Research: The Company in recent years does not conduct market research and
uses old data for making decisions. Over year to year the customer needs and wants
change and the company manufacturer’s products according to the previous demand and
not consider the recent trend.
Negative trend in cash flow: Due to lack of financial planning the company cash flow
statement shows negative balance which indicate that the company does not have a
sufficient cash and they borrow from outside in form of loans.
4
Paraphrase This Document
Need a fresh take? Get an instant paraphrase of this document with our AI Paraphraser
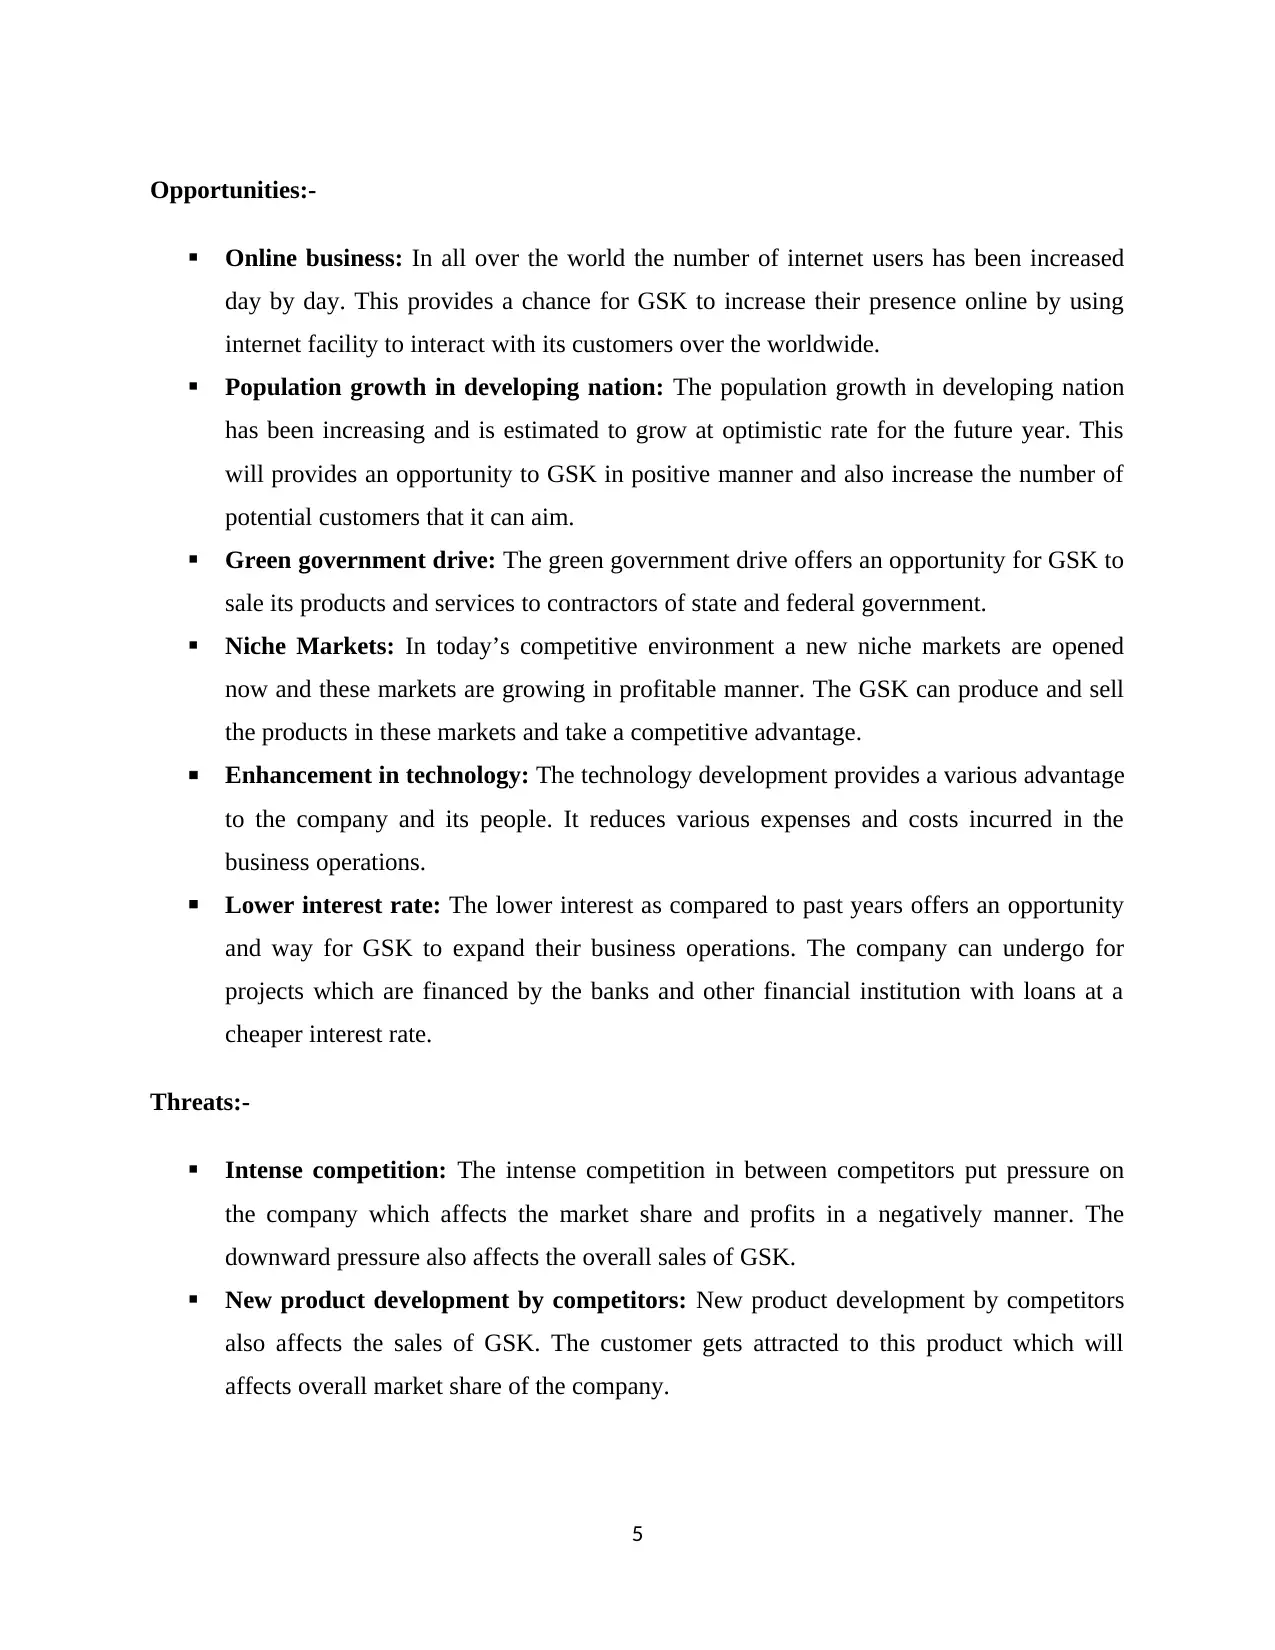
Opportunities:-
Online business: In all over the world the number of internet users has been increased
day by day. This provides a chance for GSK to increase their presence online by using
internet facility to interact with its customers over the worldwide.
Population growth in developing nation: The population growth in developing nation
has been increasing and is estimated to grow at optimistic rate for the future year. This
will provides an opportunity to GSK in positive manner and also increase the number of
potential customers that it can aim.
Green government drive: The green government drive offers an opportunity for GSK to
sale its products and services to contractors of state and federal government.
Niche Markets: In today’s competitive environment a new niche markets are opened
now and these markets are growing in profitable manner. The GSK can produce and sell
the products in these markets and take a competitive advantage.
Enhancement in technology: The technology development provides a various advantage
to the company and its people. It reduces various expenses and costs incurred in the
business operations.
Lower interest rate: The lower interest as compared to past years offers an opportunity
and way for GSK to expand their business operations. The company can undergo for
projects which are financed by the banks and other financial institution with loans at a
cheaper interest rate.
Threats:-
Intense competition: The intense competition in between competitors put pressure on
the company which affects the market share and profits in a negatively manner. The
downward pressure also affects the overall sales of GSK.
New product development by competitors: New product development by competitors
also affects the sales of GSK. The customer gets attracted to this product which will
affects overall market share of the company.
5
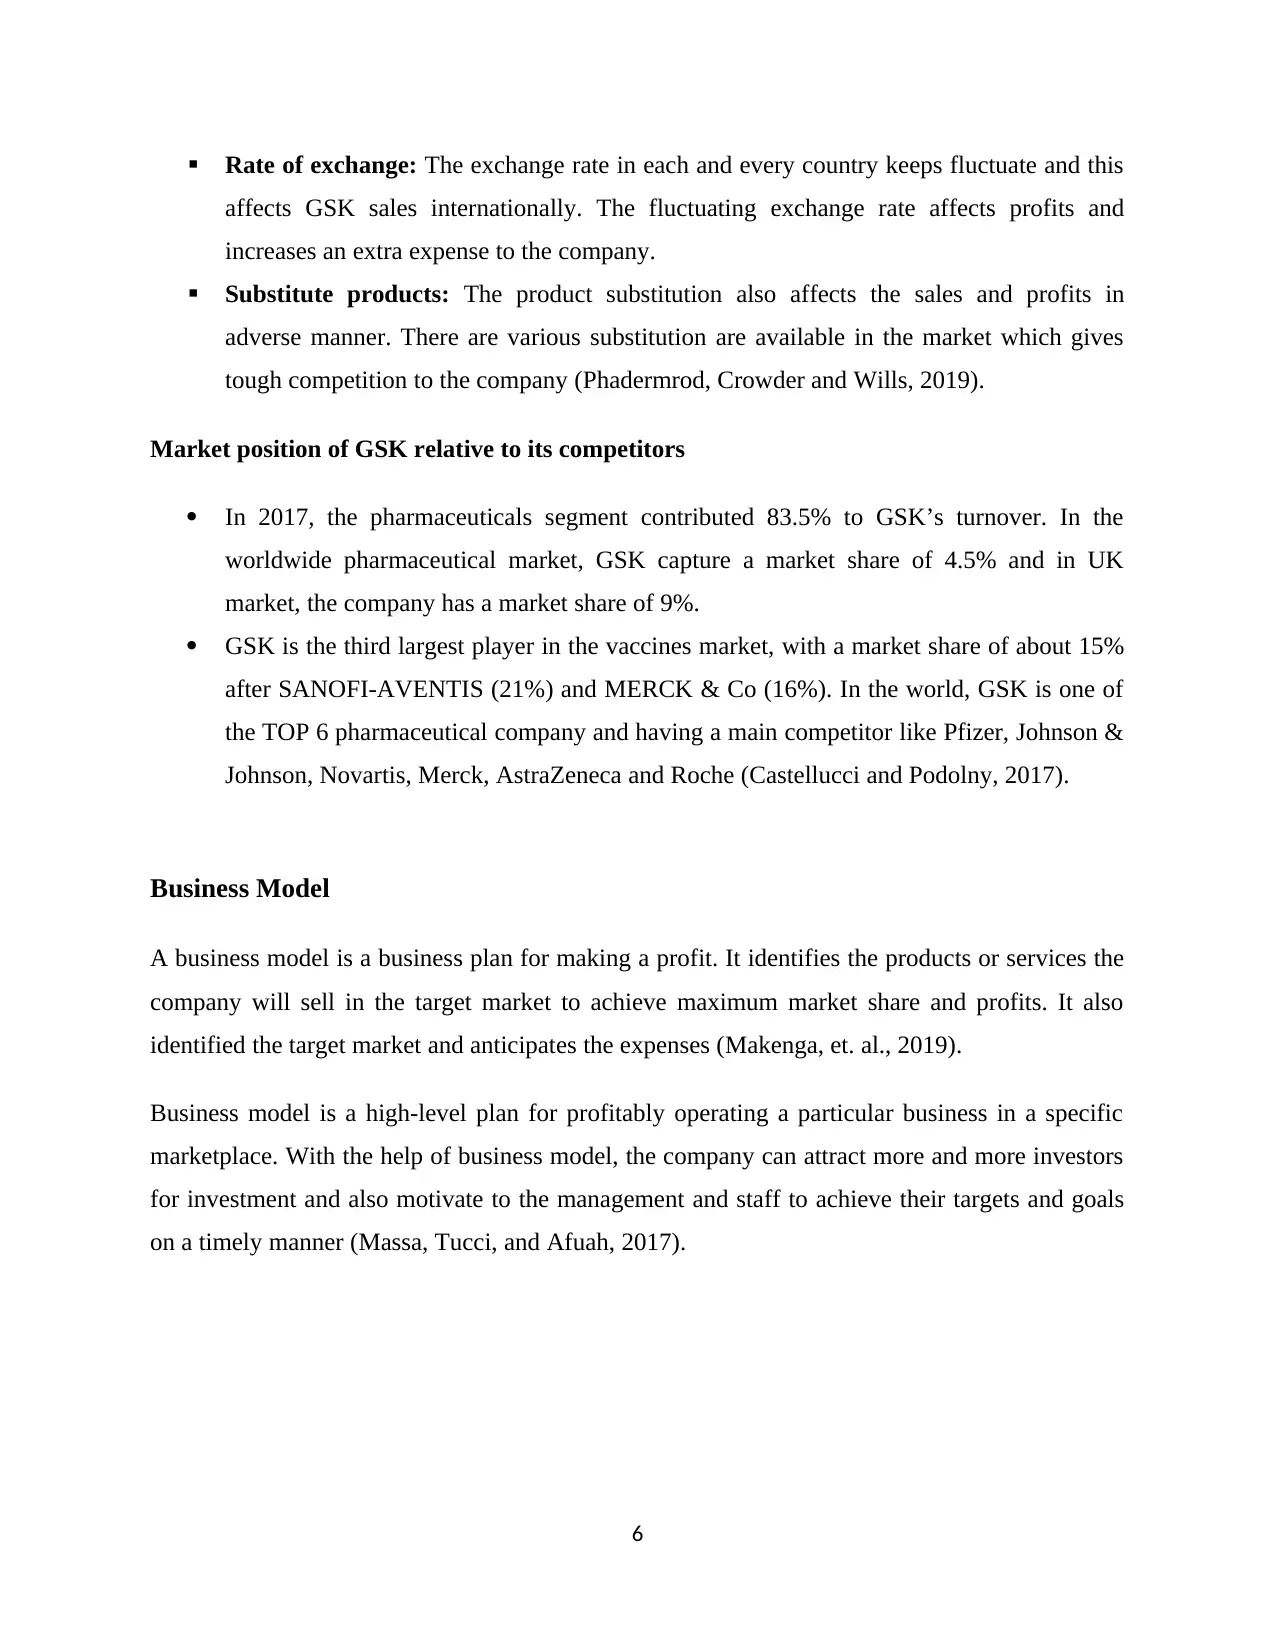
Rate of exchange: The exchange rate in each and every country keeps fluctuate and this
affects GSK sales internationally. The fluctuating exchange rate affects profits and
increases an extra expense to the company.
Substitute products: The product substitution also affects the sales and profits in
adverse manner. There are various substitution are available in the market which gives
tough competition to the company (Phadermrod, Crowder and Wills, 2019).
Market position of GSK relative to its competitors
In 2017, the pharmaceuticals segment contributed 83.5% to GSK’s turnover. In the
worldwide pharmaceutical market, GSK capture a market share of 4.5% and in UK
market, the company has a market share of 9%.
GSK is the third largest player in the vaccines market, with a market share of about 15%
after SANOFI-AVENTIS (21%) and MERCK & Co (16%). In the world, GSK is one of
the TOP 6 pharmaceutical company and having a main competitor like Pfizer, Johnson &
Johnson, Novartis, Merck, AstraZeneca and Roche (Castellucci and Podolny, 2017).
Business Model
A business model is a business plan for making a profit. It identifies the products or services the
company will sell in the target market to achieve maximum market share and profits. It also
identified the target market and anticipates the expenses (Makenga, et. al., 2019).
Business model is a high-level plan for profitably operating a particular business in a specific
marketplace. With the help of business model, the company can attract more and more investors
for investment and also motivate to the management and staff to achieve their targets and goals
on a timely manner (Massa, Tucci, and Afuah, 2017).
6
⊘ This is a preview!⊘
Do you want full access?
Subscribe today to unlock all pages.
Trusted by 1+ million students worldwide
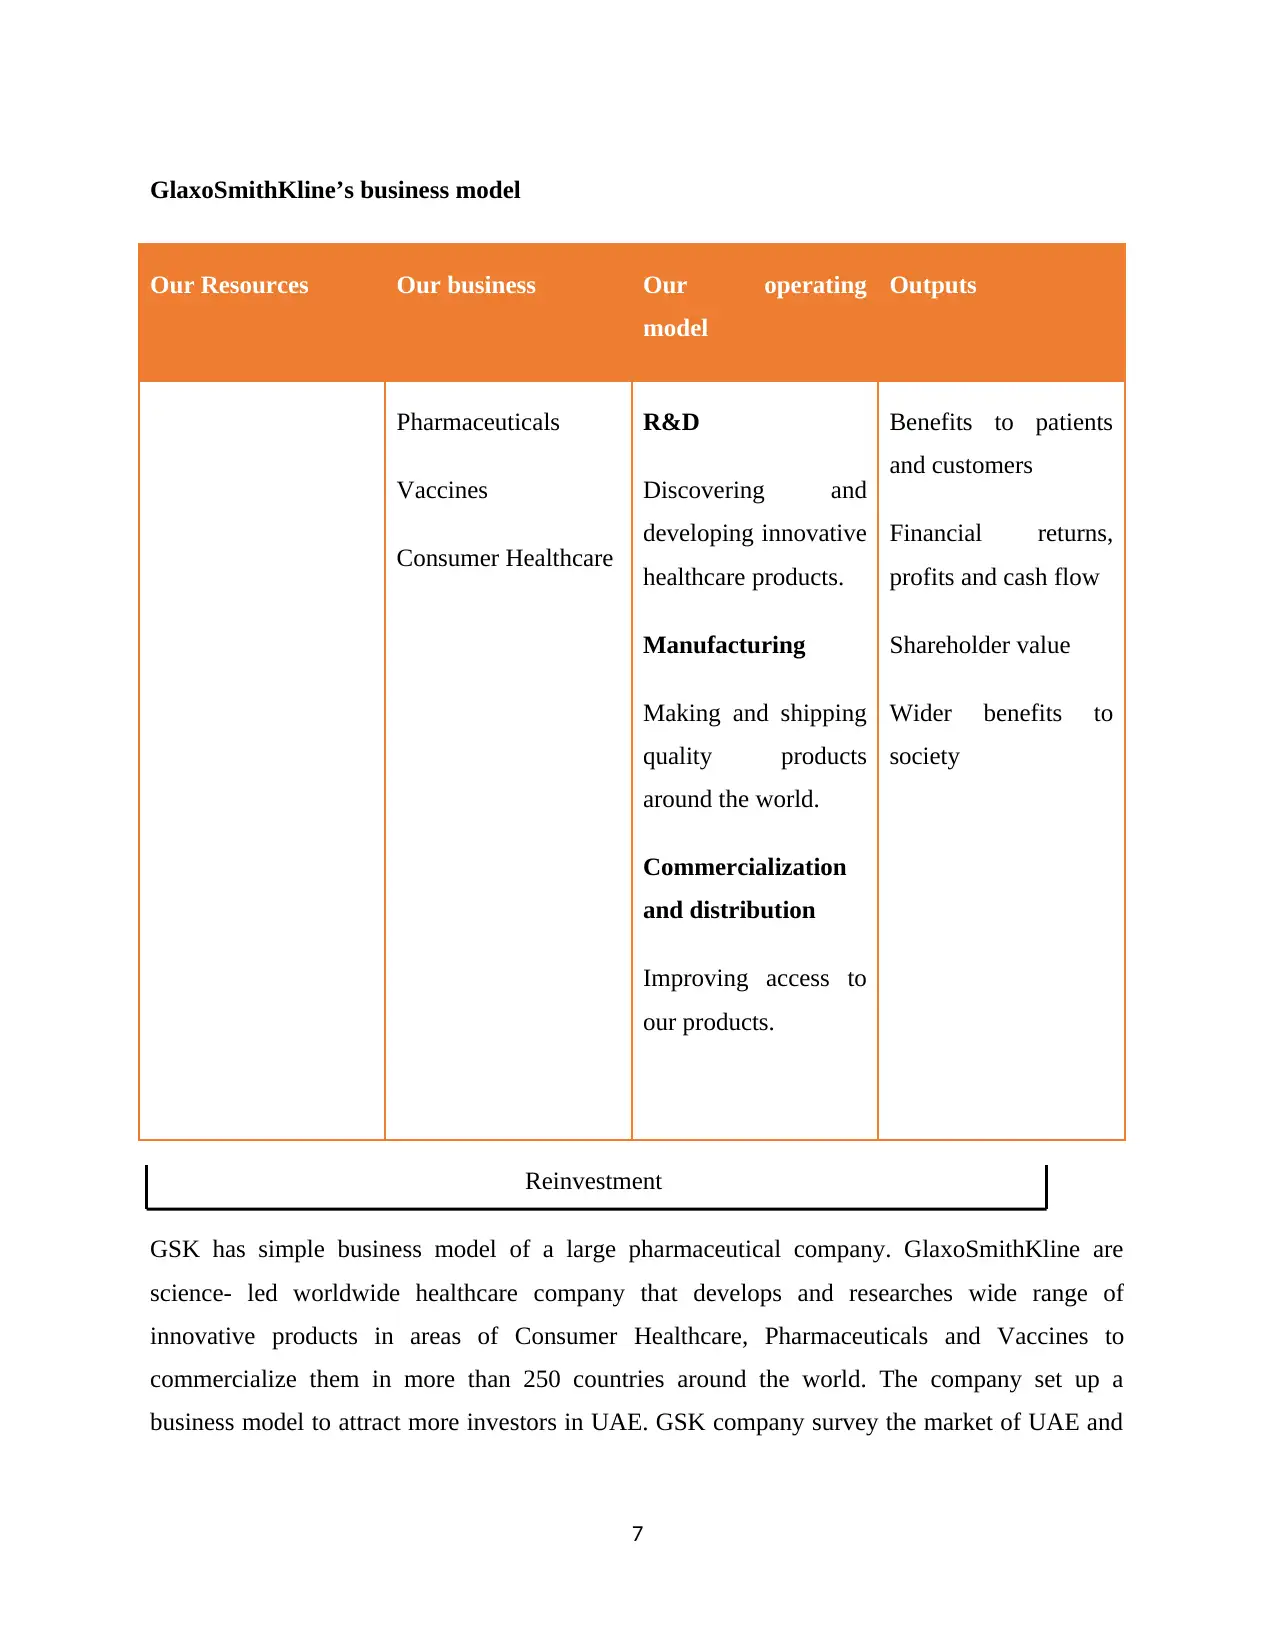
GlaxoSmithKline’s business model
Our Resources Our business Our operating
model
Outputs
Pharmaceuticals
Vaccines
Consumer Healthcare
R&D
Discovering and
developing innovative
healthcare products.
Manufacturing
Making and shipping
quality products
around the world.
Commercialization
and distribution
Improving access to
our products.
Benefits to patients
and customers
Financial returns,
profits and cash flow
Shareholder value
Wider benefits to
society
Reinvestment
GSK has simple business model of a large pharmaceutical company. GlaxoSmithKline are
science- led worldwide healthcare company that develops and researches wide range of
innovative products in areas of Consumer Healthcare, Pharmaceuticals and Vaccines to
commercialize them in more than 250 countries around the world. The company set up a
business model to attract more investors in UAE. GSK company survey the market of UAE and
7
Paraphrase This Document
Need a fresh take? Get an instant paraphrase of this document with our AI Paraphraser
also survey the requirement of people what they needs and wants. GSK follow a simple and
effective business model in UAE to attain maximum market share.
Financial performance
With the help of financial performance, the investors measures profitability margins, accounting
ratios, etc. The organization Balance sheet, Income statement and cash flow statement shows
financial position in the financial year (Williams and Dobelman, 2017).
Ratio Analysis
The ratio analysis is used to assess the various aspects of an organization financial and operating
performance such as its liquidity, solvency, efficiency and profitability. The ratios are also used
for comparison with other companies in a same industry. Ratio analysis is a cornerstone of
fundamental analysis (Forde, et. al., 2016).
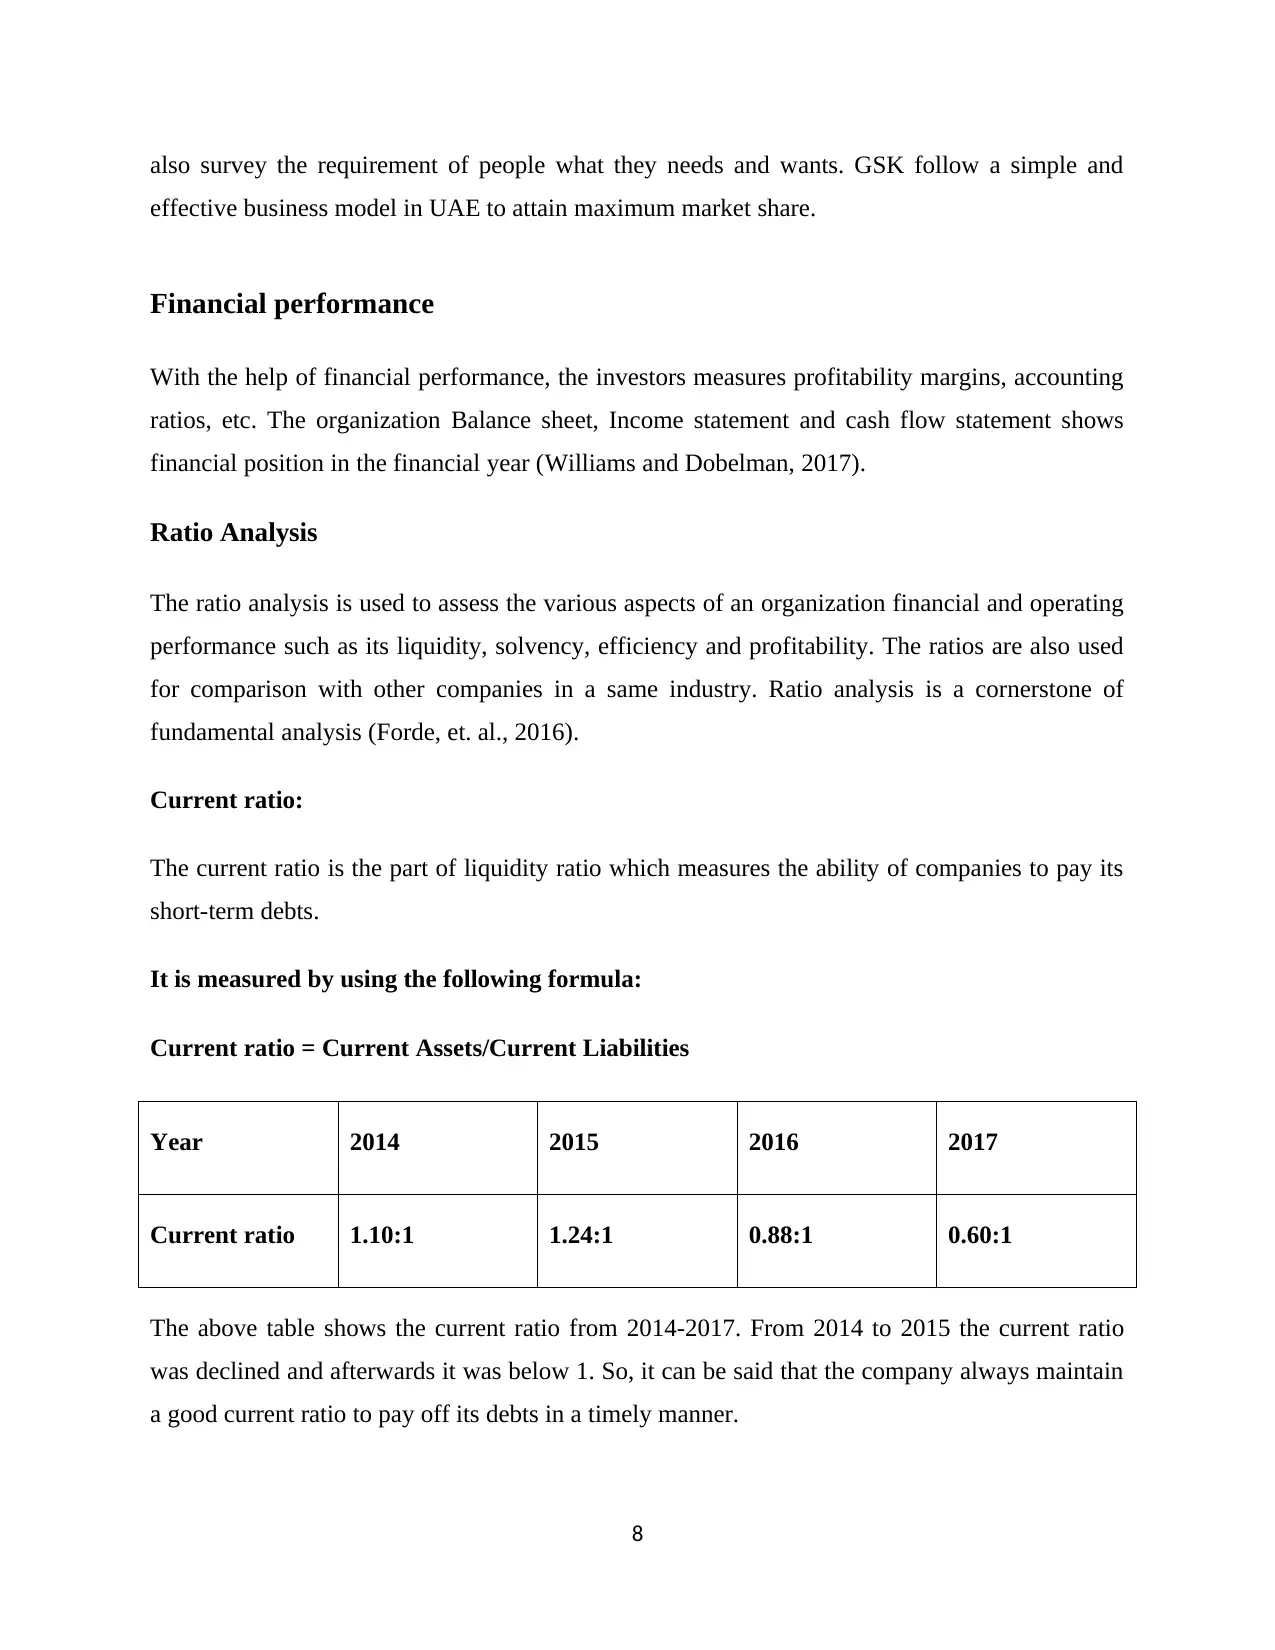
Current ratio:
The current ratio is the part of liquidity ratio which measures the ability of companies to pay its
short-term debts.
It is measured by using the following formula:
Current ratio = Current Assets/Current Liabilities
Year 2014 2015 2016 2017
Current ratio 1.10:1 1.24:1 0.88:1 0.60:1
The above table shows the current ratio from 2014-2017. From 2014 to 2015 the current ratio
was declined and afterwards it was below 1. So, it can be said that the company always maintain
a good current ratio to pay off its debts in a timely manner.
8
effective business model in UAE to attain maximum market share.
Financial performance
With the help of financial performance, the investors measures profitability margins, accounting
ratios, etc. The organization Balance sheet, Income statement and cash flow statement shows
financial position in the financial year (Williams and Dobelman, 2017).
Ratio Analysis
The ratio analysis is used to assess the various aspects of an organization financial and operating
performance such as its liquidity, solvency, efficiency and profitability. The ratios are also used
for comparison with other companies in a same industry. Ratio analysis is a cornerstone of
fundamental analysis (Forde, et. al., 2016).
Current ratio:
The current ratio is the part of liquidity ratio which measures the ability of companies to pay its
short-term debts.
It is measured by using the following formula:
Current ratio = Current Assets/Current Liabilities
Year 2014 2015 2016 2017
Current ratio 1.10:1 1.24:1 0.88:1 0.60:1
The above table shows the current ratio from 2014-2017. From 2014 to 2015 the current ratio
was declined and afterwards it was below 1. So, it can be said that the company always maintain
a good current ratio to pay off its debts in a timely manner.
8
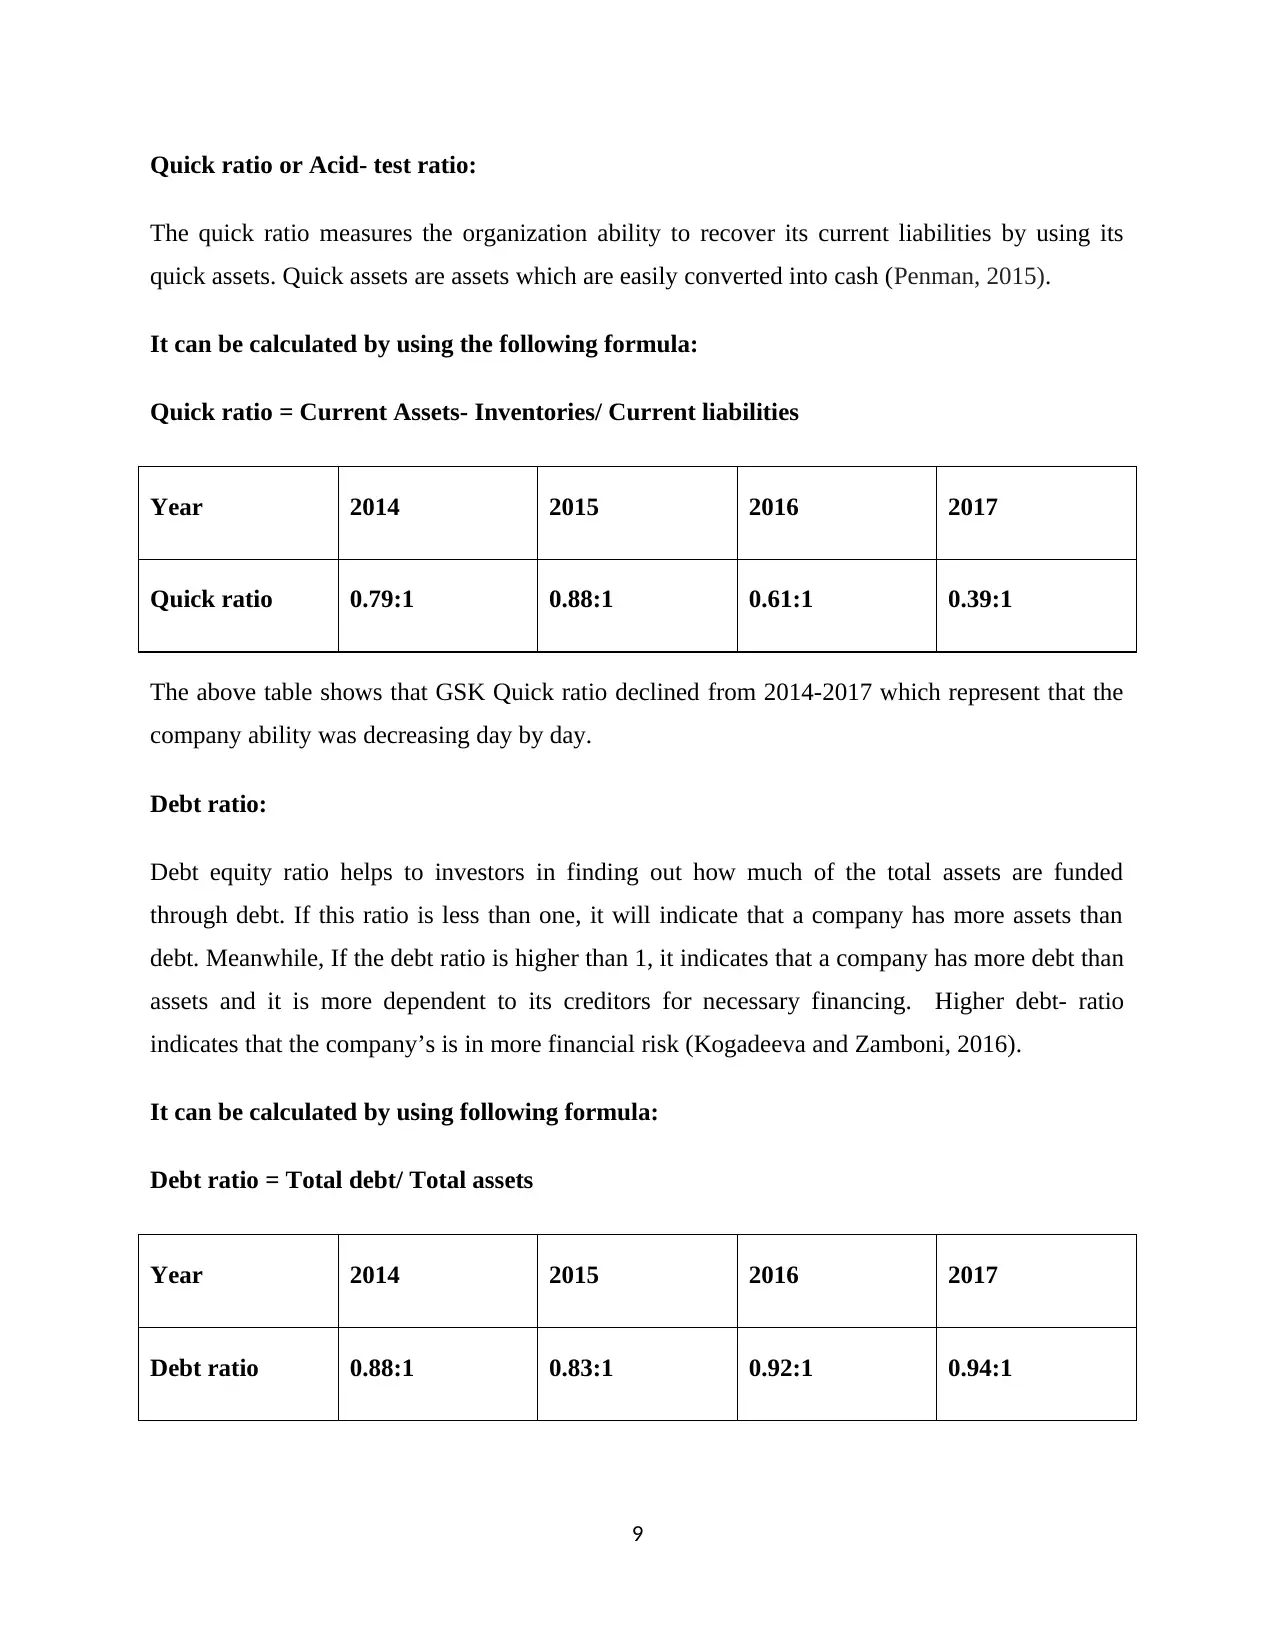
Quick ratio or Acid- test ratio:
The quick ratio measures the organization ability to recover its current liabilities by using its
quick assets. Quick assets are assets which are easily converted into cash (Penman, 2015).
It can be calculated by using the following formula:
Quick ratio = Current Assets- Inventories/ Current liabilities
Year 2014 2015 2016 2017
Quick ratio 0.79:1 0.88:1 0.61:1 0.39:1
The above table shows that GSK Quick ratio declined from 2014-2017 which represent that the
company ability was decreasing day by day.
Debt ratio:
Debt equity ratio helps to investors in finding out how much of the total assets are funded
through debt. If this ratio is less than one, it will indicate that a company has more assets than
debt. Meanwhile, If the debt ratio is higher than 1, it indicates that a company has more debt than
assets and it is more dependent to its creditors for necessary financing. Higher debt- ratio
indicates that the company’s is in more financial risk (Kogadeeva and Zamboni, 2016).
It can be calculated by using following formula:
Debt ratio = Total debt/ Total assets
Year 2014 2015 2016 2017
Debt ratio 0.88:1 0.83:1 0.92:1 0.94:1
9
⊘ This is a preview!⊘
Do you want full access?
Subscribe today to unlock all pages.
Trusted by 1+ million students worldwide
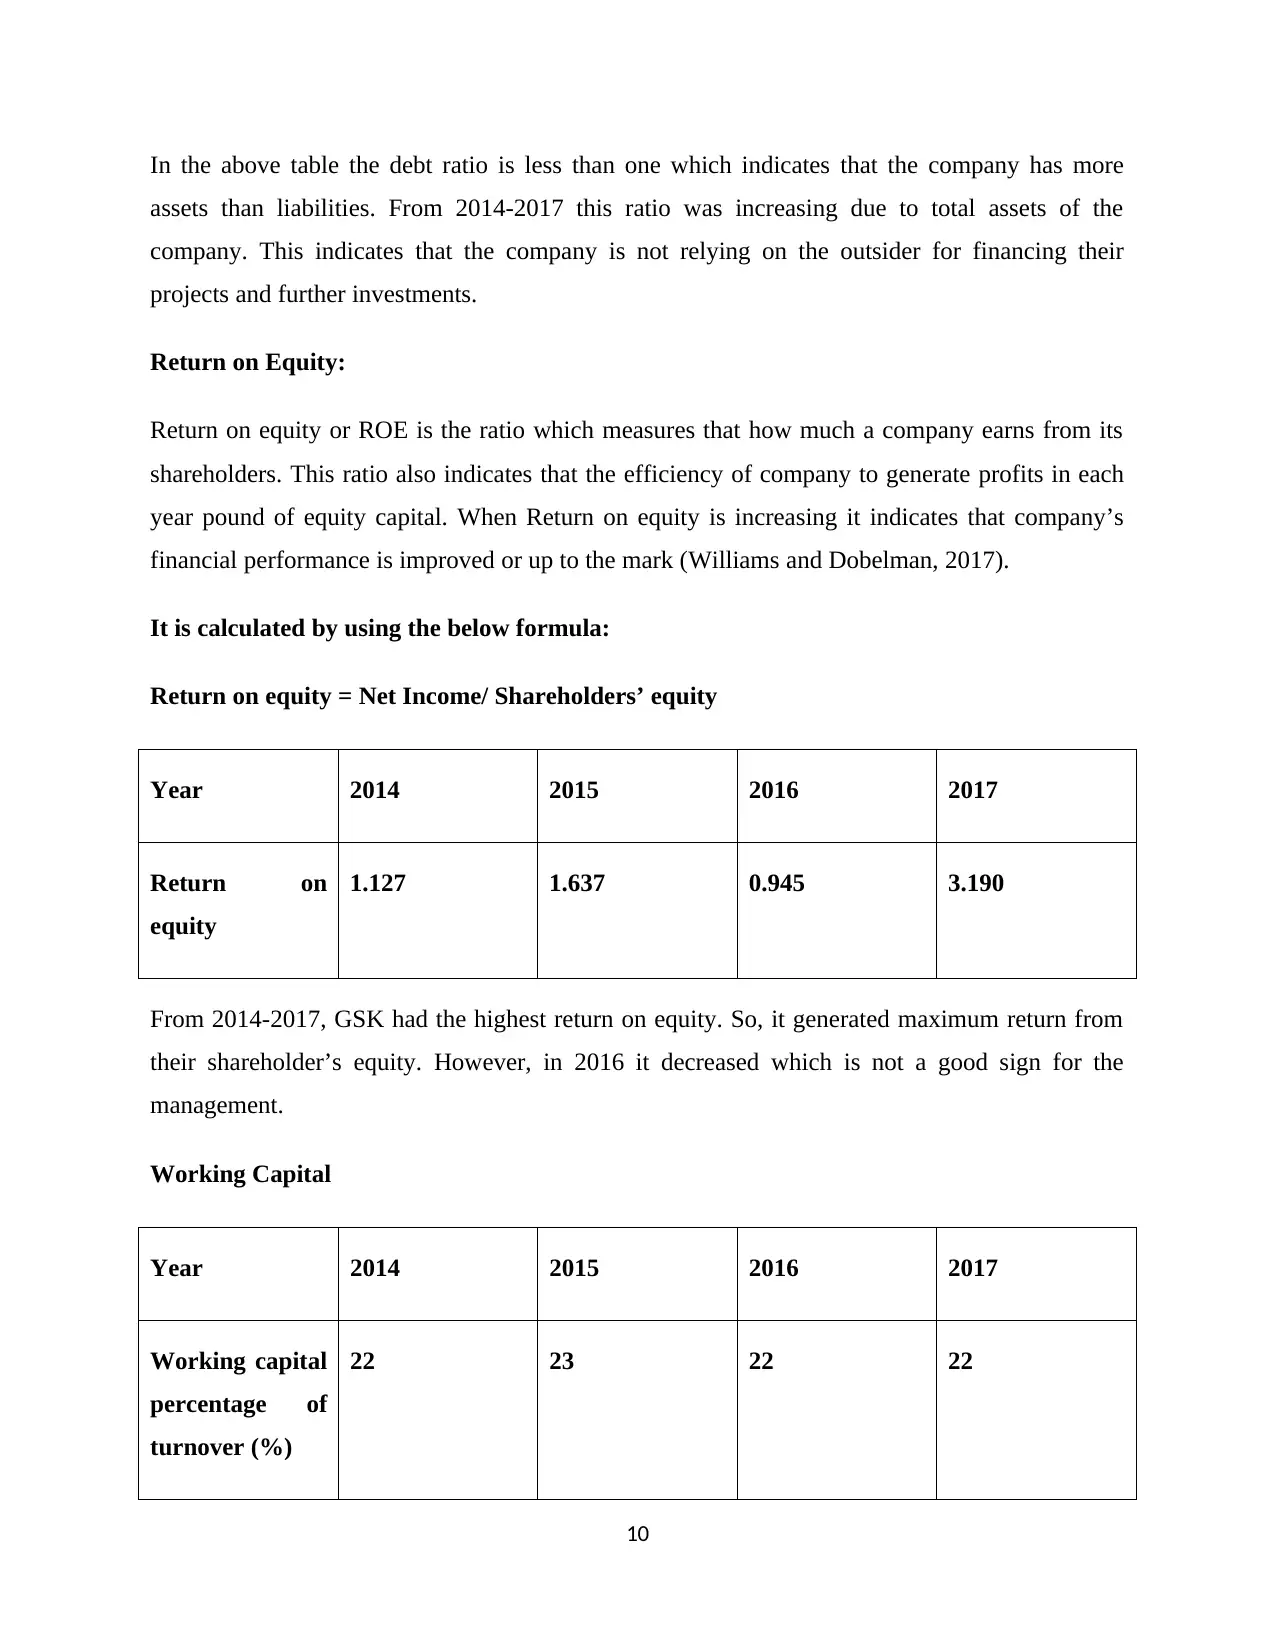
In the above table the debt ratio is less than one which indicates that the company has more
assets than liabilities. From 2014-2017 this ratio was increasing due to total assets of the
company. This indicates that the company is not relying on the outsider for financing their
projects and further investments.
Return on Equity:
Return on equity or ROE is the ratio which measures that how much a company earns from its
shareholders. This ratio also indicates that the efficiency of company to generate profits in each
year pound of equity capital. When Return on equity is increasing it indicates that company’s
financial performance is improved or up to the mark (Williams and Dobelman, 2017).
It is calculated by using the below formula:
Return on equity = Net Income/ Shareholders’ equity
Year 2014 2015 2016 2017
Return on
equity
1.127 1.637 0.945 3.190
From 2014-2017, GSK had the highest return on equity. So, it generated maximum return from
their shareholder’s equity. However, in 2016 it decreased which is not a good sign for the
management.
Working Capital
Year 2014 2015 2016 2017
Working capital
percentage of
turnover (%)
22 23 22 22
10
Paraphrase This Document
Need a fresh take? Get an instant paraphrase of this document with our AI Paraphraser
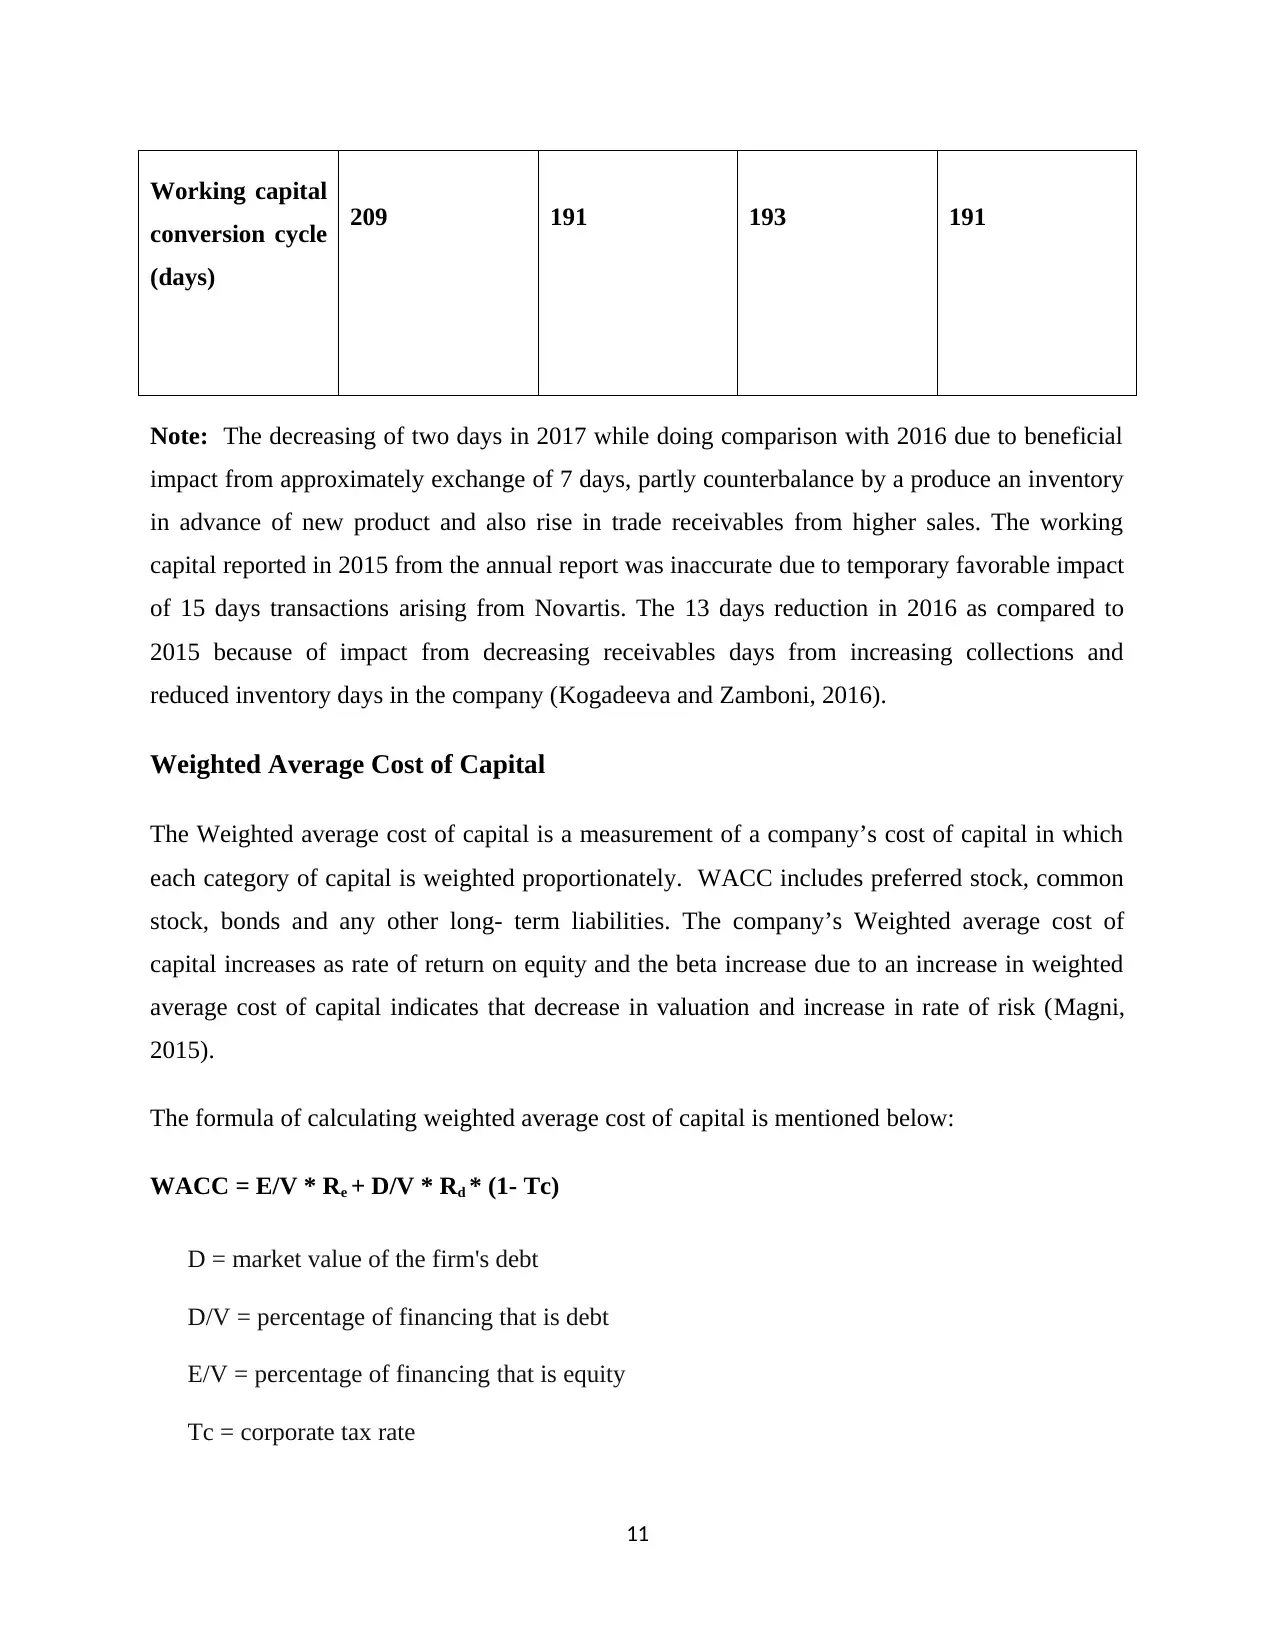
Working capital
conversion cycle
(days)
209 191 193 191
Note: The decreasing of two days in 2017 while doing comparison with 2016 due to beneficial
impact from approximately exchange of 7 days, partly counterbalance by a produce an inventory
in advance of new product and also rise in trade receivables from higher sales. The working
capital reported in 2015 from the annual report was inaccurate due to temporary favorable impact
of 15 days transactions arising from Novartis. The 13 days reduction in 2016 as compared to
2015 because of impact from decreasing receivables days from increasing collections and
reduced inventory days in the company (Kogadeeva and Zamboni, 2016).
Weighted Average Cost of Capital
The Weighted average cost of capital is a measurement of a company’s cost of capital in which
each category of capital is weighted proportionately. WACC includes preferred stock, common
stock, bonds and any other long- term liabilities. The company’s Weighted average cost of
capital increases as rate of return on equity and the beta increase due to an increase in weighted
average cost of capital indicates that decrease in valuation and increase in rate of risk (Magni,
2015).
The formula of calculating weighted average cost of capital is mentioned below:
WACC = E/V * Re + D/V * Rd * (1- Tc)
D = market value of the firm's debt
D/V = percentage of financing that is debt
E/V = percentage of financing that is equity
Tc = corporate tax rate
11
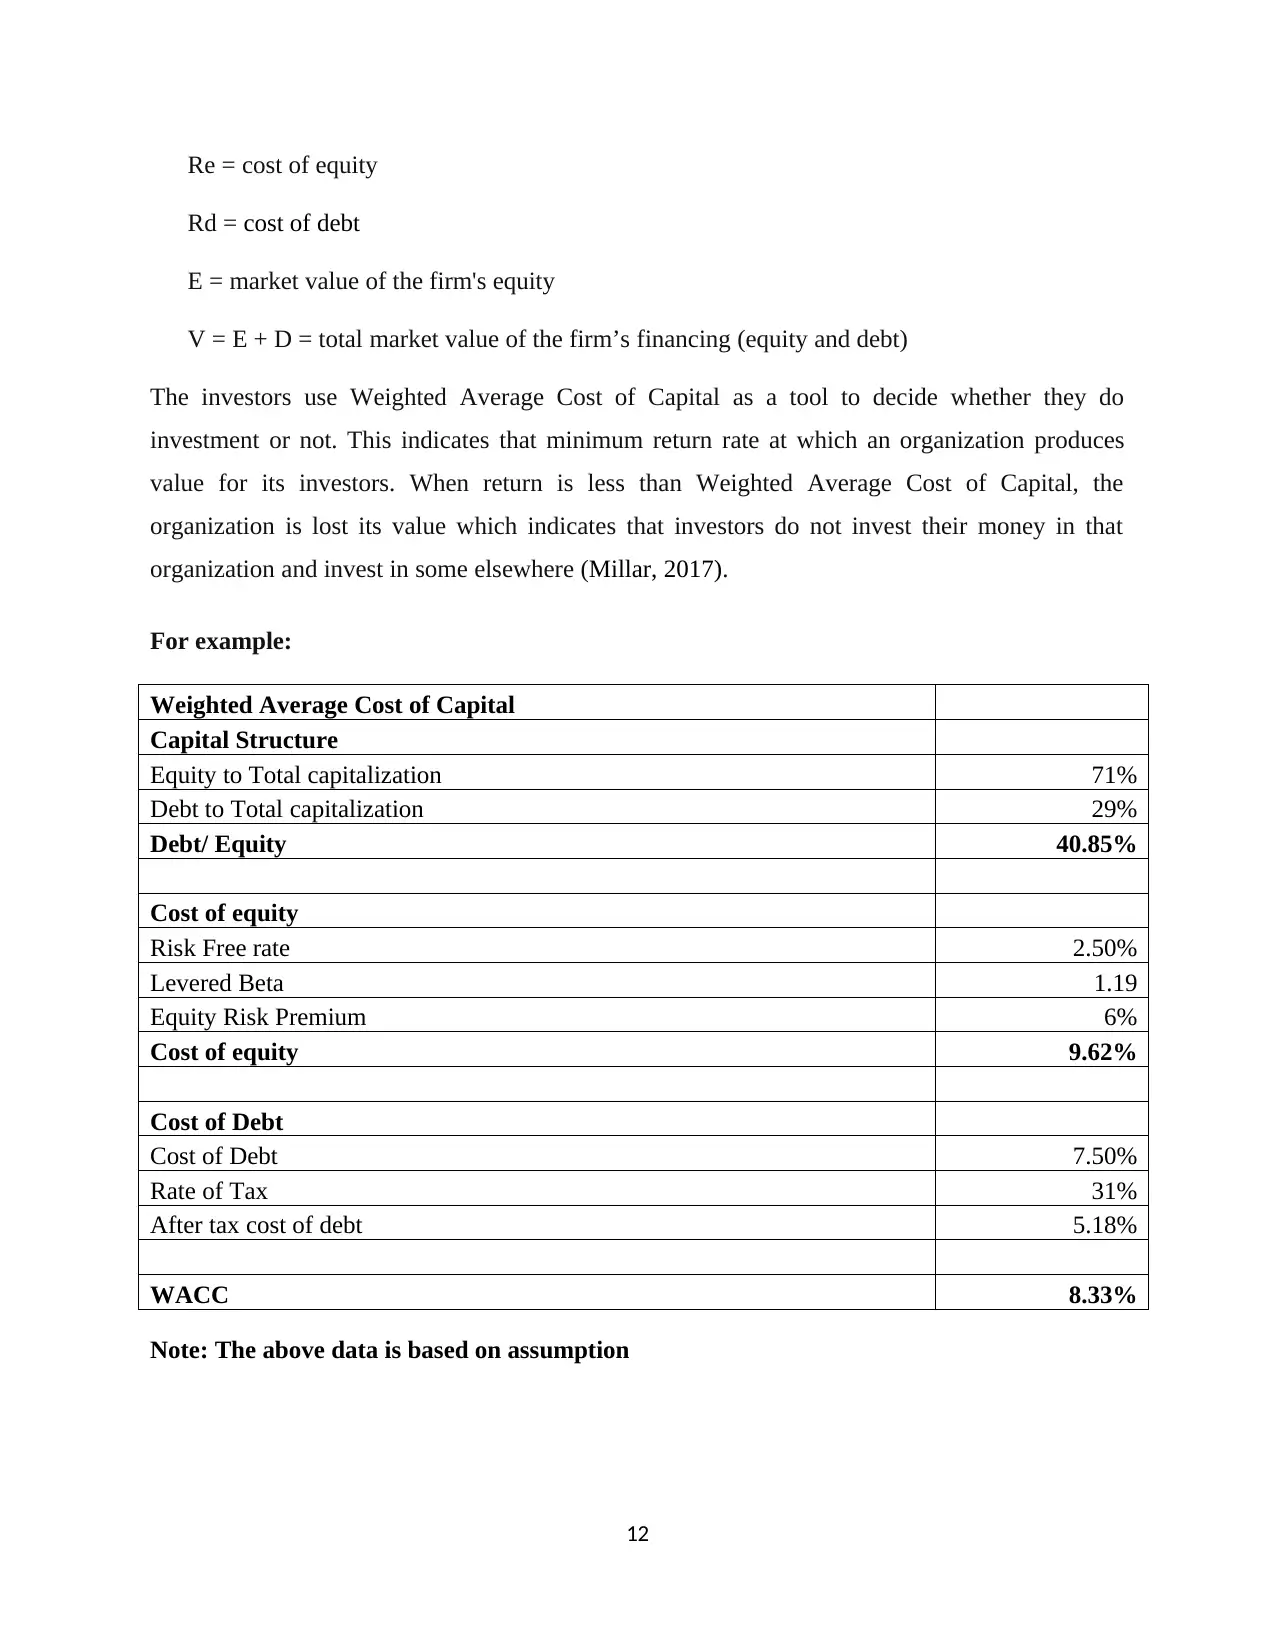
Re = cost of equity
Rd = cost of debt
E = market value of the firm's equity
V = E + D = total market value of the firm’s financing (equity and debt)
The investors use Weighted Average Cost of Capital as a tool to decide whether they do
investment or not. This indicates that minimum return rate at which an organization produces
value for its investors. When return is less than Weighted Average Cost of Capital, the
organization is lost its value which indicates that investors do not invest their money in that
organization and invest in some elsewhere (Millar, 2017).
For example:
Weighted Average Cost of Capital
Capital Structure
Equity to Total capitalization 71%
Debt to Total capitalization 29%
Debt/ Equity 40.85%
Cost of equity
Risk Free rate 2.50%
Levered Beta 1.19
Equity Risk Premium 6%
Cost of equity 9.62%
Cost of Debt
Cost of Debt 7.50%
Rate of Tax 31%
After tax cost of debt 5.18%
WACC 8.33%
Note: The above data is based on assumption
12
⊘ This is a preview!⊘
Do you want full access?
Subscribe today to unlock all pages.
Trusted by 1+ million students worldwide
1 out of 18
Related Documents


Your All-in-One AI-Powered Toolkit for Academic Success.
+13062052269
info@desklib.com
Available 24*7 on WhatsApp / Email
![[object Object]](/_next/static/media/star-bottom.7253800d.svg)
Unlock your academic potential
Copyright © 2020–2026 A2Z Services. All Rights Reserved. Developed and managed by ZUCOL.