Financial Analysis of GSK PLC and Zero Based Budgeting Report
VerifiedAdded on 2023/05/30
|17
|5001
|463
Report
AI Summary
This report presents a comprehensive financial analysis of GlaxoSmithKline (GSK) PLC, a leading pharmaceutical company. The first part of the report focuses on evaluating GSK's profitability performance through ratio analysis, comparing it with its competitor Pfizer Inc. Key profitability ratios, including return on capital employed, operating profit margin, and earnings per share, are calculated and analyzed for the years 2016 and 2017. The report also examines the competitive and macroeconomic influences on these ratios. The second part of the report delves into zero-based budgeting, explaining its methodology, benefits, and drawbacks, and contrasting it with incremental budgeting. The report highlights how zero-based budgeting can improve accuracy, cut costs, and enhance communication within an organization. The report utilizes data from GSK PLC's financial reports and other reliable sources to support its analysis.

1
Managing Financial Performance 7AC006
Managing Financial Performance 7AC006
Paraphrase This Document
Need a fresh take? Get an instant paraphrase of this document with our AI Paraphraser
2
Part 1: Profitability performance of GSK PLC
GSK plc refers to GlaxoSmithKline and it ranks amongst the top companies in FT Global
500 companies. GSK is top pharmaceutical company in the world and it operates in two major
sectors: Consumer Healthcare and Pharmaceuticals. The purpose of this section of assignment is
to evaluate the financial performance of GSK Plc through use of ratio analysis. The motive is to
evaluate the profitability performance of the company through calculating some of important
profitability ratios such as return on capital employed, operating profit margin and earnings per
share. In addition to ratio analysis, various competitive and macro-economic influences on each
of profitability ratios has also been discussed in this section of the assignment. Profitability
performance of GSK plc has been compared with one of its top most competitors, Pfizer Inc.
Pfizer also rank amongst the top pharmaceutical company of the world and this company was
founded in New York, USA (GSK Plc, 2017).
Profitability analysis of GSK Plc and Pfizer for year 2016 and 2017
Profitability analysis through ratios aims to measure the management ability to earn the
profits in relation to sales revenue, equity and assets. Profitability analysis also embarks its
importance on return earned by the company on the total capital invested during the period. It is
expected from the management to make sure that there is optimum utilization of resources to
earn maximum sales revenue. Management must also make sure cost of goods sold and operating
expenses should be kept at lowest level so that company can earn maximum profits. Profitability
ratios aim to assess the ability of the company to generate profits, cash flows and earnings in
relation to some base often referred to as total capital invested, or any similar basis. It can be said
that profitability ratios is very useful to evaluate how effectively the profitability of the company
is managed. Each profitability ratio provides different category of information about the financial
health and performance of the entity. For example, operating profit margin and net profit margin
provides information on how effectively company manages its expenses whereas return on
capital employed information on how effectively company uses its capital to generate the returns.
Earnings per share tell how much profit earned by the company on each share of issued in the
market (Higgins, 2012).
Return on Capital Employed
3
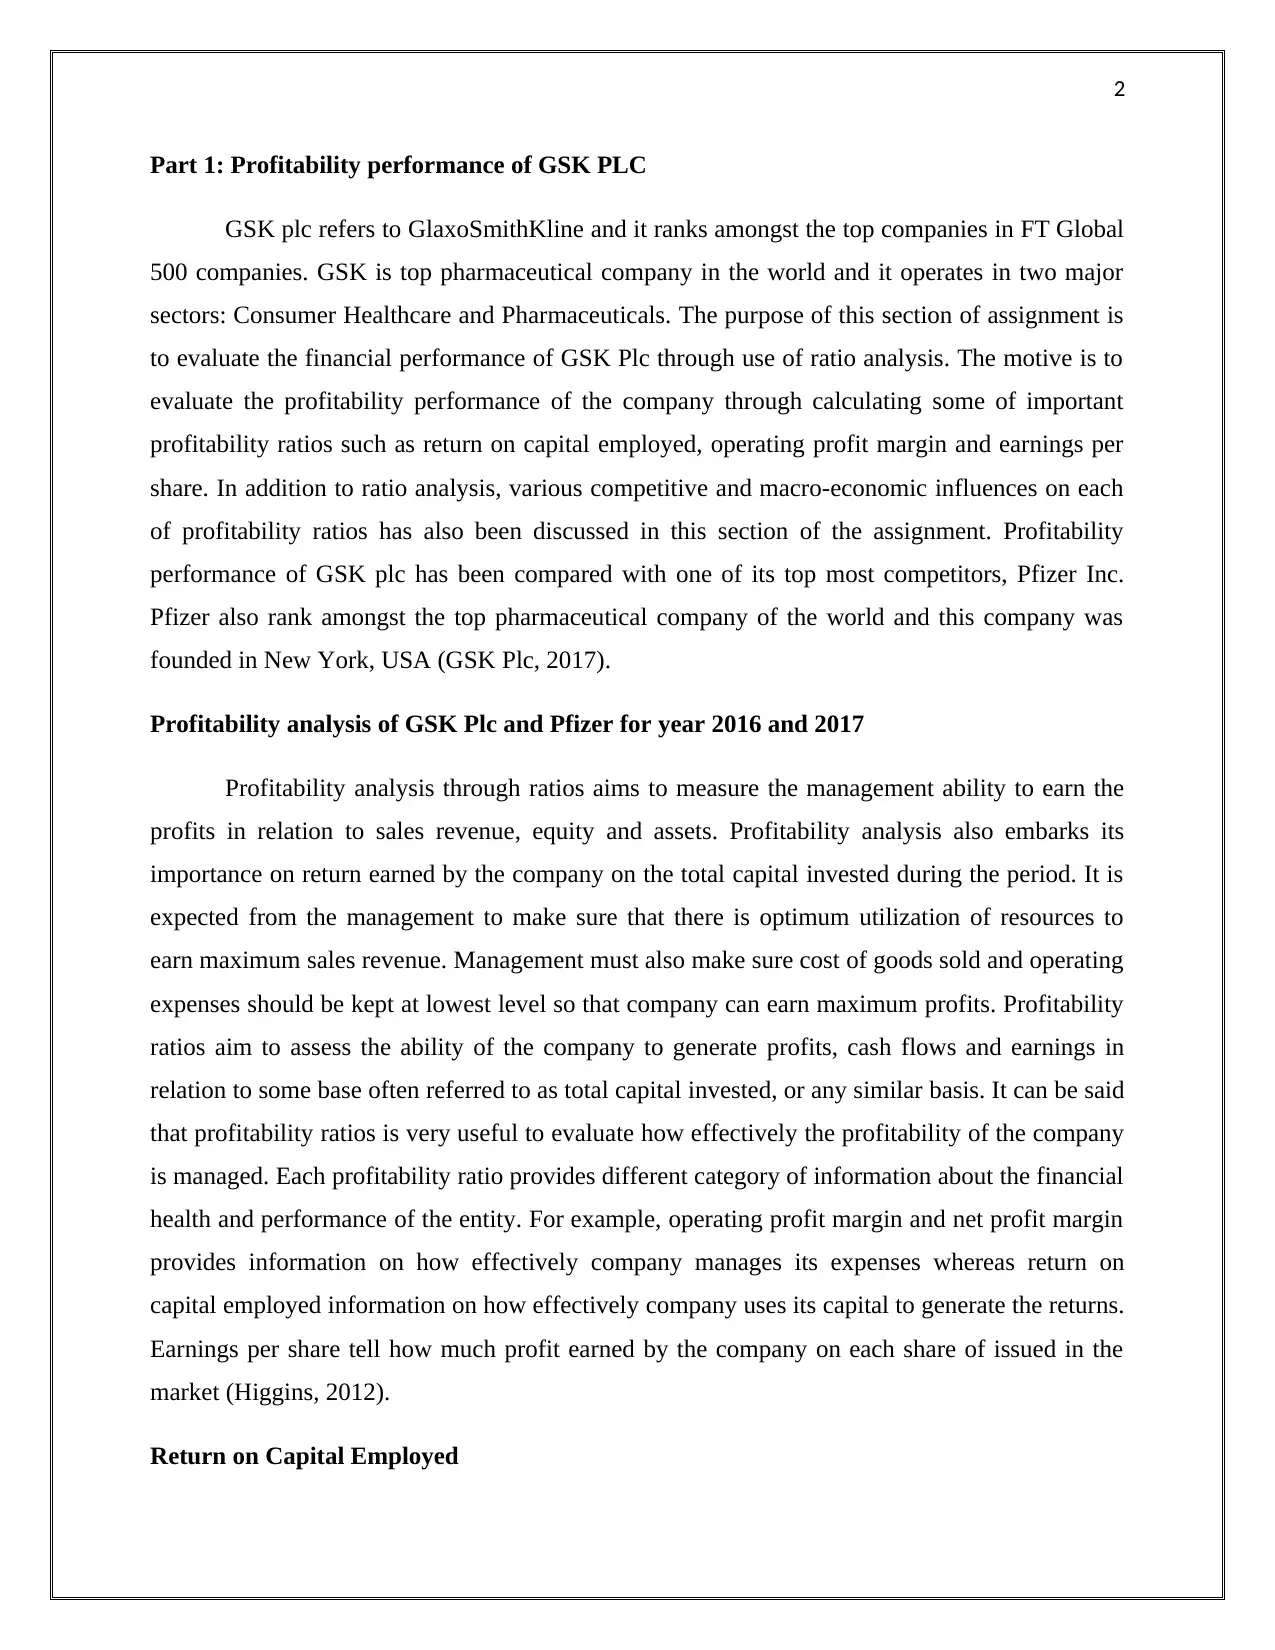
It is the most important profitability ratio that measures the profits earned by company on
percentage of capital employed. Here capital employed means total of shareholder’s fund and
non-current liabilities that is used by the company to financed the assets of the company.
Formula: EBIT/ (shareholder’s Funds + Non-Current Liabilities)
Return on capital employed for GSK
For year 2016: £ 2598 /(£ 35117+ £ 1124) = 7.17%
For year 2017: £4087 + ( £ 26323 + (-68)) = 15.57%
Return on capital employed for Pfizer
For year 2016: £ 8351 / (£ 80661 + £ 59840) = 5.94%
For year 2017: £ 12306 /( £ 69714 + £ 71656) = 8.70% (Horngren, 2009)
Return on Capital Employed
Particulars GSK Plc Pfizer
2016 2017 2016 2017
Ratio 7.17% 15.57% 5.94% 8.70%
(GSK Plc, 2017)
2016 2017
0.00%
2.00%
4.00%
6.00%
8.00%
10.00%
12.00%
14.00%
16.00%
Return on Capital Employed
Percentage
⊘ This is a preview!⊘
Do you want full access?
Subscribe today to unlock all pages.
Trusted by 1+ million students worldwide
4
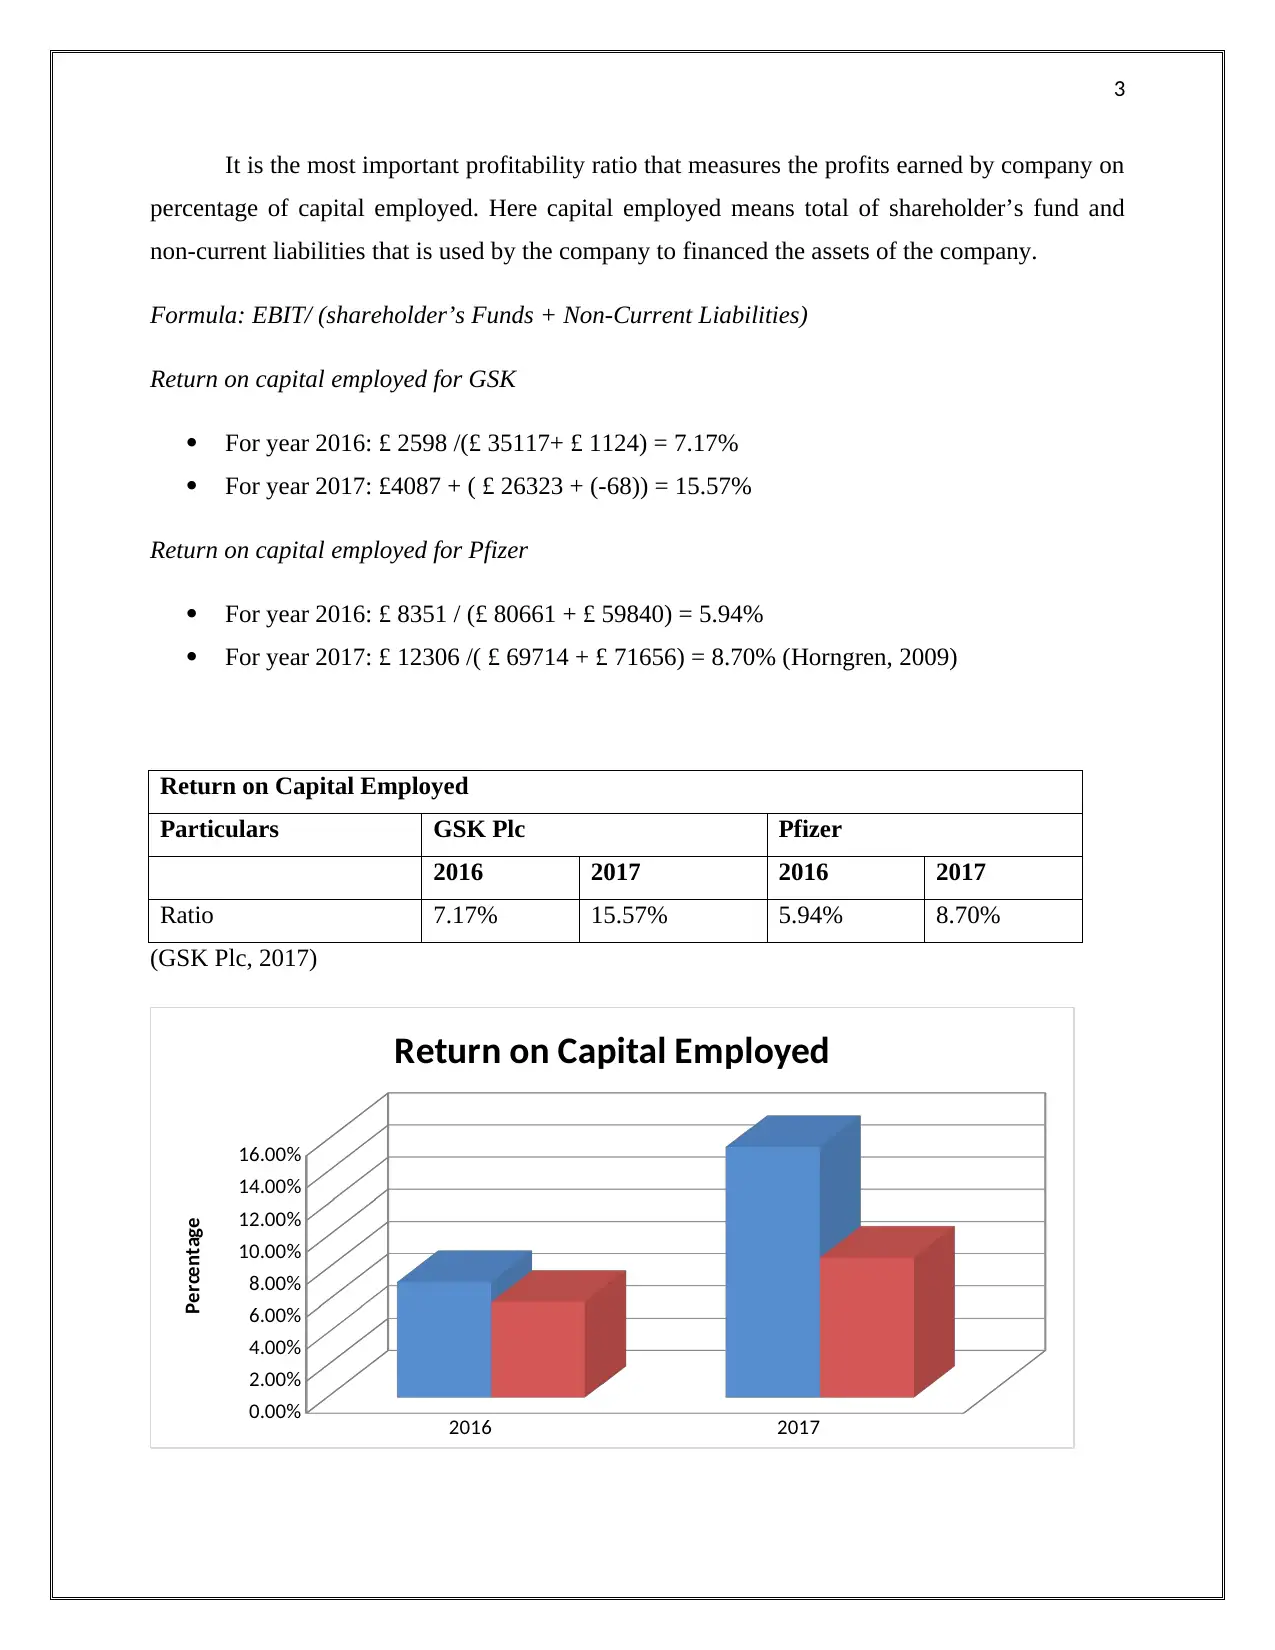
Return on capital of employed of GSK Plc was better than the Pfizer in both the years. In
year 2016, the return on capital employed was 7.17% and it was increased to 15.57% in year
2017. On the other hand, return on capital employed of Pfizer was 5.94% in year 2016 and it got
increased to 8.70%. So, it can be said that GSK plc has provided better returns on the total
capital employed by the company.
Operating Profit Margin
This ratio is used to evaluate the operating performance of the entity and it indicates the
percentage of sales earned by the company after paying cost of goods sold charges and operating
expenses. It is generally expressed as the percentage of sales. This ratio is the best tool to
evaluate the performance of one company with the performance of other company (Kaplan and
Atkinson, 2015).
Formula: Operating profit margin / Sales Revenue * 100
Operating profit margin for GSK
For year 2016: £ 2598/£27889 = 9.32%
For year 2017: £4087/£ 30186 = 13.54%
Operating profit margin for Pfizer
For year 2016: £ 8351 / £ 52824 = 15.81%
For year 2017: £ 12306 / 52546 = 23.42%
Operating Profit Margin
Particulars GSK Plc Pfizer
2016 2017 2016 2017
Ratio 9.32% 13.54% 15.81% 23.42%
(GSK Plc, 2017)
Paraphrase This Document
Need a fresh take? Get an instant paraphrase of this document with our AI Paraphraser
5
2016 2017
0.00%
5.00%
10.00%
15.00%
20.00%
25.00%
Operating Profit Margin
Percentage
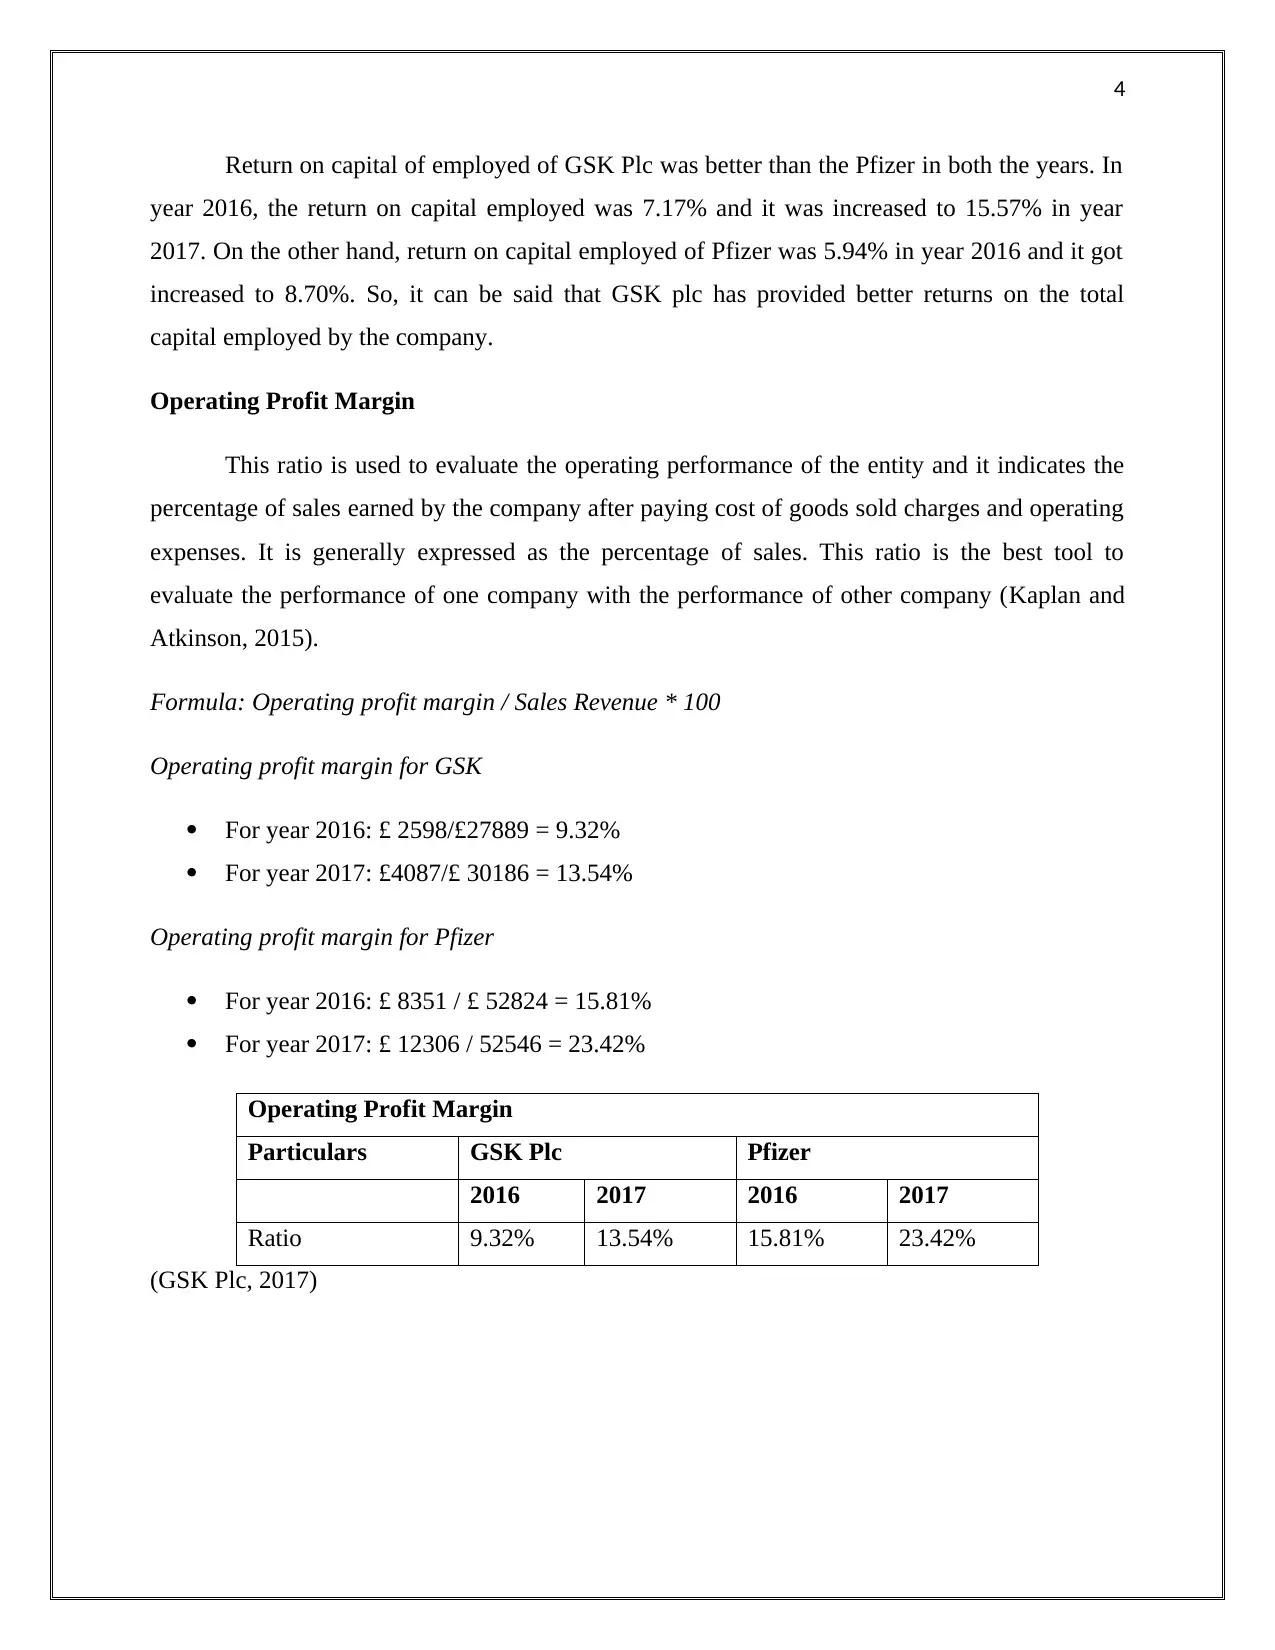
On the basis of above graph it can be said that operating profit margin of GSK Plc was
lower than the Pfizer. It can be said that Pfizer has lower rate of operating expenses as compared
to GSK plc that helps them to maintain higher rate of operating profit margin. So it can be said
that GSK plc has poor profitability due to lower operating profit margin.
Earnings per share: Earnings per share refer to that part of profits that is meant for distribution
to the shareholders on each outstanding share. Earnings per share is very important form the
investors point of view as it is very good indicator of profitability. It is the reason why this ratio
is widely used to assess the profitability of companies (Firer, 2012).
Formula: (Net Profit after Taxes) / Number of Equity Shares
Earnings per share
Particulars GSK Plc Pfizer
2016 2017 2016 2017
Ratio £ 0.19 £ 0.31 £ 1.19 £ 3.58
(GSK Plc, 2017)
2016 2017
0.00%
5.00%
10.00%
15.00%
20.00%
25.00%
Operating Profit Margin
Percentage
On the basis of above graph it can be said that operating profit margin of GSK Plc was
lower than the Pfizer. It can be said that Pfizer has lower rate of operating expenses as compared
to GSK plc that helps them to maintain higher rate of operating profit margin. So it can be said
that GSK plc has poor profitability due to lower operating profit margin.
Earnings per share: Earnings per share refer to that part of profits that is meant for distribution
to the shareholders on each outstanding share. Earnings per share is very important form the
investors point of view as it is very good indicator of profitability. It is the reason why this ratio
is widely used to assess the profitability of companies (Firer, 2012).
Formula: (Net Profit after Taxes) / Number of Equity Shares
Earnings per share
Particulars GSK Plc Pfizer
2016 2017 2016 2017
Ratio £ 0.19 £ 0.31 £ 1.19 £ 3.58
(GSK Plc, 2017)
6
2016 2017
£-
£0.50
£1.00
£1.50
£2.00
£2.50
£3.00
£3.50
£4.00
EPS
Amount
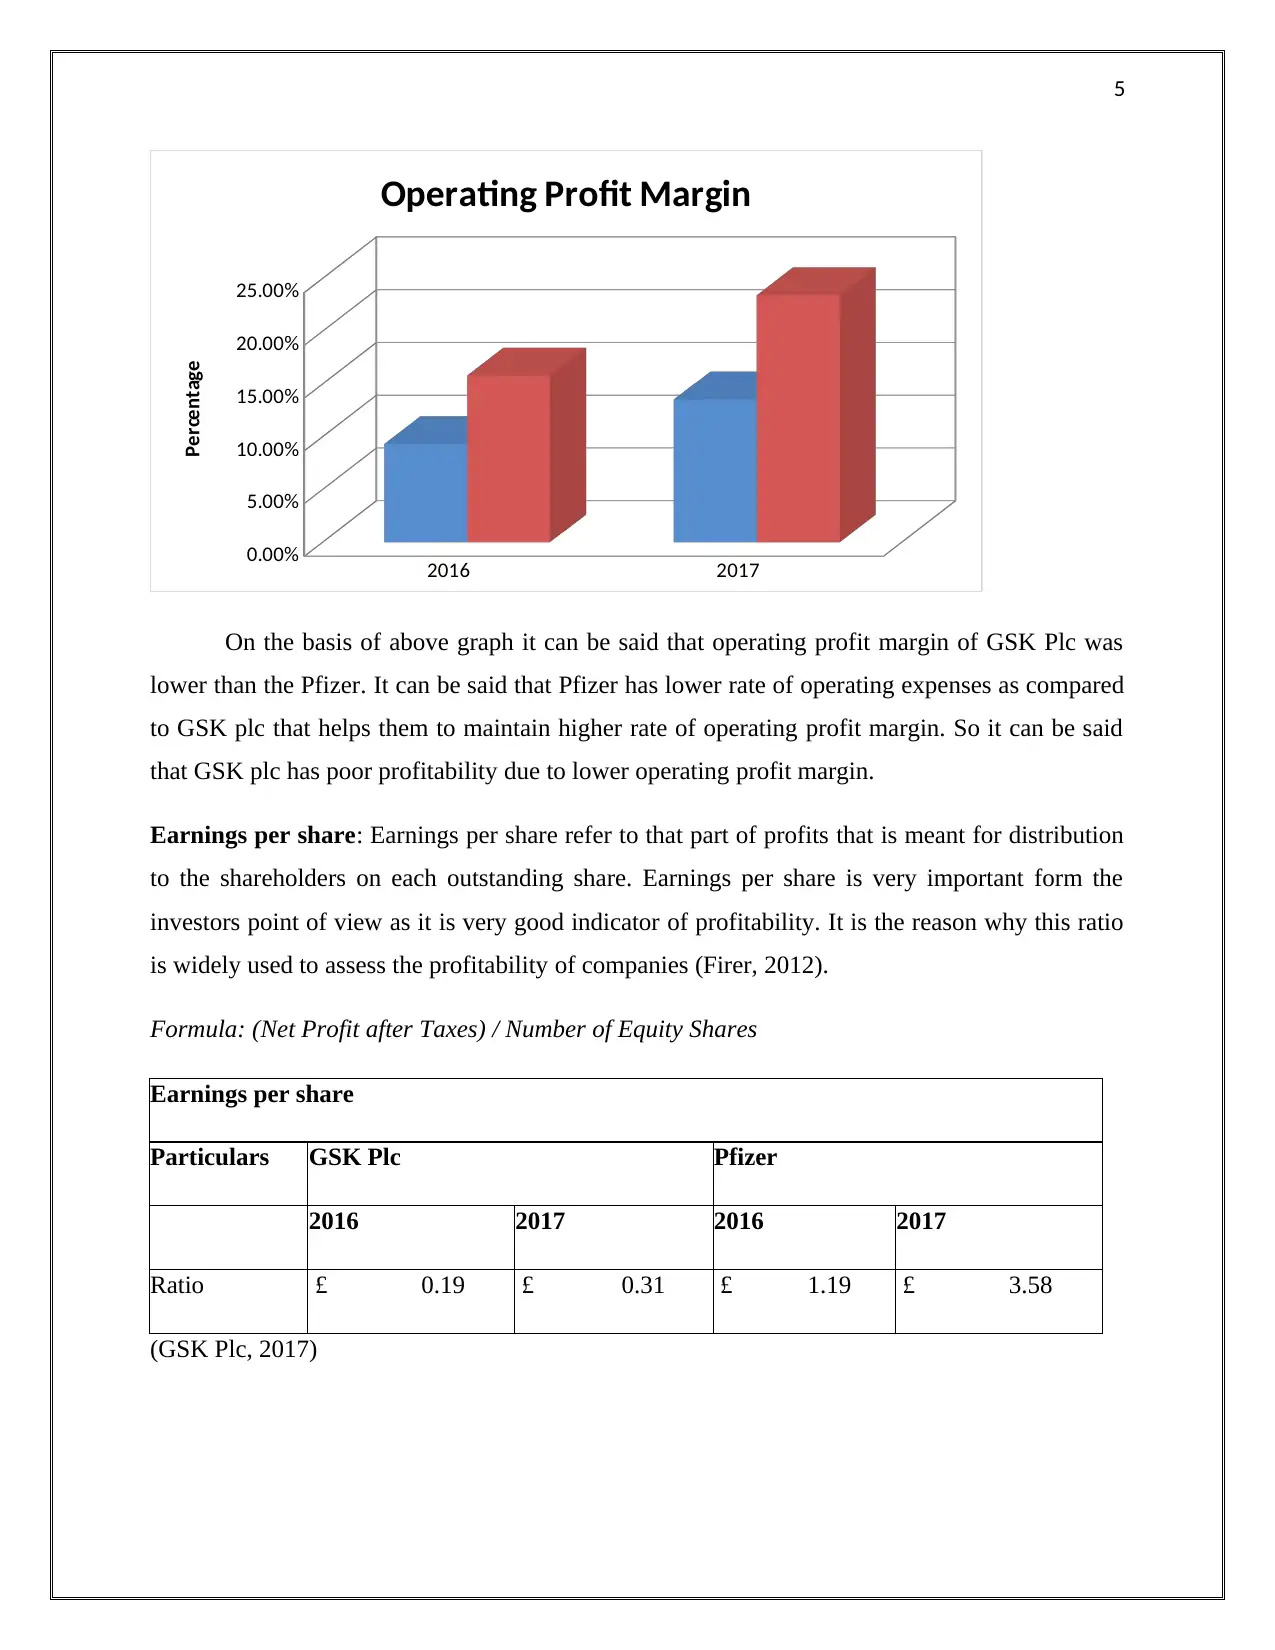
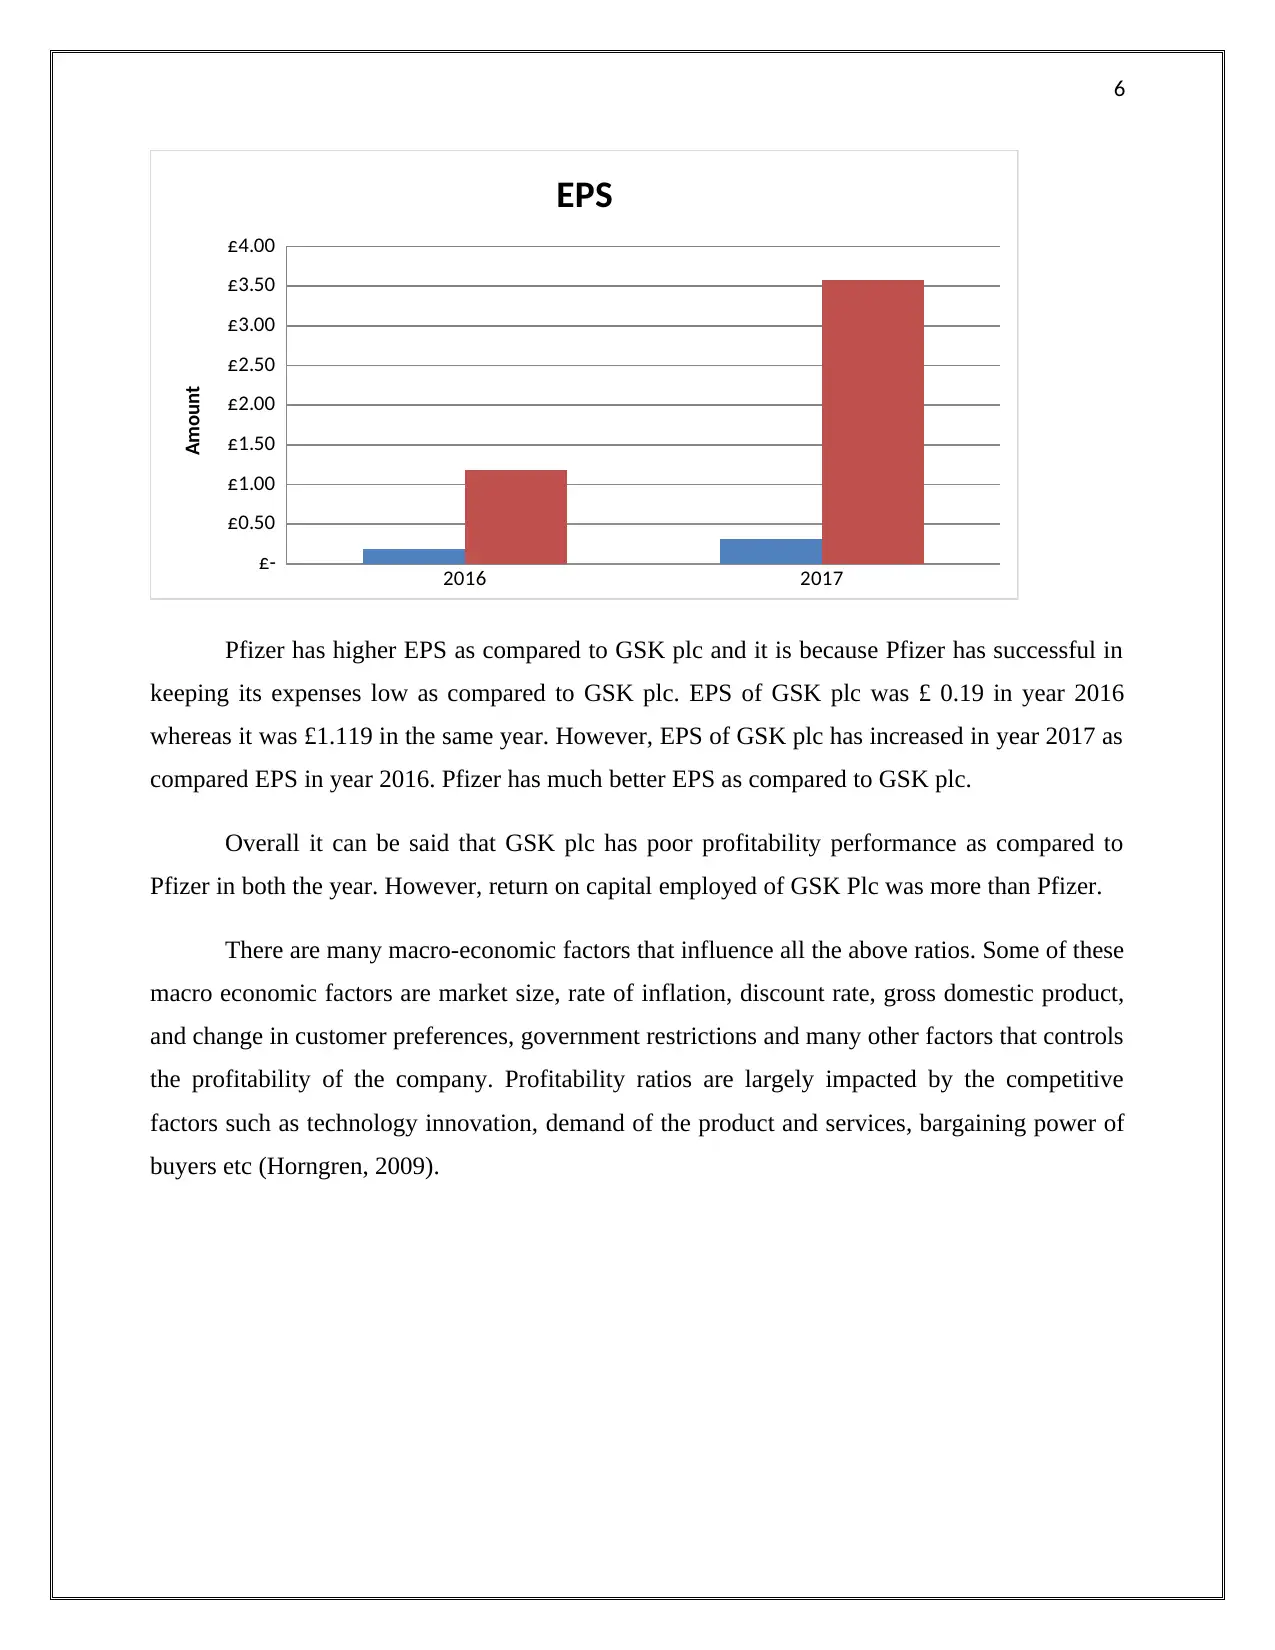
Pfizer has higher EPS as compared to GSK plc and it is because Pfizer has successful in
keeping its expenses low as compared to GSK plc. EPS of GSK plc was £ 0.19 in year 2016
whereas it was £1.119 in the same year. However, EPS of GSK plc has increased in year 2017 as
compared EPS in year 2016. Pfizer has much better EPS as compared to GSK plc.
Overall it can be said that GSK plc has poor profitability performance as compared to
Pfizer in both the year. However, return on capital employed of GSK Plc was more than Pfizer.
There are many macro-economic factors that influence all the above ratios. Some of these
macro economic factors are market size, rate of inflation, discount rate, gross domestic product,
and change in customer preferences, government restrictions and many other factors that controls
the profitability of the company. Profitability ratios are largely impacted by the competitive
factors such as technology innovation, demand of the product and services, bargaining power of
buyers etc (Horngren, 2009).
2016 2017
£-
£0.50
£1.00
£1.50
£2.00
£2.50
£3.00
£3.50
£4.00
EPS
Amount
Pfizer has higher EPS as compared to GSK plc and it is because Pfizer has successful in
keeping its expenses low as compared to GSK plc. EPS of GSK plc was £ 0.19 in year 2016
whereas it was £1.119 in the same year. However, EPS of GSK plc has increased in year 2017 as
compared EPS in year 2016. Pfizer has much better EPS as compared to GSK plc.
Overall it can be said that GSK plc has poor profitability performance as compared to
Pfizer in both the year. However, return on capital employed of GSK Plc was more than Pfizer.
There are many macro-economic factors that influence all the above ratios. Some of these
macro economic factors are market size, rate of inflation, discount rate, gross domestic product,
and change in customer preferences, government restrictions and many other factors that controls
the profitability of the company. Profitability ratios are largely impacted by the competitive
factors such as technology innovation, demand of the product and services, bargaining power of
buyers etc (Horngren, 2009).
⊘ This is a preview!⊘
Do you want full access?
Subscribe today to unlock all pages.
Trusted by 1+ million students worldwide
7
Part 2: Zero Based Budgeting
Zero based budgeting is type budgeting method used under the budgeting process of the
entities. Under this process budgeting is performed from the zero base ie all the data and
information are gathered first time. In zero based budgeting process either past information is not
available or management wants from cost manager to formulate complete budgets without using
the past information. Zero based budgeting process is time consuming as it requires evaluating
every line item of the cash flow and other budgets. It requires all the cash inflows and outflows
to be justified in detail so that there will be very less variance in the budgets and actual outputs
(Wetherbe and Montanari, 1986).
Zero based budgeting is most important budgeting system that is based on current
estimates of all the activities whether old or new. It does not take into account the budget
developed for the past activities. The application of zero based budgeting takes organization very
far away from the incremental based budgeting or traditional budgeting. In incremental budget
previous year budget is taken as the starting point and any addition or modifications are carried
on previous budgets to formulate the current year budgets. Whereas in zero based budgeting cost
manager starts from zero point and takes an assumptions that previous spending patterns are no
longer used (Varlotta and Jones, 2010).
Under zero based budgeting organization are divided into lowest level possible and these
units are called as decision units. Budgeting decisions are now taken for these decisions units and
after than all the data is combined to prepare the current year budget. The procedure adopted in
zero based budgeting is complicated as compared to incremental based budgeting and it requires
more time to prepare the budgets as each cost in an activity is cross examined before preparing
the new budgets. Managers in each decision unit are required to provide detailed information
about all the activities including the spending plan required to achieve the goals of those decision
units. This end ups with minimum three decision packages of each decision units and to the
maximum it can be 10 or more. The three important decision packages that are prepared are base
package, current service package, and enhanced package. There are some difference in these
decision packages that describes difference of marginal spending and other variances (Varlotta
and Jones, 2010).
Paraphrase This Document
Need a fresh take? Get an instant paraphrase of this document with our AI Paraphraser
8
Benefits of the zero based budgeting
Zero based budgeting is quite useful to increase the accuracy within the departments as it
ensures through examination of each of the functions performed within the department.
Under this budgeting technique managers need to examine needs of resources by each
activity and also the level of efforts and different ways to complete the activities are
identified.
Zero based budgeting takes into account the opinion and concerns of mid level as well as
line managers as this budgeting technique requires detailed information for lowest level
of decision making units.
Zero based budgeting is regarded as the most important basis for cutting the cost of
budgets. Zero based budgeting offers rational and comprehensive ways to reduce the
budget expenses. Various decision packages are developed for each of decision unit
which act as the base to make use of best decision package that is suitable for the
particular activity and also provides maximum benefits as per the expenditure incurred
for that particular activity. It is possible because spending of each activity has been put
under scrutiny before any decision has been taken (Kavanagh, 2012).
Another major advantage that zero based budgeting provides is that it helps the top level
management to gain the greater insights of the workings of the lower level departments.
All the details such as activities, spending and estimates of cost and profits of each
department are documents by each line manager are forwarded to the top level manager
to include into the budgets after performing the complete evaluation.
Resources are allocated in systematic way as operations and programmes of each activity
are evaluated in detail that provides deep insight view of resources required by each
activity. So resources are allocated systematically and in required manner to fulfill the
objectives defined under each activity.
It allows cost benefit comparison of each department budgets on the basis of decision
packages developed for each activity. Unlikely in other budgeting system there is no
arbitrary allocation of resources in case of zero based budgeting (Lalli, 2011).
Activities that are redundant or unproductive can be easily identified and removed after
verification. So it can be said that zero based budgeting is very cost effective and it
9
allows including all those activities that are valuable and provides some productive
results.
Zero based budgeting helps to improve the coordination and communication between the
departments. In turn it helps in increasing the efficiency of the employees as they are
involved in decision making.
Drawbacks of the zero base budgeting
Zero based budgeting is not the one day process as it involves huge time period as well as
requires investment of huge amount of money. So, zero based budgeting is very hard to
implement and requires a decision of top management before making it implement.
It is highly important to make successful implementation of ZBB but it requires full
support from the top management and it has been seen many times support from the top
management is not readily available due to many issues and communication problems.
At the time of preparing the zero based budget there is requirement of experts at every
department that can formulate the decision packages in proper manner (Ackah and
Agboyi, 2014).
Situations when zero based budgeting is most appropriate to use
There are many situations where zero based budgeting is very useful for the companies
but it is necessary to make cost benefit analysis before taking the decision to implement the
activity based budgets. When there is situation where it is not possible to implement the
incremental budgeting technique due to major modifications in the existing process and company
is ongoing with the major expansion. Although zero based is cost expensive but its advantages
proves to be beneficial in near future as it leads to major reduction in cost that is proportion to
activities that are redundant in nature (Ackah and Agboyi, 2014).
⊘ This is a preview!⊘
Do you want full access?
Subscribe today to unlock all pages.
Trusted by 1+ million students worldwide
10
Part 3: Critical Evaluation of Strengths and Weaknesses of the Balance Score Card (BSC)
form of Performance Measurement
The business executives are increasingly viewing the traditional systems used for
performance measurement are largely proving to be ineffective in managing the complexity of
their business operations. This is because the traditional form of performance measurement only
assesses the business performance on the basis of financial parameters and does not take into
consideration the operational measures. As such, the need for business executives to track the
financial and operational metrics has lead to the development of balance scorecard that assesses
the performances of businesses on the basis of four set of parameters. These are financial
measures, customer satisfaction, internal processes, innovation and improvement. The financial
perspective includes the financial metrics that need to be adopted for examining the financial
performance such as return on capital and cash flow. Customer satisfaction includes measures
such as time, quality, performance, service and cost for measuring the satisfaction level of the
customers. The internal processes include measures such as cycle time, quality, employee skills
and productivity for assessing the internal performance of the businesses. The innovation and
learning perspective of the balance scorecard measures the performance of the company on the
basis of the parameters such as its ability to innovate, improve and learn in relation to the value
created for the customers. The strengths and weakness of the balance scorecard form of
performance measurement can be described as follows:
Strengths
BSC acts as a strategic management tool for businesses as it enables the managers in
developing an insight into the internal as well as external performance system. It facilitates the
business managers in transforming the strategy into tangible measures by aligning the strategy
with the overall mission and vision. The business executives with the use of BSC system can
effective coordinate a wide range of management processes such as performance appraisal,
setting of goals, allocating of resources and fostering the employee growth and development.
The project managers can integrate the use of BSC system for transforming the tasks into
tangible performance measures for successful completion of the project. It can prove to be
extremely beneficial for the project managers to continuously monitor the success of a project
and identify the gaps in the performance in advance so that they can be effectively overcome.
Paraphrase This Document
Need a fresh take? Get an instant paraphrase of this document with our AI Paraphraser
11
This will help in maximizing the chances of project success by identifying the tasks that are
behind the schedule and taking effective measures for overcoming the performance in gaps.
Thus, it will help in enhancing the survival chances of an organization by developing a strategy
map that helps in development of a set of interrelated strategic objectives. The development of
various key performance indicators helps the businesses in gaining an overview of their overall
performance level. The balance scorecard enables the companies to report higher quality
management information and facilitates the decision-making process. The development of a well
implemented balance scorecard helps in aligning the organizational processes as per the strategic
priorities and goals.
Weaknesses
The weaknesses of the BSC can be regarded on the basis of high cost and time required
on the part of the companies to implement this management tool. The usefulness of the balance
scorecard depends on outweighing the cost and benefits that are associated with the
implementation of this scorecard. In addition to this, the employee resistance to change can also
negatively impact the successful implementation of the BSC and thus can undermine the benefits
that an organization could achieved by its adoption (Awadallah, 2015).
Extent of Adoption of BSC in global Context
Balance scorecard can be regarded as an integrated performance measurement system
that is being largely accepted by several countries. The large and complex firms are adopting the
use of balance scorecard as the increasing number of stakeholders within these firms requires the
use of comprehensive measurement systems that enables them to adopt the use of such systems
that helps in assessing both financial as well as non-financial performance. For example, Philips
Electronics has adopted the use of BSC for aligning its vision and mission with its overall
strategy. The use of BSC has proved to be largely beneficial for the company for assessing both
its qualitative and quantitative performance. It has been prove to be largely helpful for the
management of the company to measure its qualitative as well as quantitative performance and
thus facilitating the quick decision-making process (Neely, 2005).
Another example that can be cited in the context of a global corporation implemented a BSC is
Toyota Motor Corporation, recognized as most successful and renowned global automaker. The
12
company has developed its corporate scorecard in the year 2003 for assessing the performance of
its operational, internal business processes, financial and stakeholders. It has established its key
performance indicators in all the above mentioned business areas for continual review of
performance of overall business. The adoption of BSC concept has proved to be largely helpful
for the company to record sales and profits, improving customer loyalty and increasing employee
commitment and morale (Kaplan and Norton, 2005). Therefore, it can be stated from the above
examples that global corporations are adopting the use of BSC concept for attaining competitive
advantage by measuring of its financial and non-financial performance. The operational and
financial measures assessed by the development of BSC are aligned with the company’s
strategies for promoting its overall growth and development. It is regarded as critical for
promoting the success of companies in a highly competitive global environment (The Balanced
Scorecard, 2014).
The drawbacks that have been faced by the global corporations by the adoption of a balance
scorecard approach are its increasing complexity and consumption of large amount of resources
on the part of the company for its successful implementation. The implementation of BSC has
resulted in creating workload for some department of companies implementing it as it requires
gathering of complex data. It has also resulted in causing employee resistance and thus it has
been stated in this regard that these potential issues faced by the companies for adoption of BSC
have resulted in incurring them more costs rather than achieving benefits (Mahmoud , 2014).
⊘ This is a preview!⊘
Do you want full access?
Subscribe today to unlock all pages.
Trusted by 1+ million students worldwide
1 out of 17
Related Documents


Your All-in-One AI-Powered Toolkit for Academic Success.
+13062052269
info@desklib.com
Available 24*7 on WhatsApp / Email
![[object Object]](/_next/static/media/star-bottom.7253800d.svg)
Unlock your academic potential
Copyright © 2020–2026 A2Z Services. All Rights Reserved. Developed and managed by ZUCOL.