University of Guelph - STAT*2040 DE Data Analysis Assignment 2019
VerifiedAdded on 2023/04/20
|11
|1067
|96
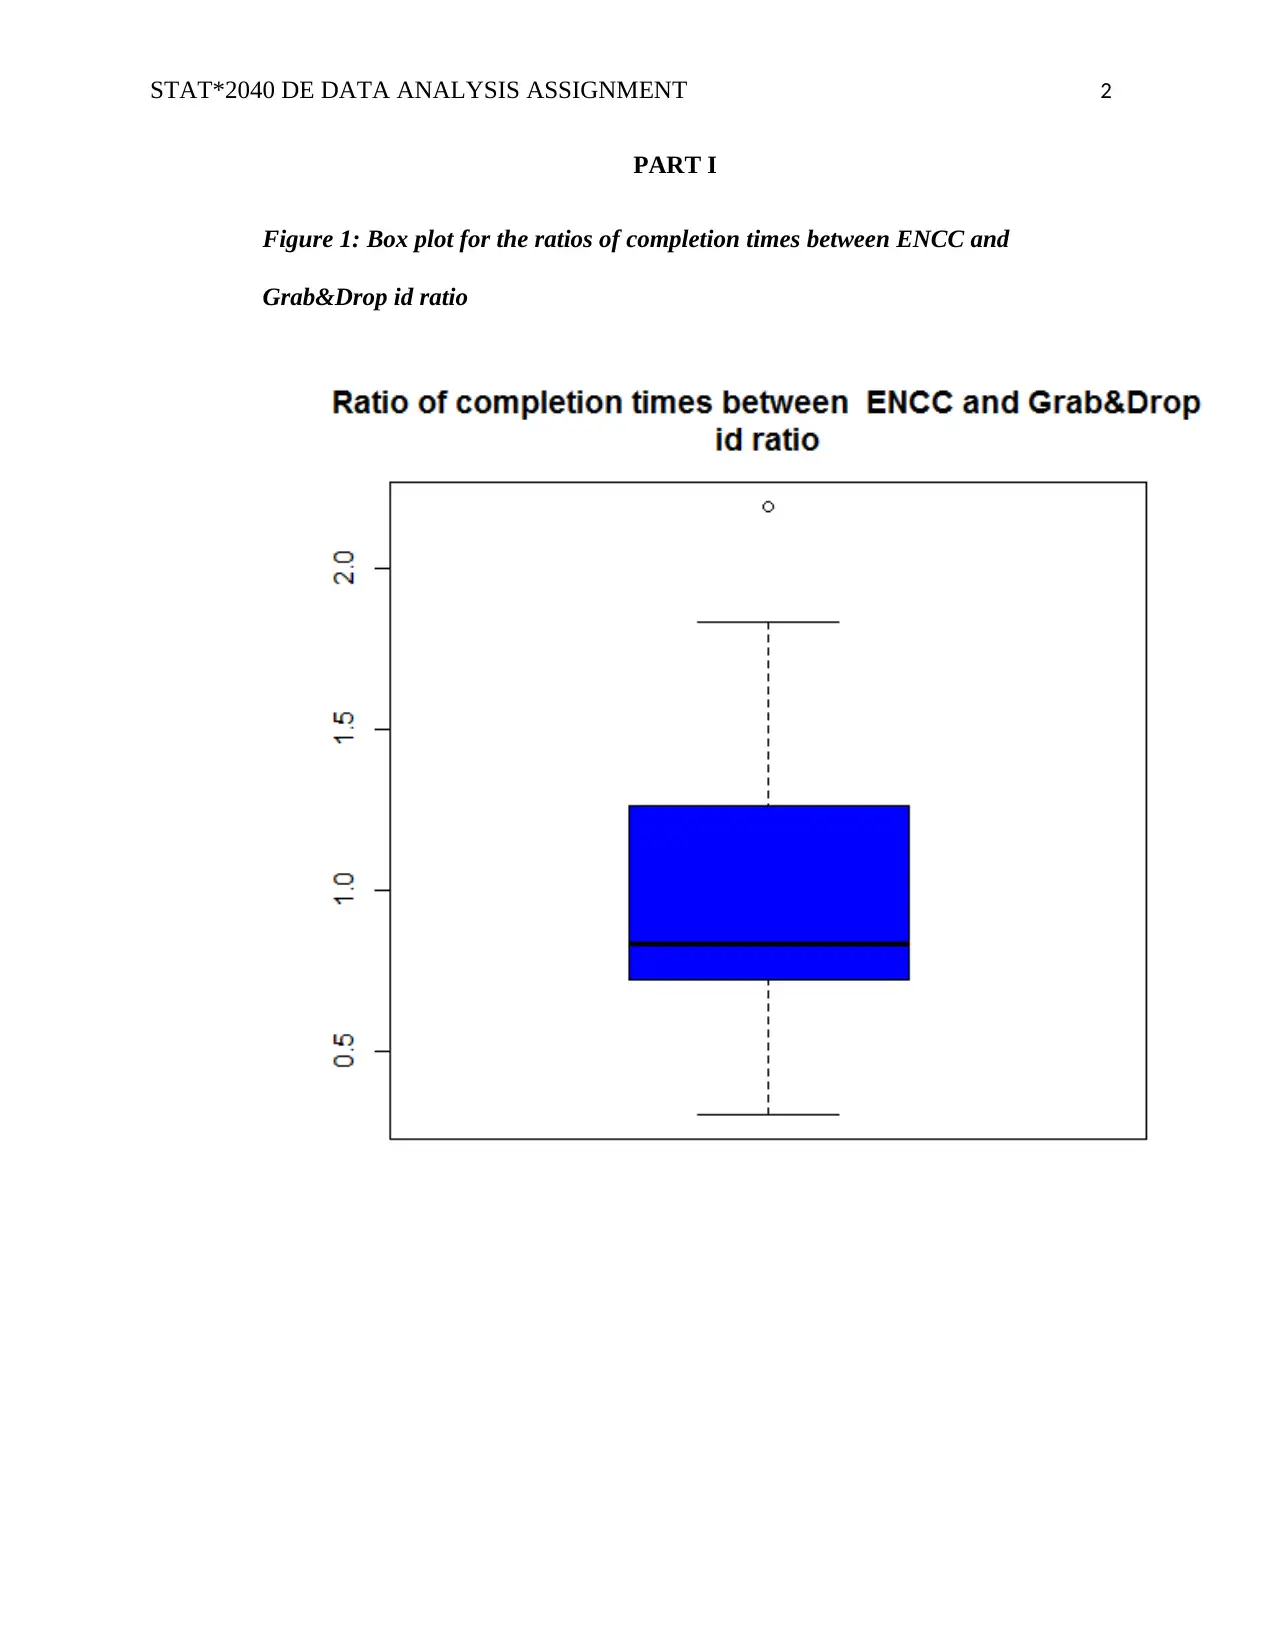
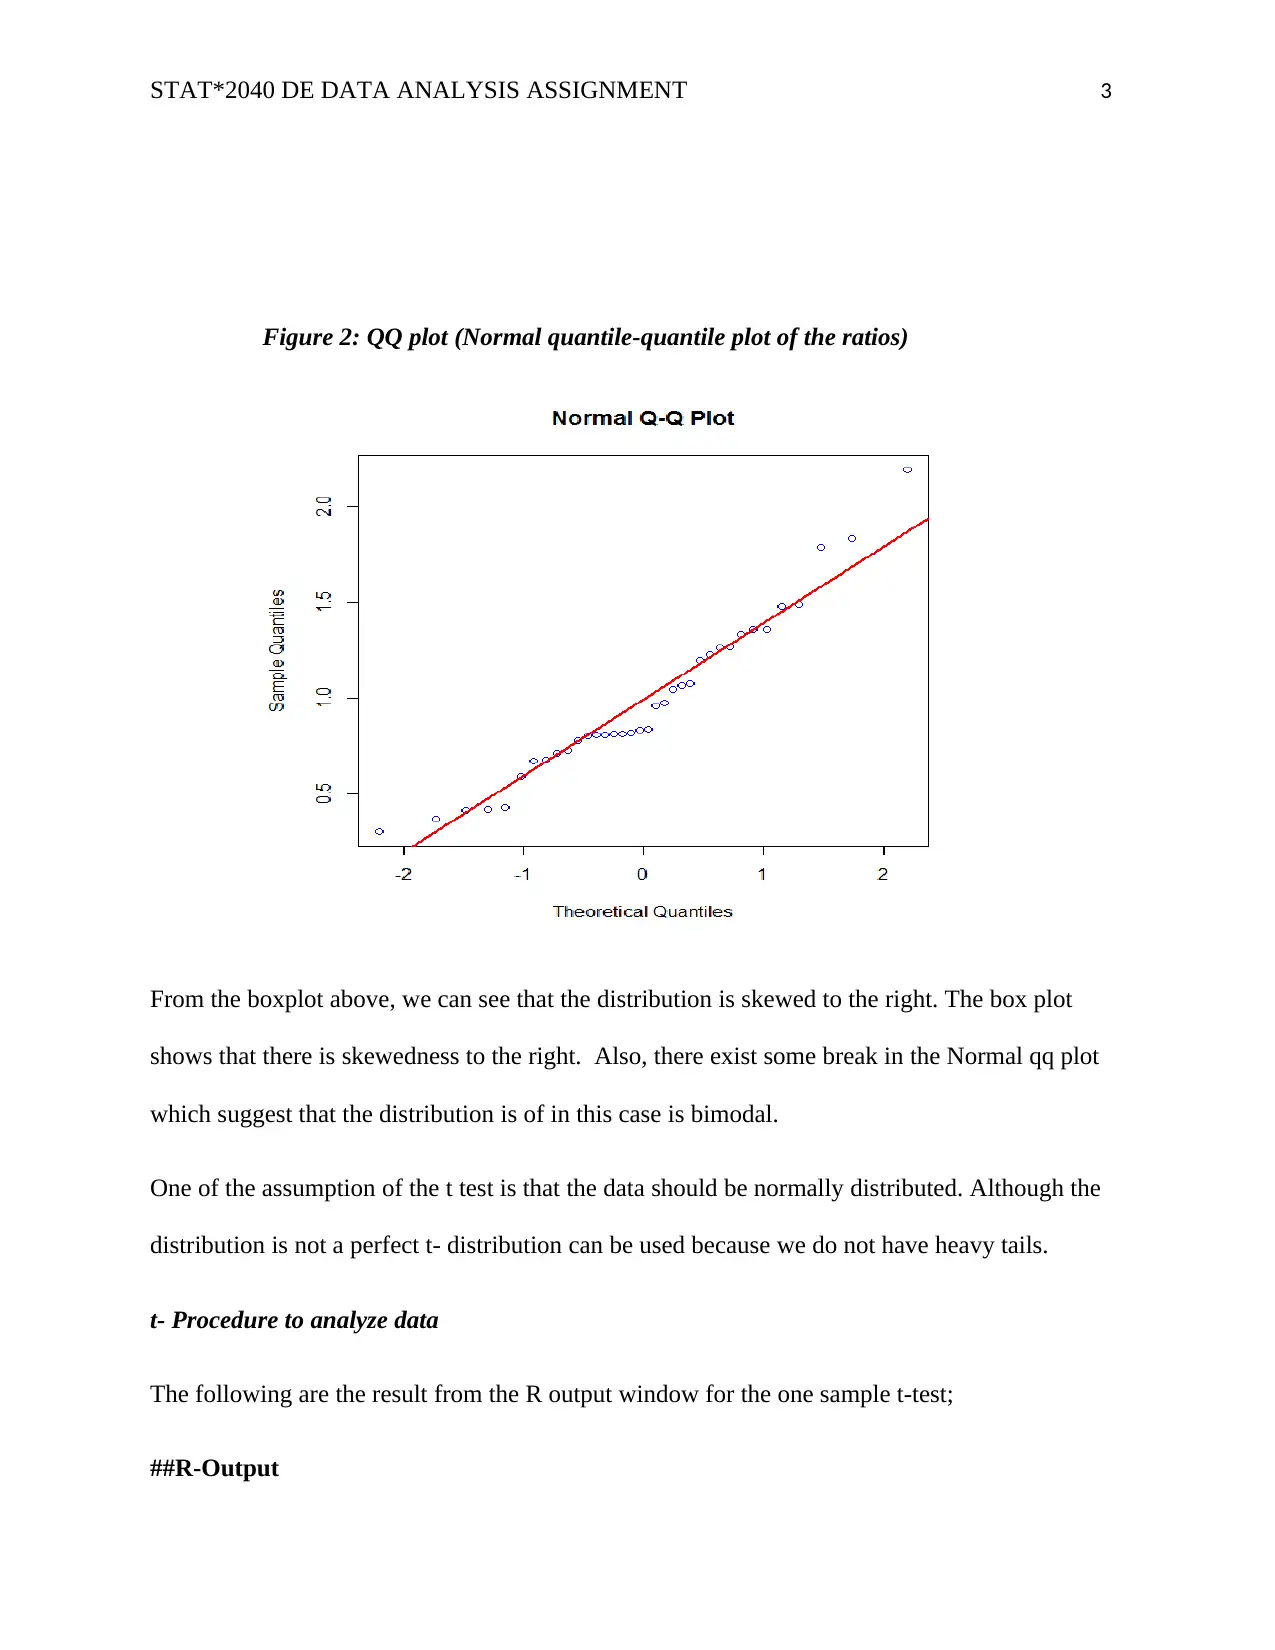
Homework Assignment
AI Summary
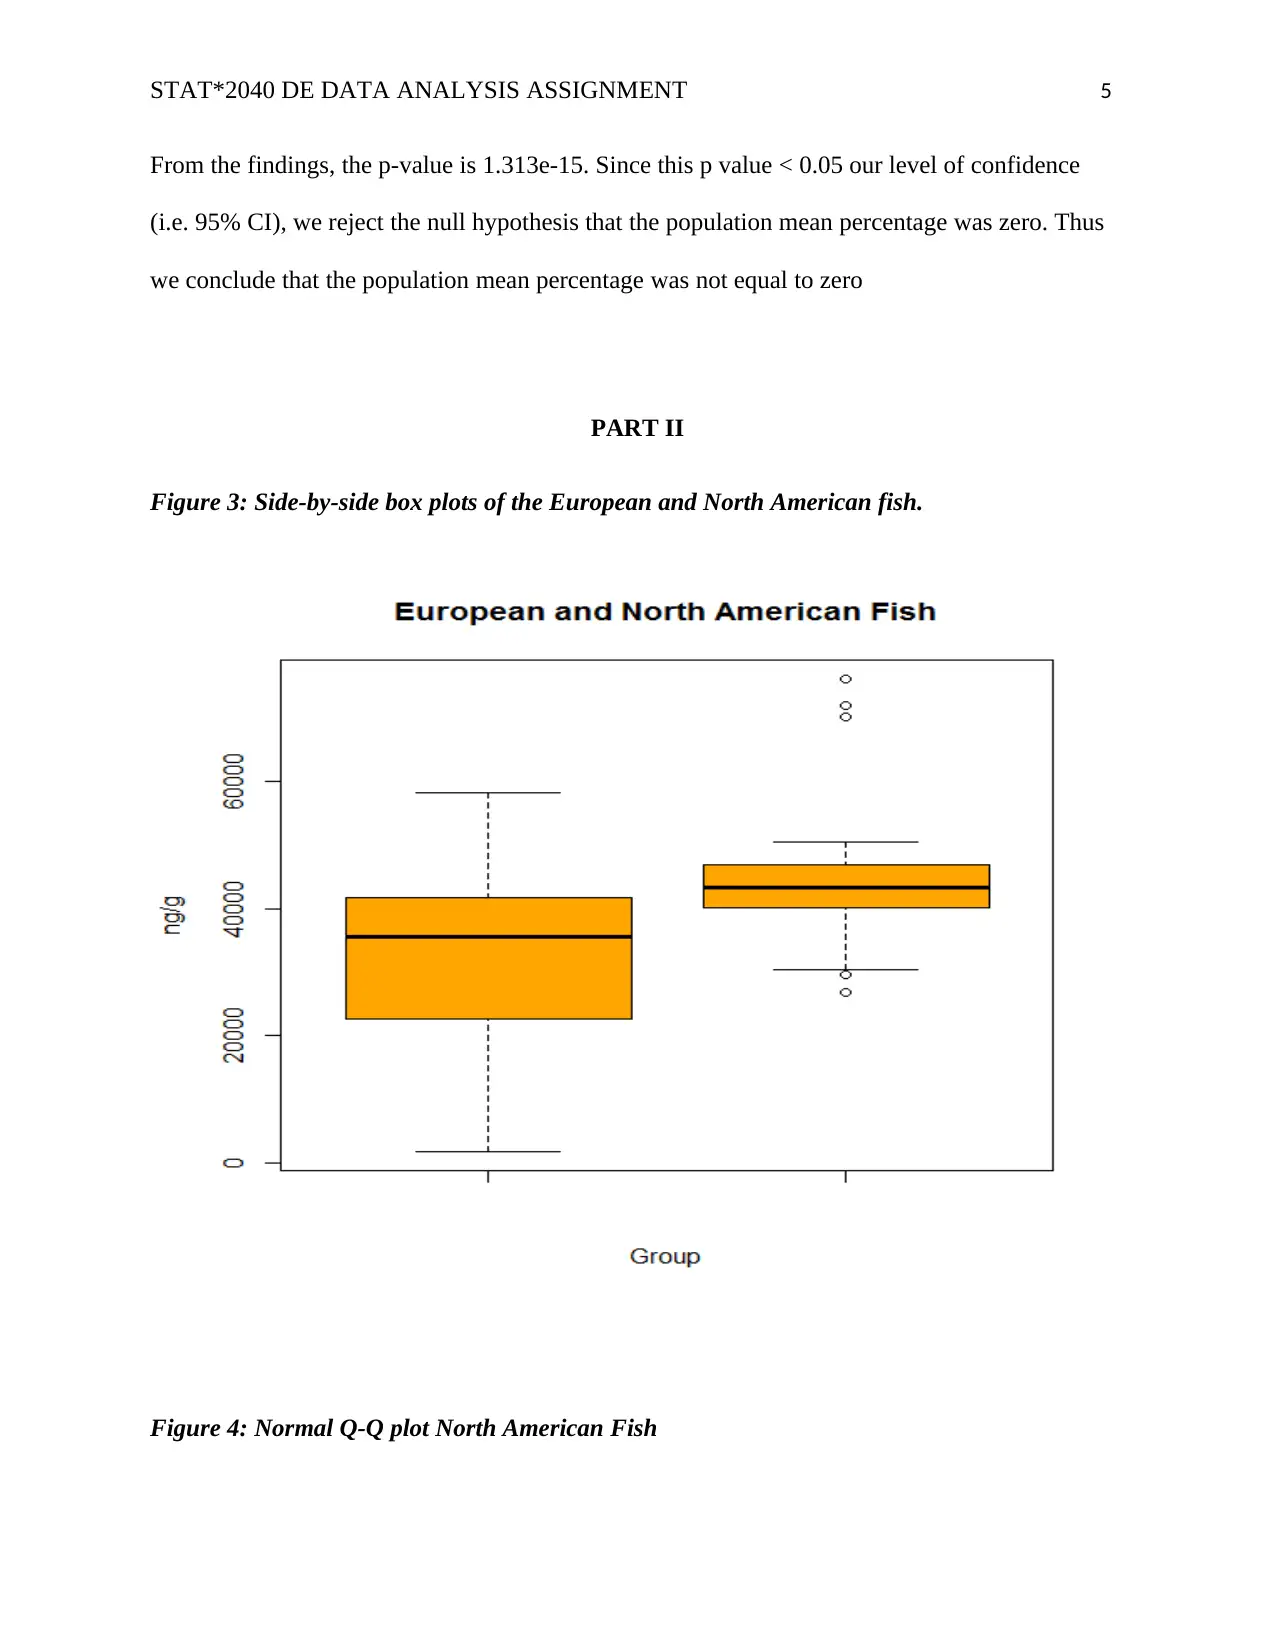
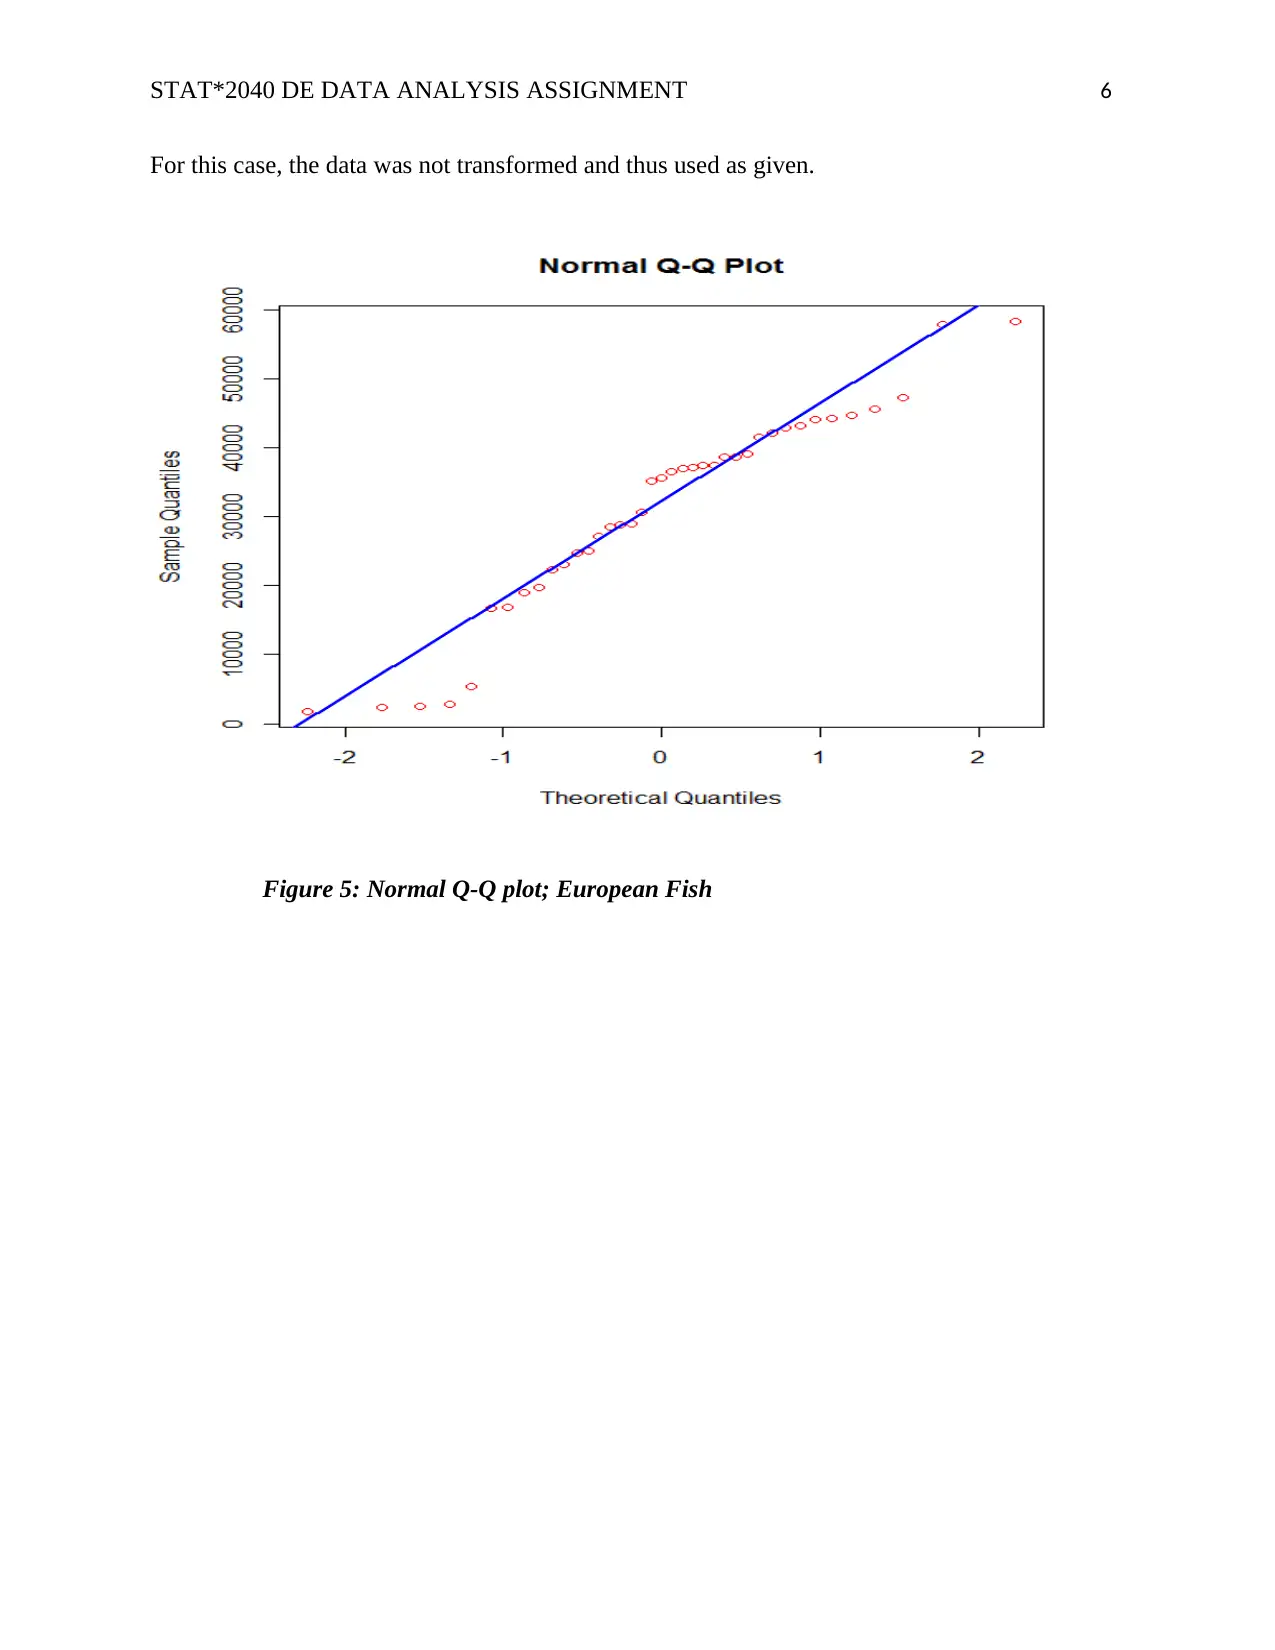
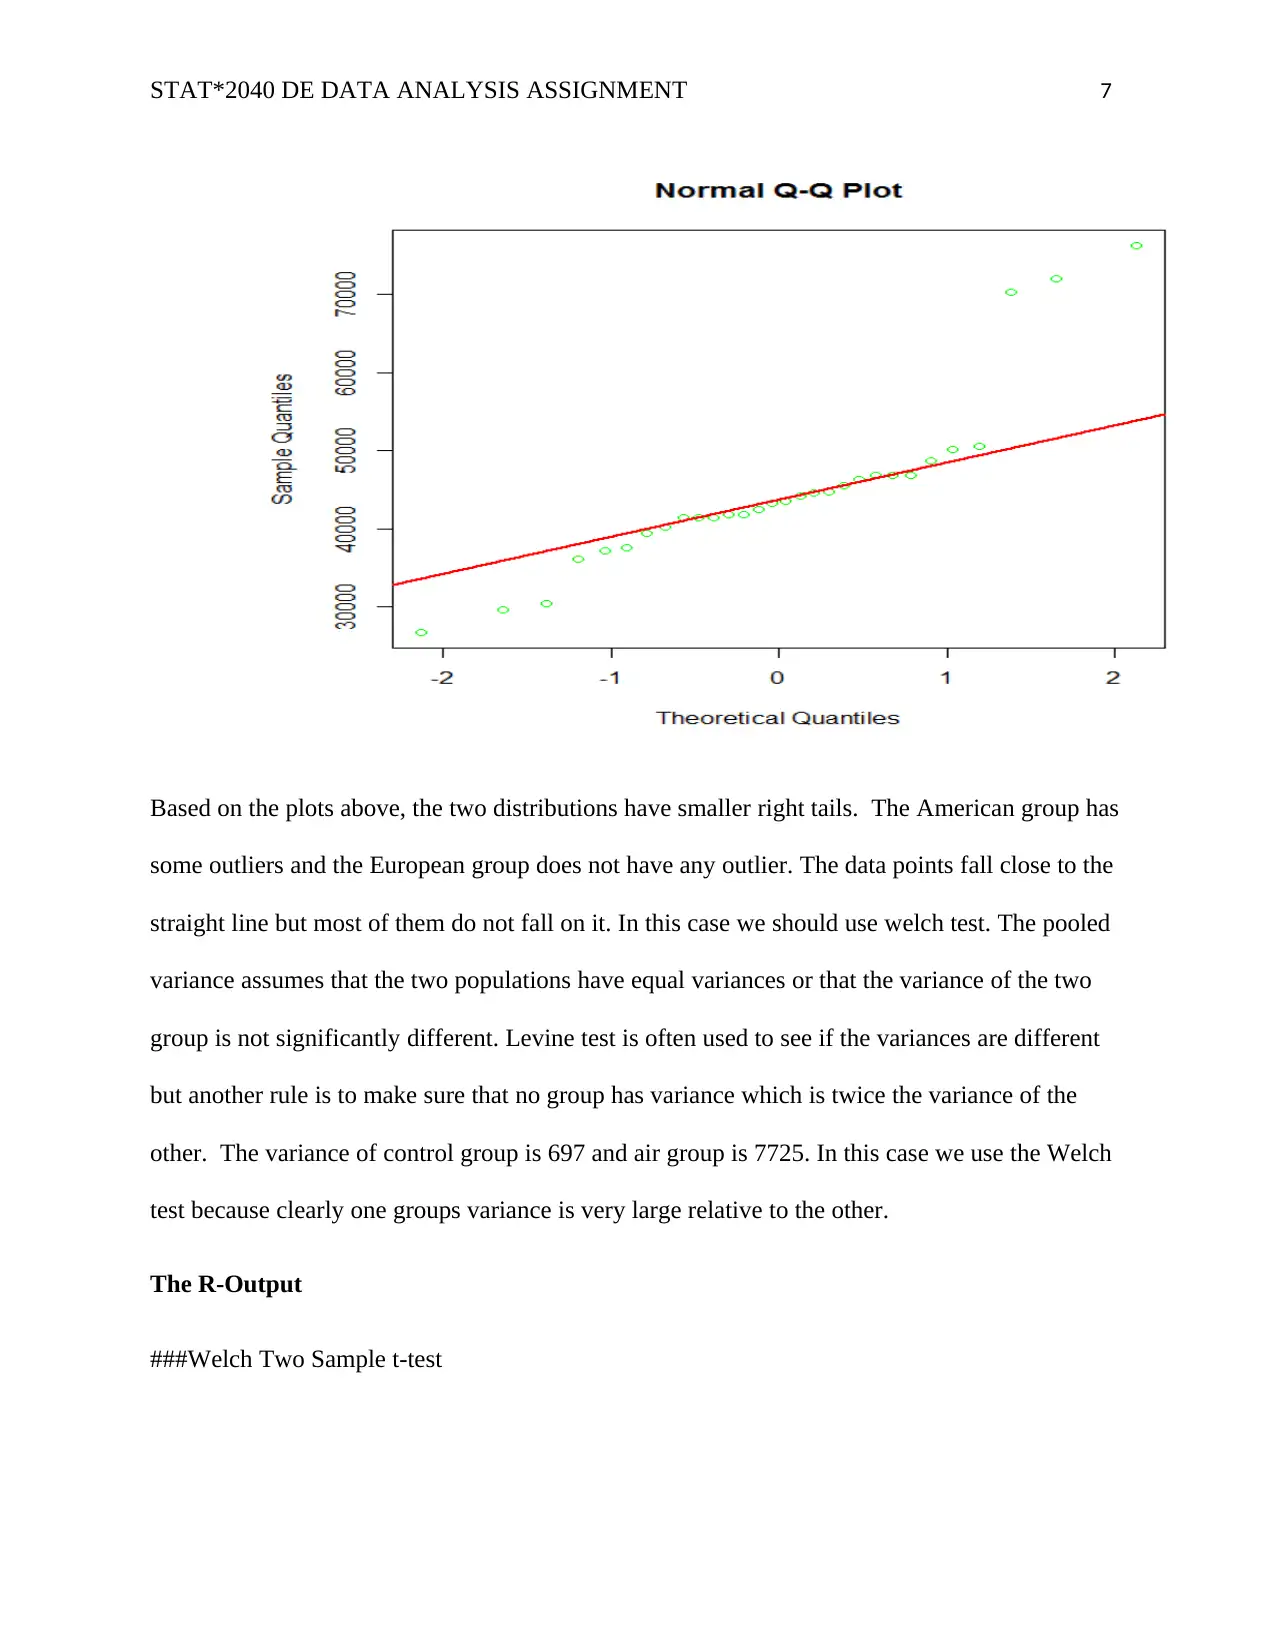
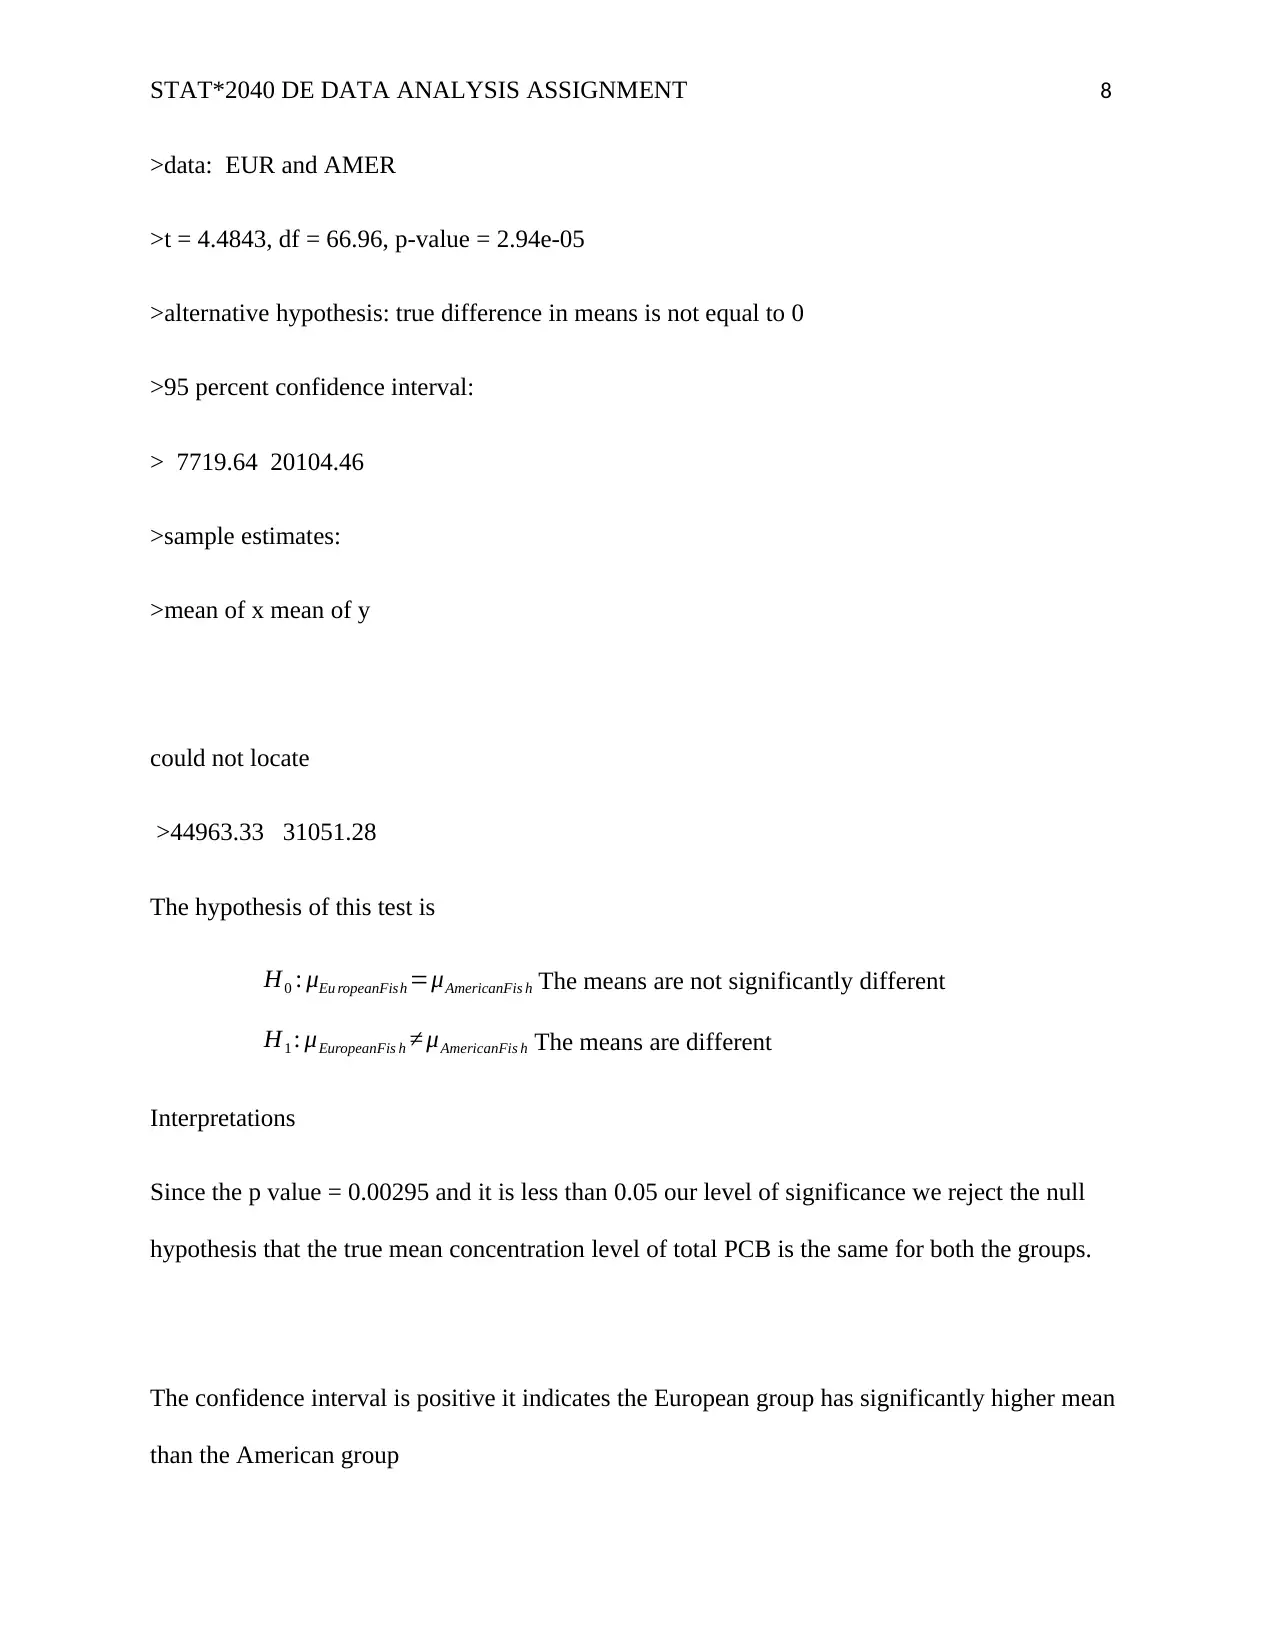
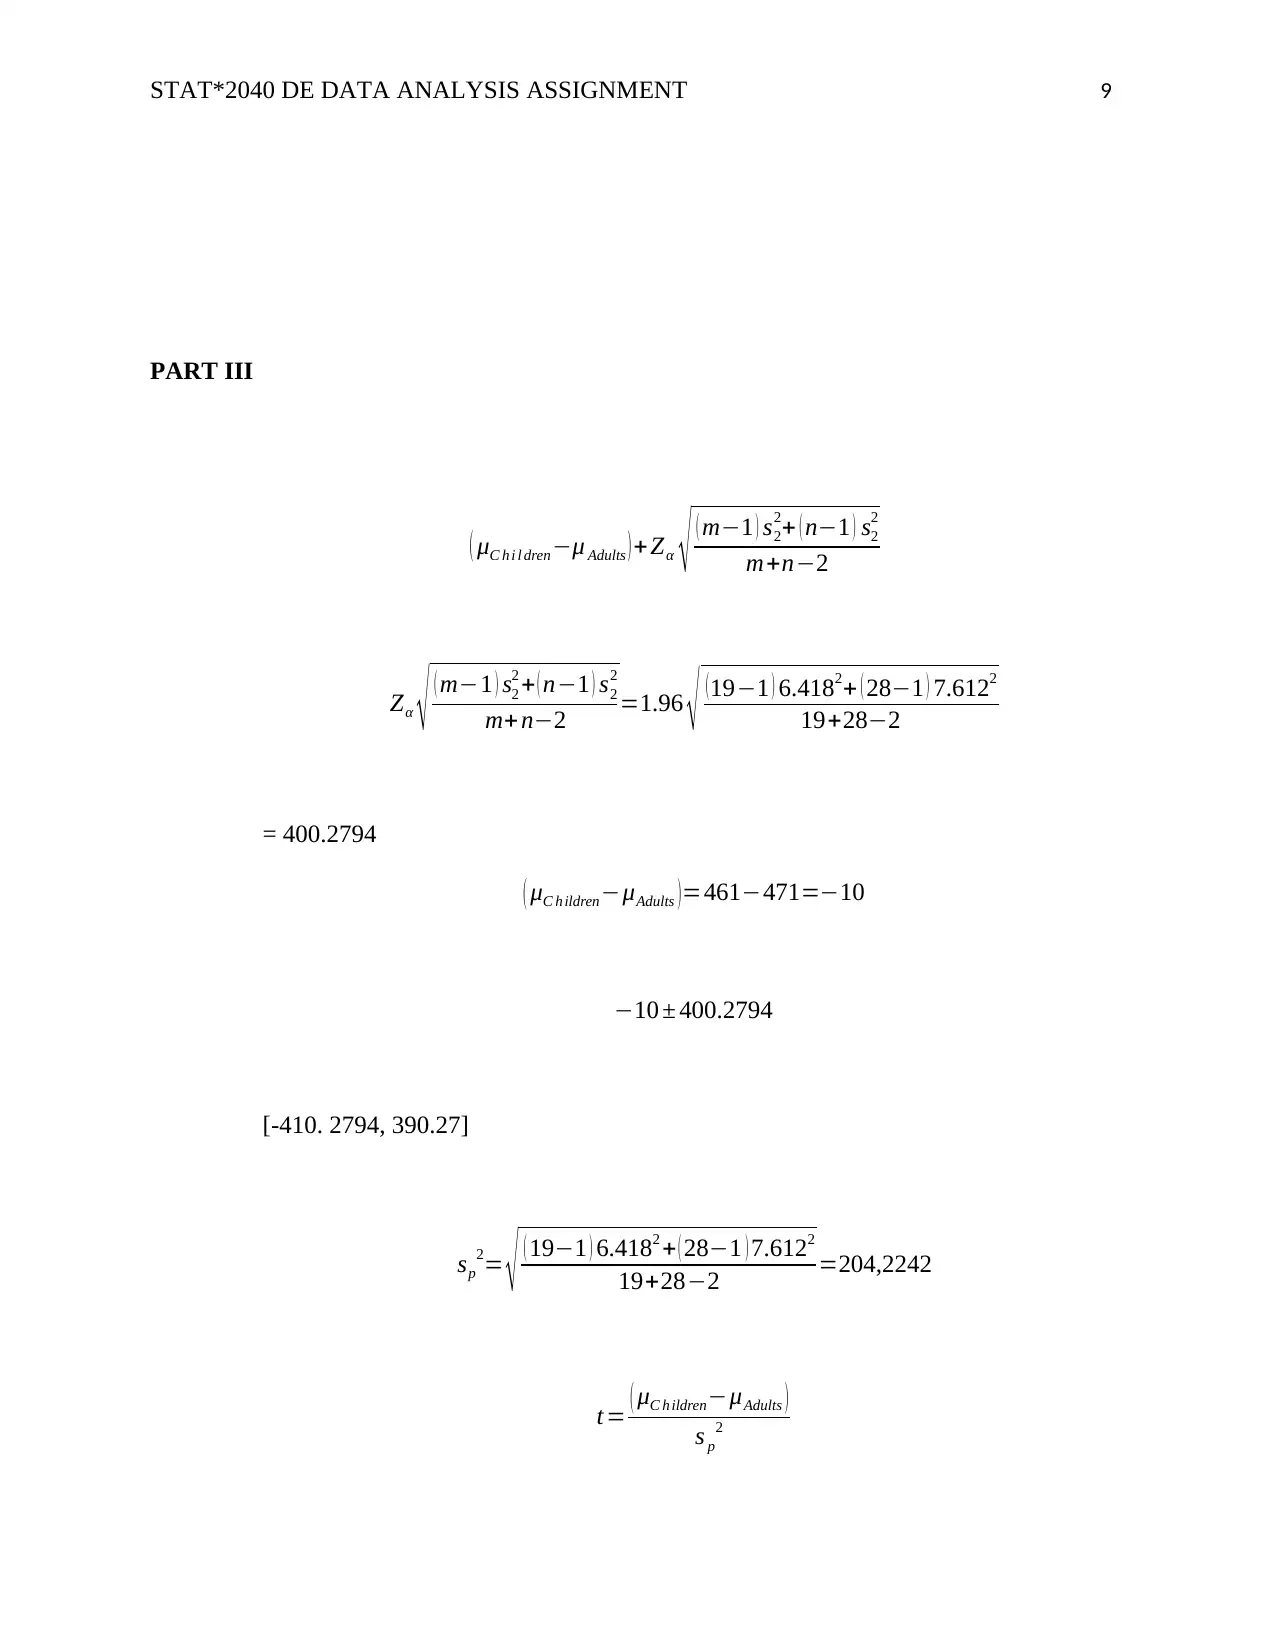
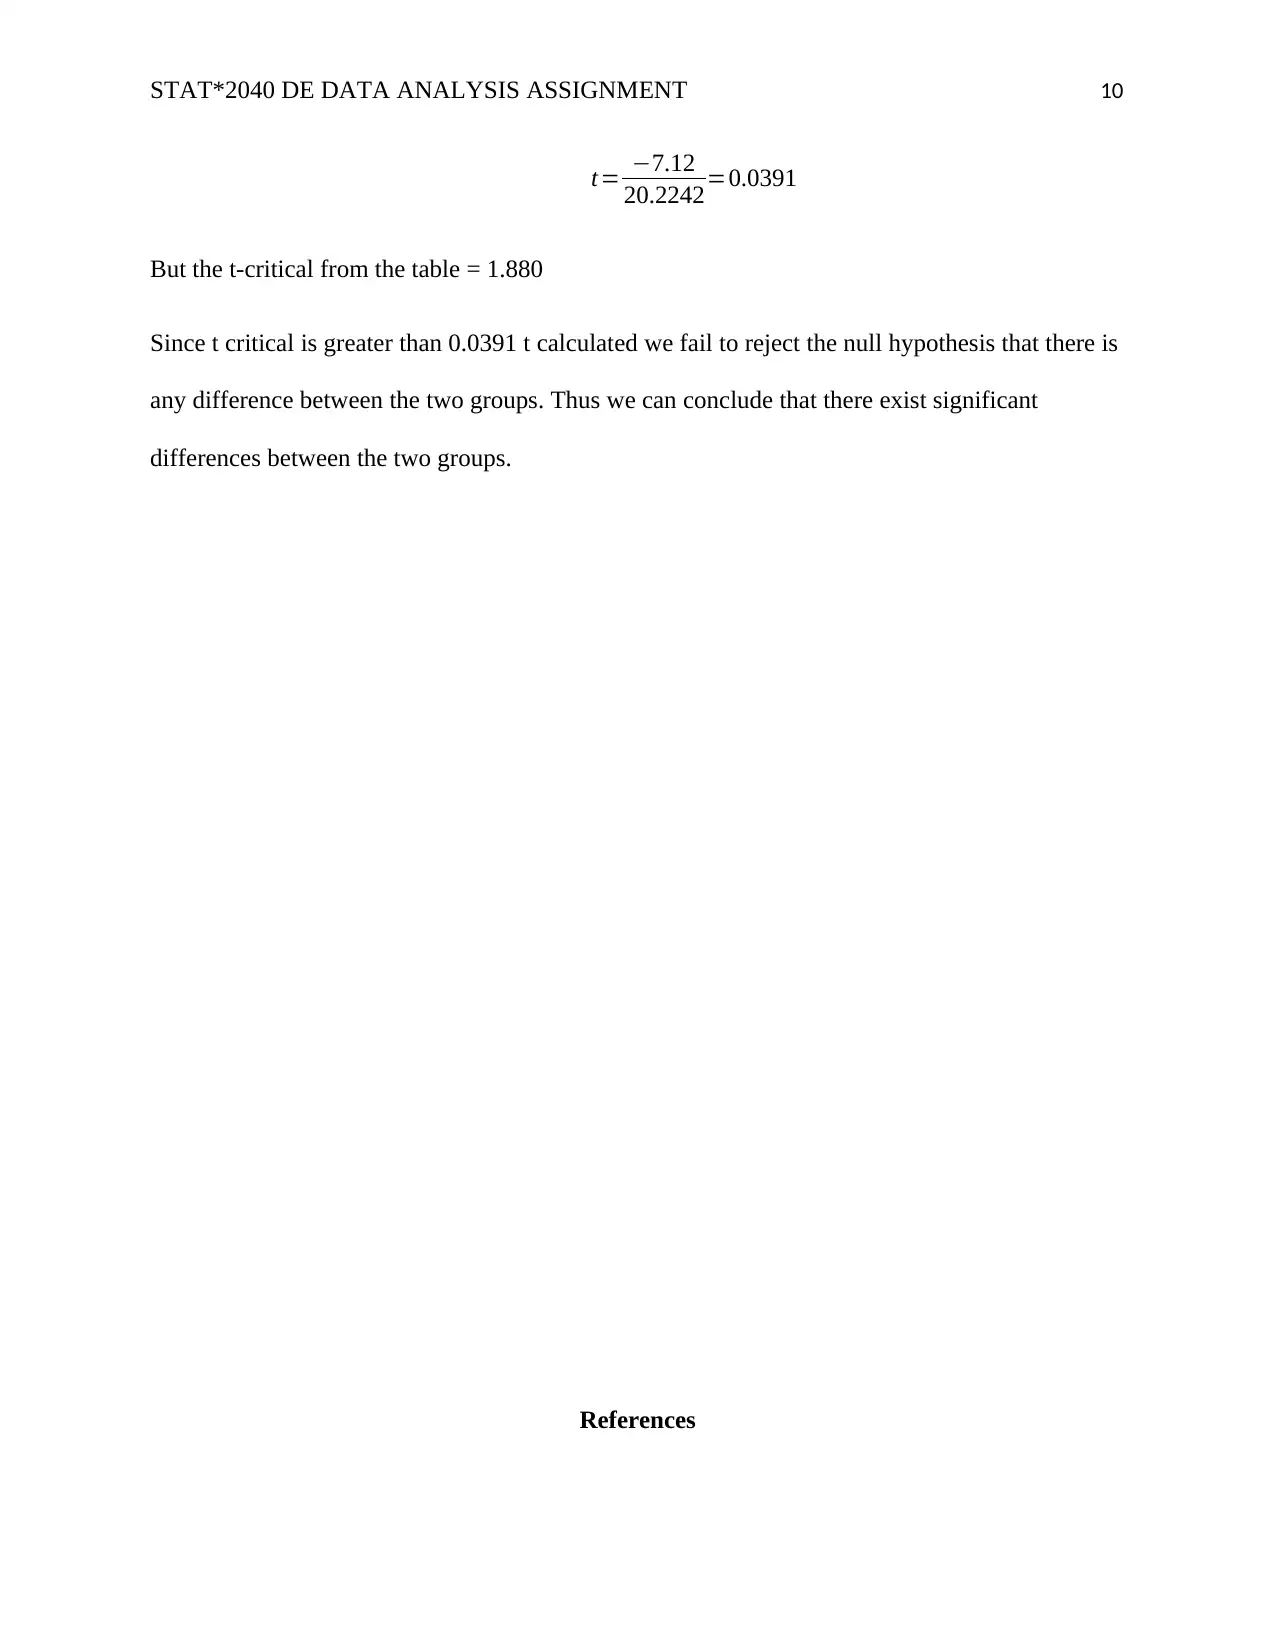
This document presents a solved data analysis assignment for STAT*2040 DE, likely completed in Winter 2019 at the University of Guelph. The assignment is divided into three parts, each involving data analysis and conclusion writing based on published studies. Part I focuses on a one-sample problem, employing a t-test to analyze data, interpret confidence intervals, and conduct hypothesis testing. Part II addresses a two-sample problem, utilizing box plots and Q-Q plots to assess data distribution and applying the Welch test to compare means between European and North American fish populations. Part III involves another two-sample problem, likely comparing data from children and adults, using t-tests and confidence intervals to determine significant differences between the groups. The solution includes R output snippets and references to relevant research articles. Desklib provides access to this and other solved assignments.
1 out of 11
Related Documents


Your All-in-One AI-Powered Toolkit for Academic Success.
+13062052269
info@desklib.com
Available 24*7 on WhatsApp / Email
![[object Object]](/_next/static/media/star-bottom.7253800d.svg)
Copyright © 2020–2026 A2Z Services. All Rights Reserved. Developed and managed by ZUCOL.