Gumboot Throwing WA Finance and Funding Report Analysis
VerifiedAdded on 2022/11/14
|20
|4950
|467
Report
AI Summary
This report provides a comprehensive financial analysis of Gumboot Throwing WA, evaluating its performance based on provided financial statements. The analysis includes an examination of revenue streams, expenses, and various financial ratios such as liquidity, debt-to-equity, and return on assets to assess the organization's financial health. The report also explores the impact of external events, specifically a reduction in grants, on the financial viability and sustainability of the organization, and suggests strategies to mitigate revenue loss. Furthermore, the report includes the development of a detailed budget for a proposed new event, with a rationale for the figures presented, aiming to improve revenue generation and manage operational expenses effectively. The conclusion offers recommendations based on the financial findings.
Running head: SPORT AND EVENTS FUNDING AND FINANCE
Sport, events funding, and finance
Name of the Student:
Name of the University:
Authors Note:
Sport, events funding, and finance
Name of the Student:
Name of the University:
Authors Note:
Paraphrase This Document
Need a fresh take? Get an instant paraphrase of this document with our AI Paraphraser
SPORT, EVENTS FUNDING, AND FINANCE
1
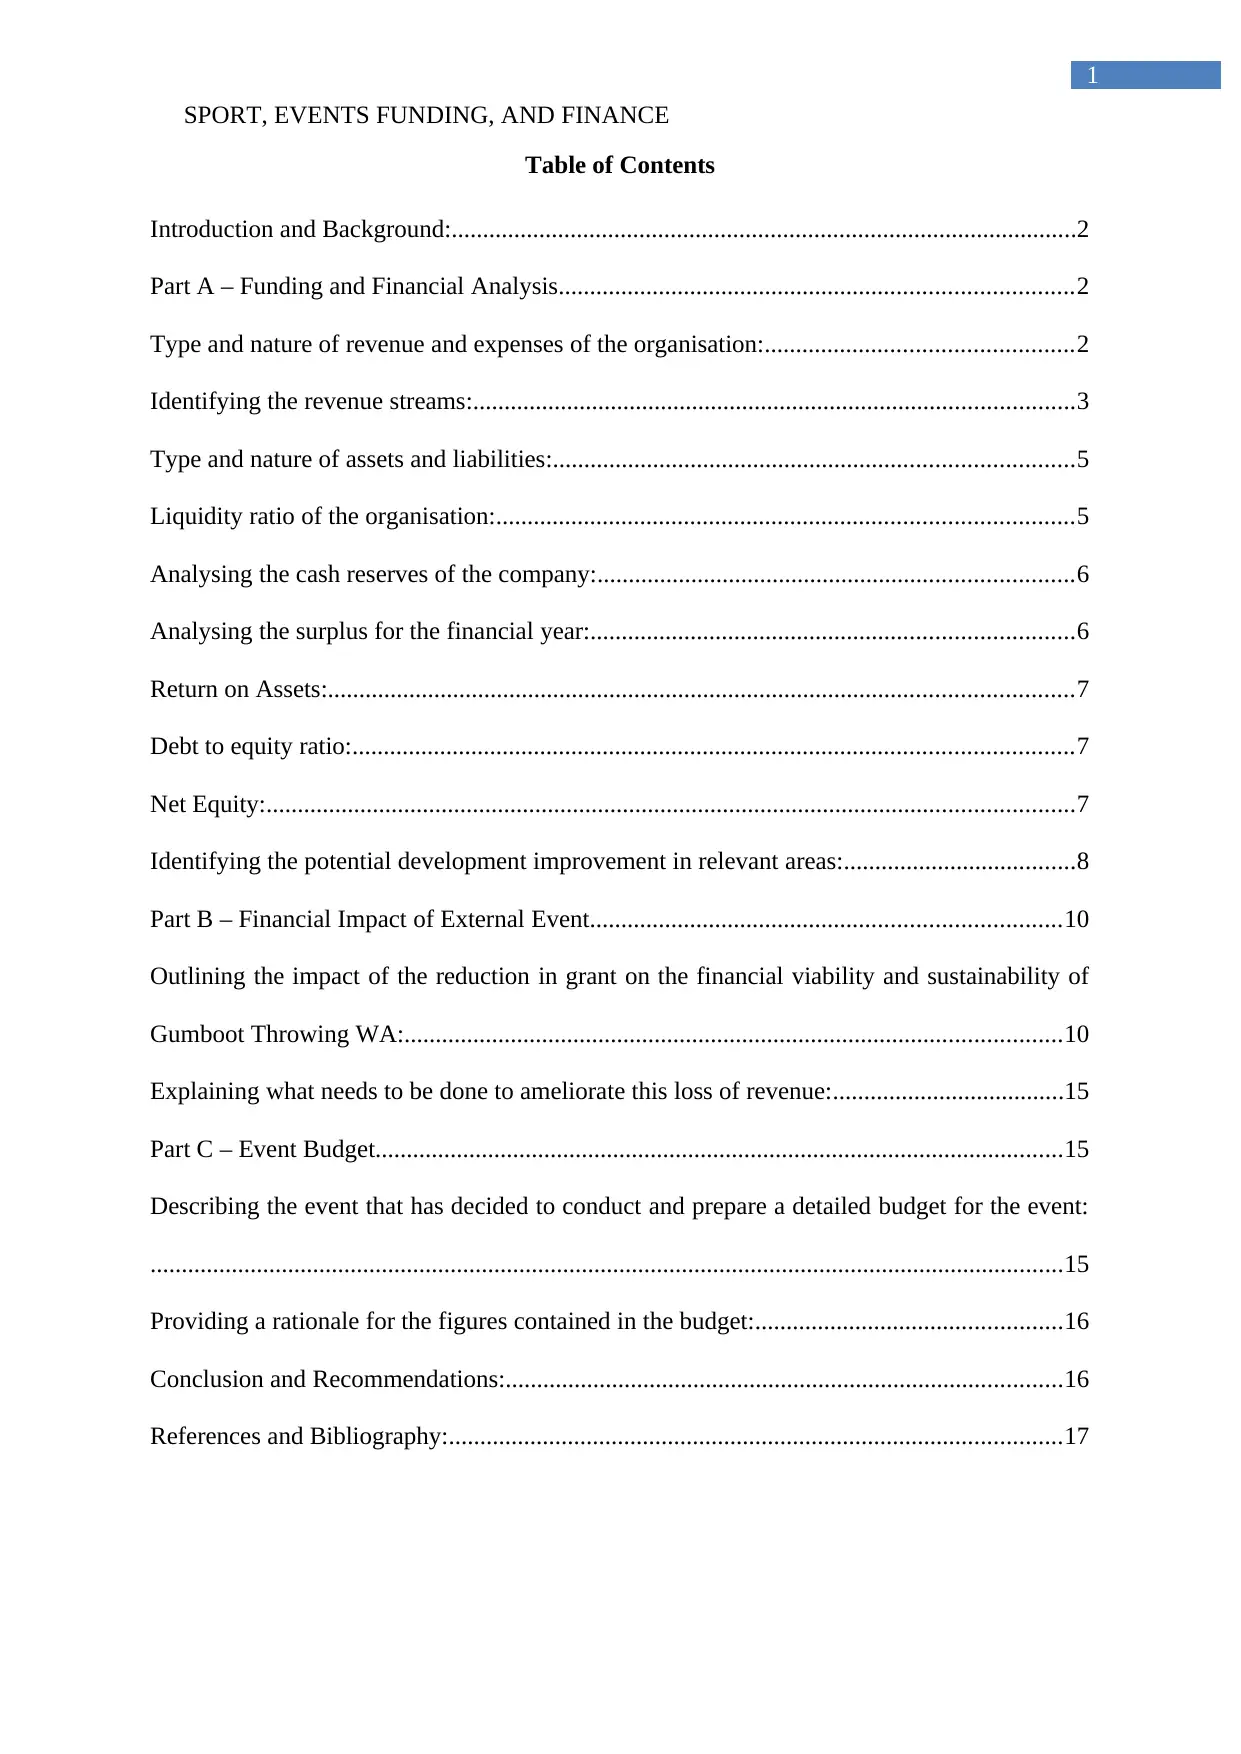
Table of Contents
Introduction and Background:....................................................................................................2
Part A – Funding and Financial Analysis..................................................................................2
Type and nature of revenue and expenses of the organisation:.................................................2
Identifying the revenue streams:................................................................................................3
Type and nature of assets and liabilities:...................................................................................5
Liquidity ratio of the organisation:............................................................................................5
Analysing the cash reserves of the company:............................................................................6
Analysing the surplus for the financial year:.............................................................................6
Return on Assets:.......................................................................................................................7
Debt to equity ratio:...................................................................................................................7
Net Equity:.................................................................................................................................7
Identifying the potential development improvement in relevant areas:.....................................8
Part B – Financial Impact of External Event...........................................................................10
Outlining the impact of the reduction in grant on the financial viability and sustainability of
Gumboot Throwing WA:.........................................................................................................10
Explaining what needs to be done to ameliorate this loss of revenue:.....................................15
Part C – Event Budget..............................................................................................................15
Describing the event that has decided to conduct and prepare a detailed budget for the event:
..................................................................................................................................................15
Providing a rationale for the figures contained in the budget:.................................................16
Conclusion and Recommendations:.........................................................................................16
References and Bibliography:..................................................................................................17
1
Table of Contents
Introduction and Background:....................................................................................................2
Part A – Funding and Financial Analysis..................................................................................2
Type and nature of revenue and expenses of the organisation:.................................................2
Identifying the revenue streams:................................................................................................3
Type and nature of assets and liabilities:...................................................................................5
Liquidity ratio of the organisation:............................................................................................5
Analysing the cash reserves of the company:............................................................................6
Analysing the surplus for the financial year:.............................................................................6
Return on Assets:.......................................................................................................................7
Debt to equity ratio:...................................................................................................................7
Net Equity:.................................................................................................................................7
Identifying the potential development improvement in relevant areas:.....................................8
Part B – Financial Impact of External Event...........................................................................10
Outlining the impact of the reduction in grant on the financial viability and sustainability of
Gumboot Throwing WA:.........................................................................................................10
Explaining what needs to be done to ameliorate this loss of revenue:.....................................15
Part C – Event Budget..............................................................................................................15
Describing the event that has decided to conduct and prepare a detailed budget for the event:
..................................................................................................................................................15
Providing a rationale for the figures contained in the budget:.................................................16
Conclusion and Recommendations:.........................................................................................16
References and Bibliography:..................................................................................................17
SPORT, EVENTS FUNDING, AND FINANCE
2
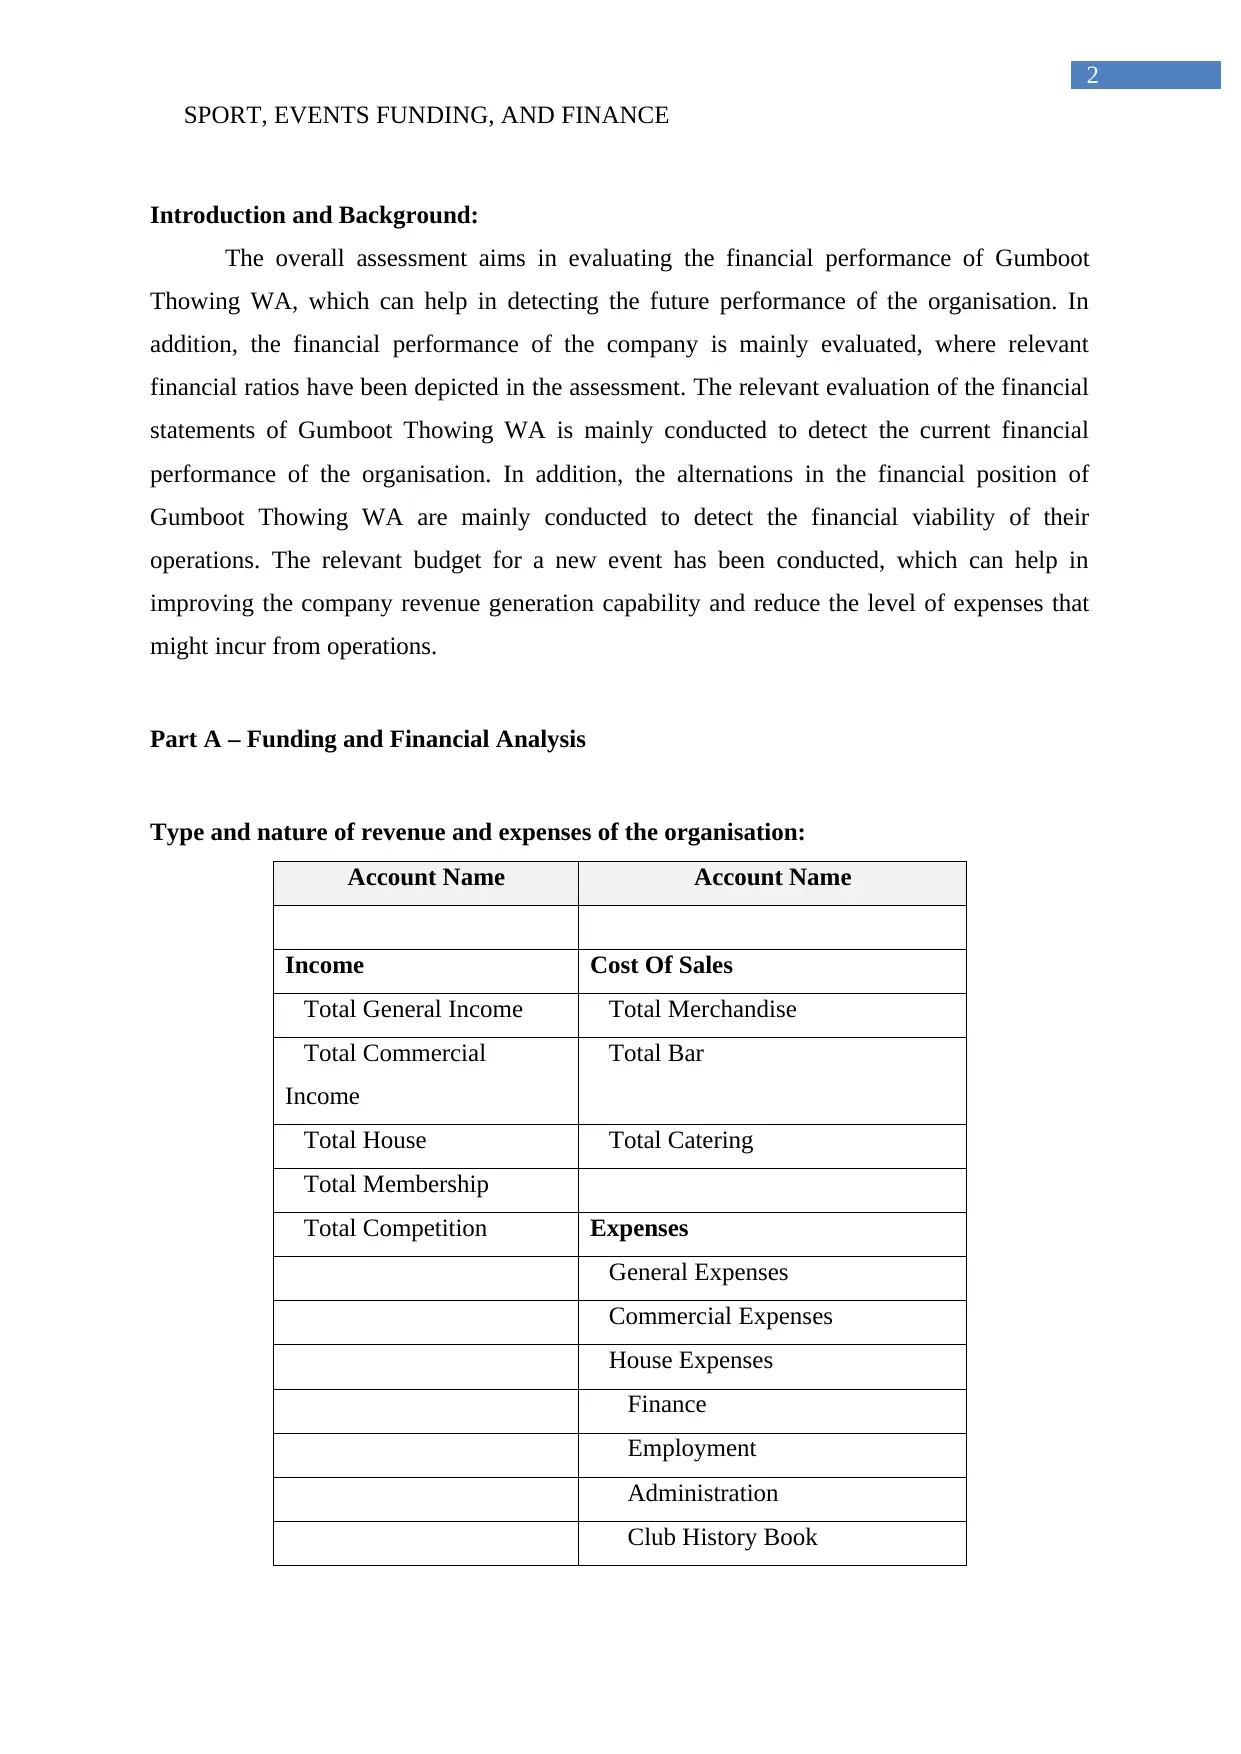
Introduction and Background:
The overall assessment aims in evaluating the financial performance of Gumboot
Thowing WA, which can help in detecting the future performance of the organisation. In
addition, the financial performance of the company is mainly evaluated, where relevant
financial ratios have been depicted in the assessment. The relevant evaluation of the financial
statements of Gumboot Thowing WA is mainly conducted to detect the current financial
performance of the organisation. In addition, the alternations in the financial position of
Gumboot Thowing WA are mainly conducted to detect the financial viability of their
operations. The relevant budget for a new event has been conducted, which can help in
improving the company revenue generation capability and reduce the level of expenses that
might incur from operations.
Part A – Funding and Financial Analysis
Type and nature of revenue and expenses of the organisation:
Account Name Account Name
Income Cost Of Sales
Total General Income Total Merchandise
Total Commercial
Income
Total Bar
Total House Total Catering
Total Membership
Total Competition Expenses
General Expenses
Commercial Expenses
House Expenses
Finance
Employment
Administration
Club History Book
2
Introduction and Background:
The overall assessment aims in evaluating the financial performance of Gumboot
Thowing WA, which can help in detecting the future performance of the organisation. In
addition, the financial performance of the company is mainly evaluated, where relevant
financial ratios have been depicted in the assessment. The relevant evaluation of the financial
statements of Gumboot Thowing WA is mainly conducted to detect the current financial
performance of the organisation. In addition, the alternations in the financial position of
Gumboot Thowing WA are mainly conducted to detect the financial viability of their
operations. The relevant budget for a new event has been conducted, which can help in
improving the company revenue generation capability and reduce the level of expenses that
might incur from operations.
Part A – Funding and Financial Analysis
Type and nature of revenue and expenses of the organisation:
Account Name Account Name
Income Cost Of Sales
Total General Income Total Merchandise
Total Commercial
Income
Total Bar
Total House Total Catering
Total Membership
Total Competition Expenses
General Expenses
Commercial Expenses
House Expenses
Finance
Employment
Administration
Club History Book
⊘ This is a preview!⊘
Do you want full access?
Subscribe today to unlock all pages.
Trusted by 1+ million students worldwide
SPORT, EVENTS FUNDING, AND FINANCE
3
Building & Utilities
State and National Championships
The above table provides information about the overall revenue and expenses of your
organisation, which is listed in in income statement. From the relevant analysis, it could be
identified that the overall income of the organisation is relatively coming from 5 different
types of accounts. The company has been generating income from general income,
commercial income, house, membership, and competition. These are the major income
sources of the organisation, which has allowed them to secure the level of income from
investment (Ratten, 2016). Moreover, the above table also provides information about the
overall cost of sales and expenses that is incurred by the organization during the financial
years. From the analysis it is detected that the company encodes the cost of sales at are
Merchandise cost, bar cost, and Catering cost, as it is helpful for supporting the relevant
operations of the organization. Similar instance it could be identified that there are relevant
expenses that needs to be conducted by the organization to effectively conducted operations
throughout the financial. the relevant Cash outflows that are conducted by the organization
are general expenses, commercial expenses, how the expenses, finance cost, employment
expenses, administration expenses, club history book expenses, building & utility expenses,
State and National championship expenses.
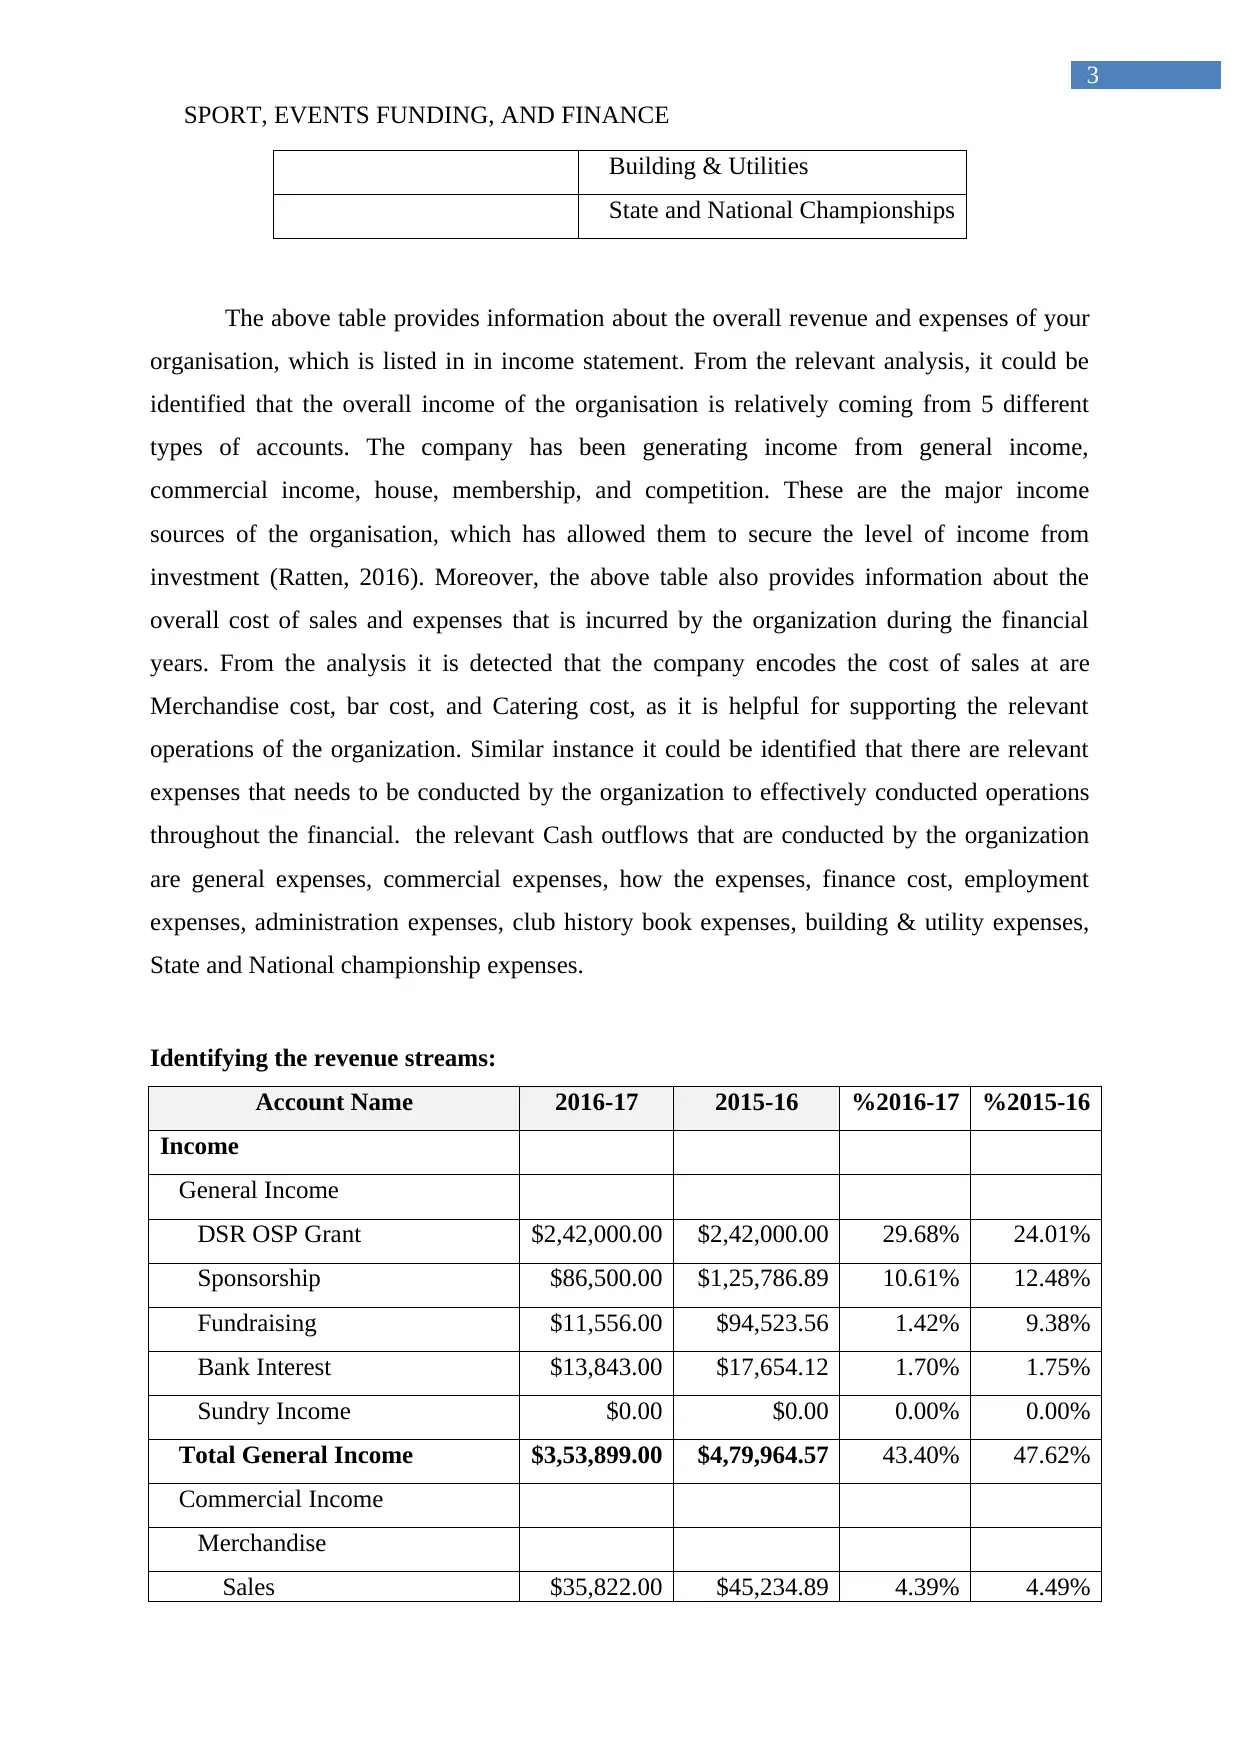
Identifying the revenue streams:
Account Name 2016-17 2015-16 %2016-17 %2015-16
Income
General Income
DSR OSP Grant $2,42,000.00 $2,42,000.00 29.68% 24.01%
Sponsorship $86,500.00 $1,25,786.89 10.61% 12.48%
Fundraising $11,556.00 $94,523.56 1.42% 9.38%
Bank Interest $13,843.00 $17,654.12 1.70% 1.75%
Sundry Income $0.00 $0.00 0.00% 0.00%
Total General Income $3,53,899.00 $4,79,964.57 43.40% 47.62%
Commercial Income
Merchandise
Sales $35,822.00 $45,234.89 4.39% 4.49%
3
Building & Utilities
State and National Championships
The above table provides information about the overall revenue and expenses of your
organisation, which is listed in in income statement. From the relevant analysis, it could be
identified that the overall income of the organisation is relatively coming from 5 different
types of accounts. The company has been generating income from general income,
commercial income, house, membership, and competition. These are the major income
sources of the organisation, which has allowed them to secure the level of income from
investment (Ratten, 2016). Moreover, the above table also provides information about the
overall cost of sales and expenses that is incurred by the organization during the financial
years. From the analysis it is detected that the company encodes the cost of sales at are
Merchandise cost, bar cost, and Catering cost, as it is helpful for supporting the relevant
operations of the organization. Similar instance it could be identified that there are relevant
expenses that needs to be conducted by the organization to effectively conducted operations
throughout the financial. the relevant Cash outflows that are conducted by the organization
are general expenses, commercial expenses, how the expenses, finance cost, employment
expenses, administration expenses, club history book expenses, building & utility expenses,
State and National championship expenses.
Identifying the revenue streams:
Account Name 2016-17 2015-16 %2016-17 %2015-16
Income
General Income
DSR OSP Grant $2,42,000.00 $2,42,000.00 29.68% 24.01%
Sponsorship $86,500.00 $1,25,786.89 10.61% 12.48%
Fundraising $11,556.00 $94,523.56 1.42% 9.38%
Bank Interest $13,843.00 $17,654.12 1.70% 1.75%
Sundry Income $0.00 $0.00 0.00% 0.00%
Total General Income $3,53,899.00 $4,79,964.57 43.40% 47.62%
Commercial Income
Merchandise
Sales $35,822.00 $45,234.89 4.39% 4.49%
Paraphrase This Document
Need a fresh take? Get an instant paraphrase of this document with our AI Paraphraser
SPORT, EVENTS FUNDING, AND FINANCE
4
Rebate on sales $0.00 $0.00 0.00% 0.00%
Total Merchandise $35,822.00 $45,234.89 4.39% 4.49%
Rental Income $40,000.00 $40,000.00 4.91% 3.97%
Venue Hire $3,300.00 $3,300.00 0.40% 0.33%
Paddock Hire $4,536.00 $3,456.78 0.56% 0.34%
Commercial Training
Course Income $15,600.00 $34,234.89 1.91% 3.40%
High Schools Course
Income
$1,22,234.00 $1,34,234.76 14.99% 13.32%
Total Commercial Training $1,37,834.00 $1,68,469.65 16.90% 16.72%
Total Commercial Income $2,21,492.00 $2,60,461.32 27.16% 25.84%
House
Bar
Bar - Club Functions $16,000.00 $17,890.78 1.96% 1.78%
Bar - External Functions $5,954.00 $4,567.89 0.73% 0.45%
Total Bar $21,954.00 $22,458.67 2.69% 2.23%
Catering
Catering - Club Functions $0.00 $0.00 0.00% 0.00%
Catering - External
Functions
$0.00 $0.00 0.00% 0.00%
Total Catering $0.00 $0.00 0.00% 0.00%
Ticket Sales $22,323.00 $68,897.45 2.74% 6.84%
Total House $44,277.00 $91,356.12 5.43% 9.06%
Membership
Membership Fees $1,23,232.00 $1,12,345.76 15.11% 11.15%
Member Donations $13,260.00 $15,456.78 1.63% 1.53%
Gumboot Storage Rack Hire $9,200.00 $9,200.00 1.13% 0.91%
Total Membership $1,45,692.00 $1,37,002.54 17.87% 13.59%
Competition
Entry Fees $27,567.00 $18,654.56 3.38% 1.85%
Parking $13,260.00 $11,234.45 1.63% 1.11%
BBQ $9,200.00 $9,200.00 1.13% 0.91%
SPORT, EVENTS FUNDING, AND FINANCE
5
Total Competition $50,027.00 $39,089.01 6.14% 3.88%
Total Gross income $8,15,387.00 $10,07,873.5
6
100.00% 100.00%
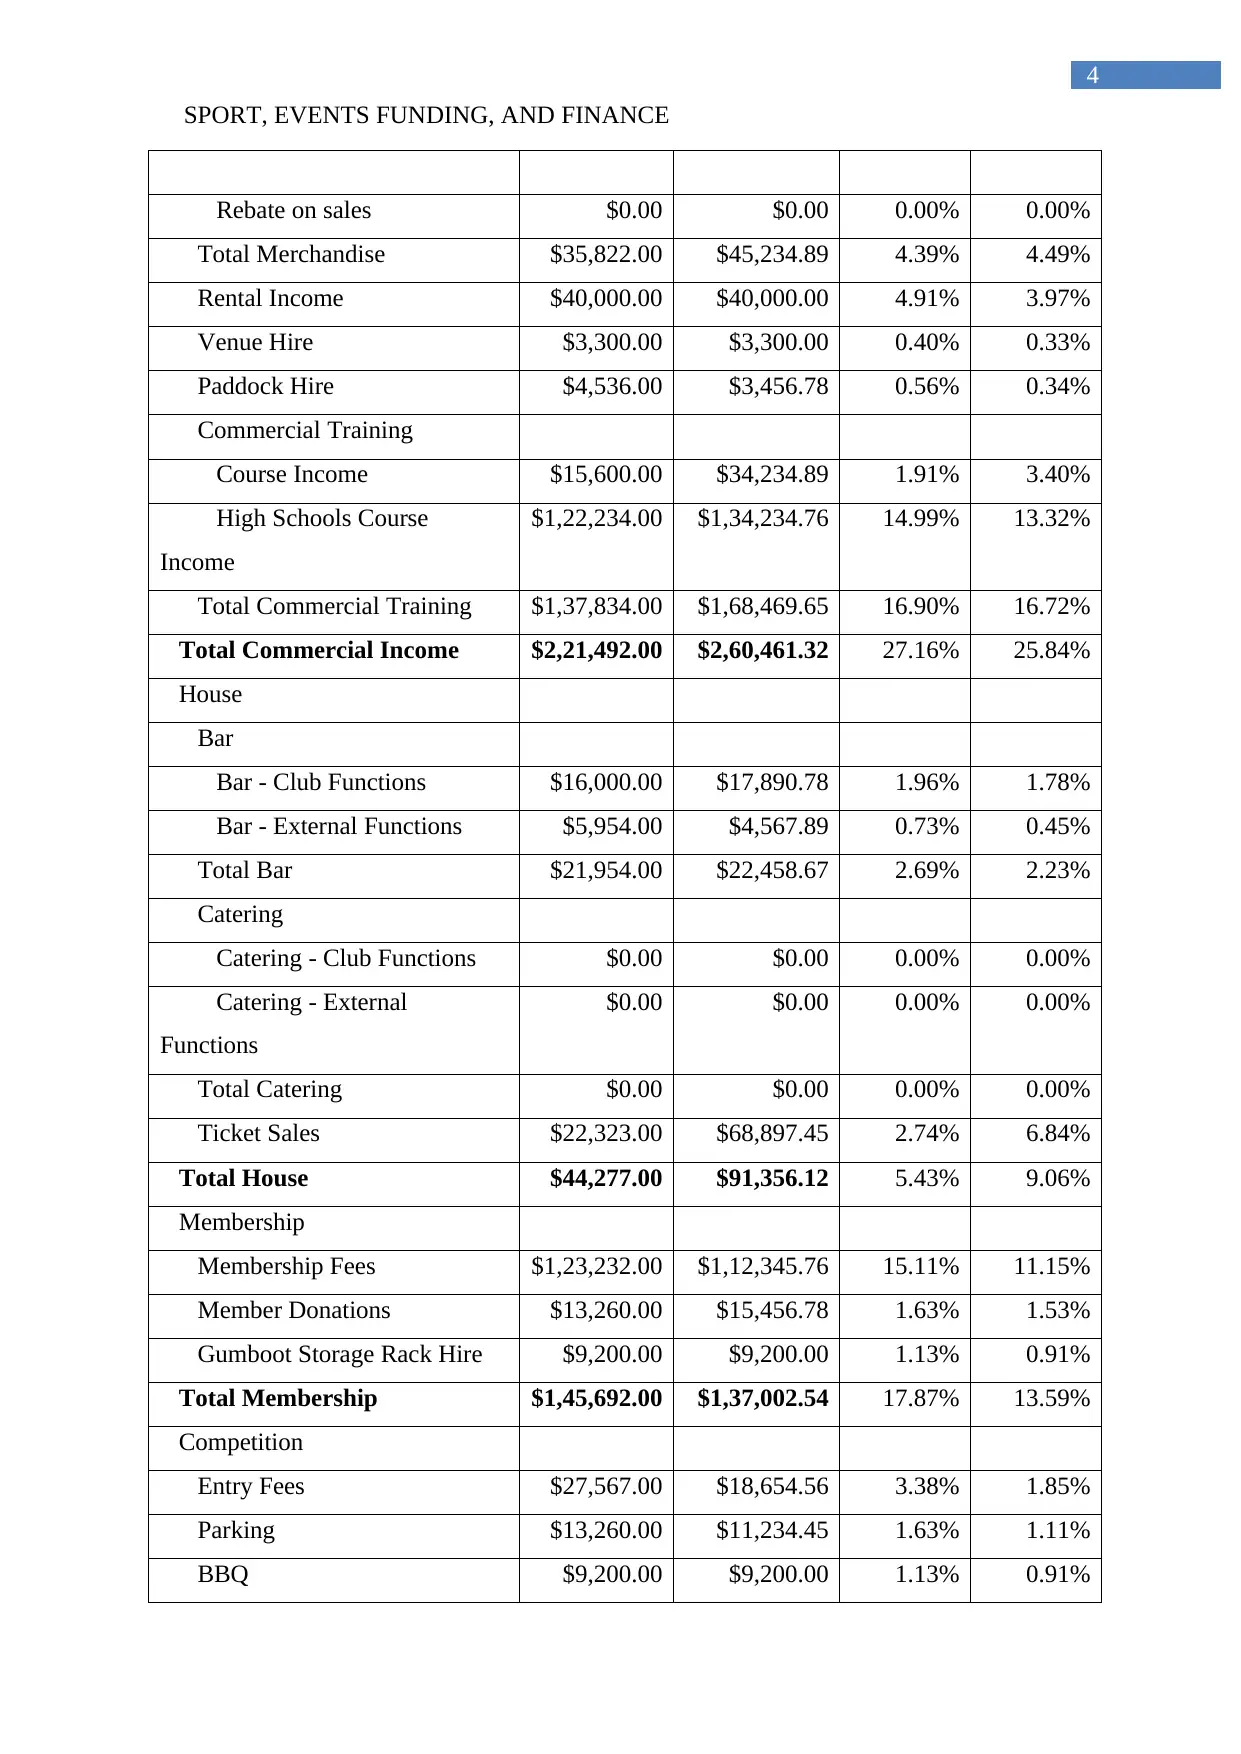
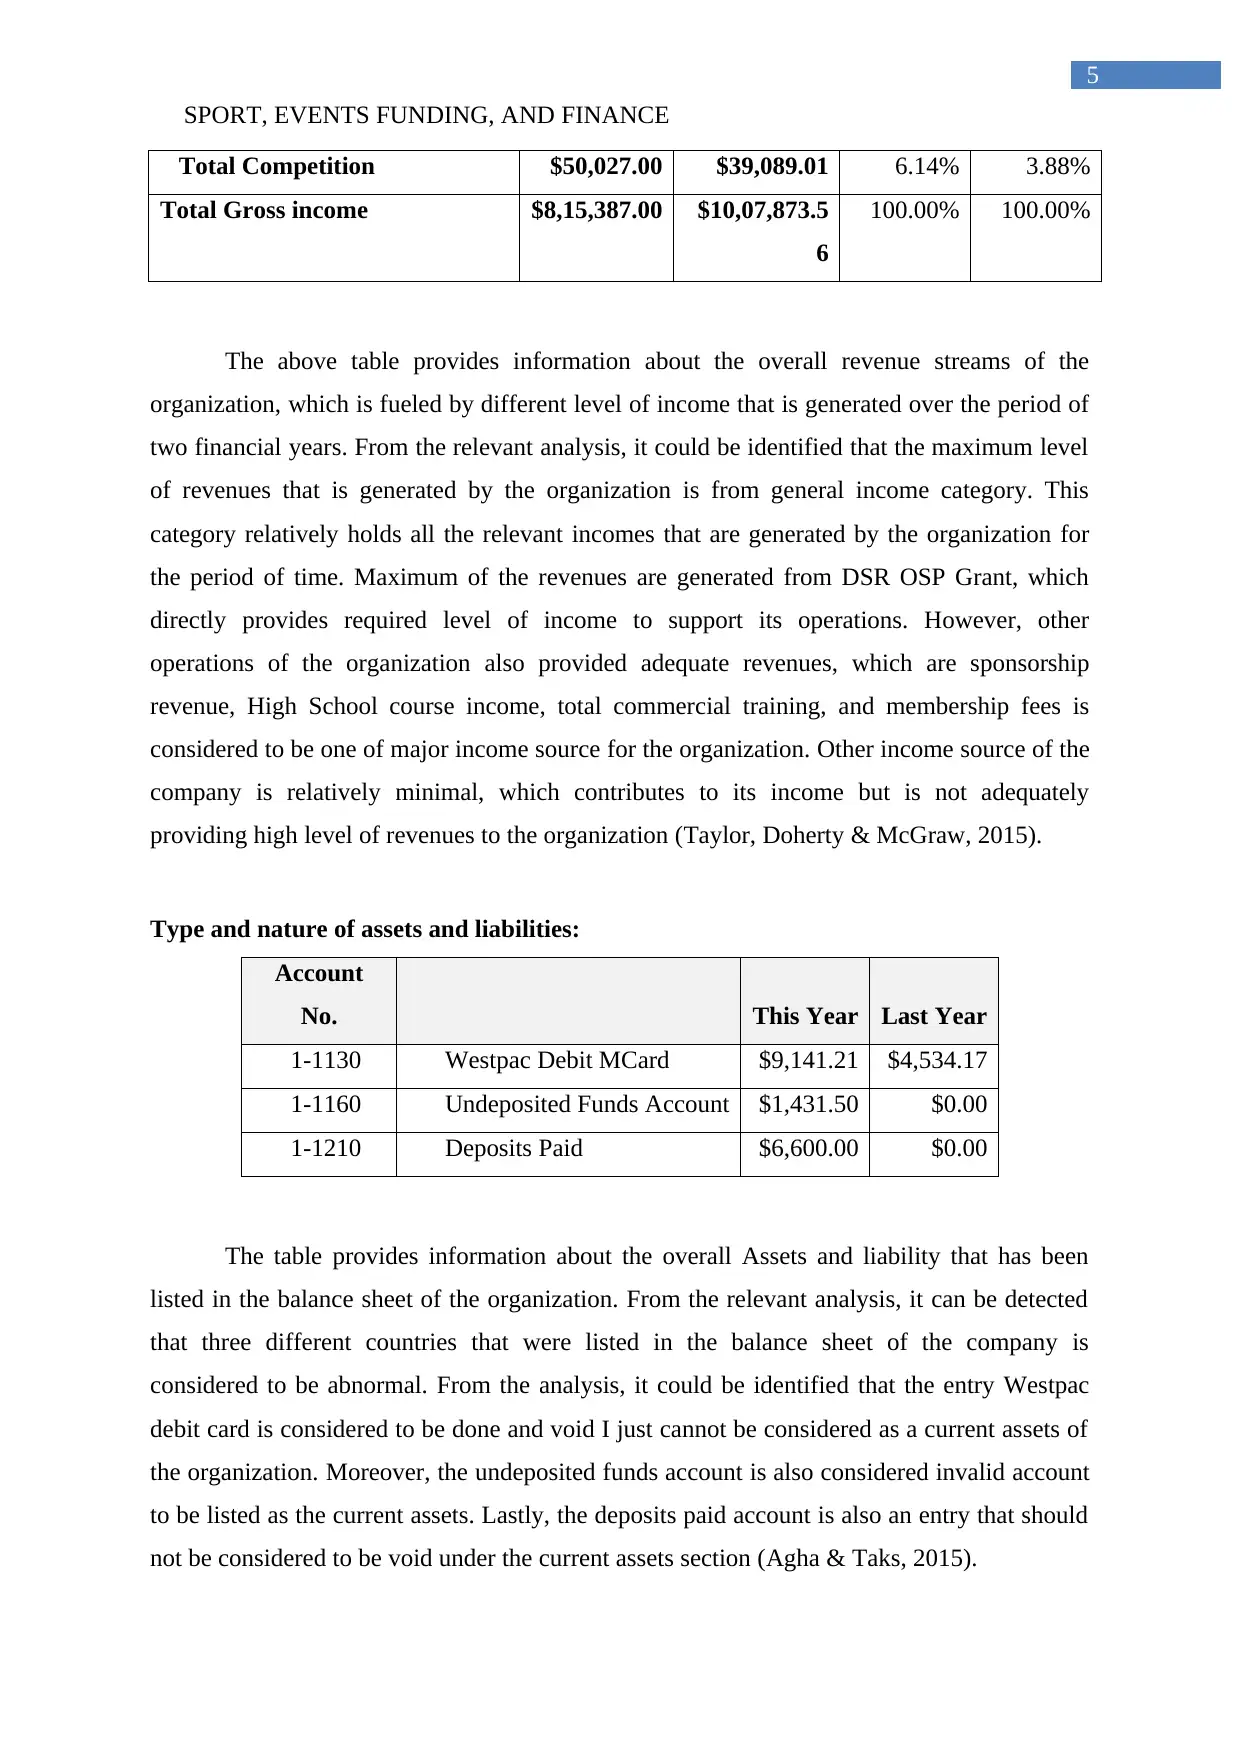
The above table provides information about the overall revenue streams of the
organization, which is fueled by different level of income that is generated over the period of
two financial years. From the relevant analysis, it could be identified that the maximum level
of revenues that is generated by the organization is from general income category. This
category relatively holds all the relevant incomes that are generated by the organization for
the period of time. Maximum of the revenues are generated from DSR OSP Grant, which
directly provides required level of income to support its operations. However, other
operations of the organization also provided adequate revenues, which are sponsorship
revenue, High School course income, total commercial training, and membership fees is
considered to be one of major income source for the organization. Other income source of the
company is relatively minimal, which contributes to its income but is not adequately
providing high level of revenues to the organization (Taylor, Doherty & McGraw, 2015).
Type and nature of assets and liabilities:
Account
No. This Year Last Year
1-1130 Westpac Debit MCard $9,141.21 $4,534.17
1-1160 Undeposited Funds Account $1,431.50 $0.00
1-1210 Deposits Paid $6,600.00 $0.00
The table provides information about the overall Assets and liability that has been
listed in the balance sheet of the organization. From the relevant analysis, it can be detected
that three different countries that were listed in the balance sheet of the company is
considered to be abnormal. From the analysis, it could be identified that the entry Westpac
debit card is considered to be done and void I just cannot be considered as a current assets of
the organization. Moreover, the undeposited funds account is also considered invalid account
to be listed as the current assets. Lastly, the deposits paid account is also an entry that should
not be considered to be void under the current assets section (Agha & Taks, 2015).
5
Total Competition $50,027.00 $39,089.01 6.14% 3.88%
Total Gross income $8,15,387.00 $10,07,873.5
6
100.00% 100.00%
The above table provides information about the overall revenue streams of the
organization, which is fueled by different level of income that is generated over the period of
two financial years. From the relevant analysis, it could be identified that the maximum level
of revenues that is generated by the organization is from general income category. This
category relatively holds all the relevant incomes that are generated by the organization for
the period of time. Maximum of the revenues are generated from DSR OSP Grant, which
directly provides required level of income to support its operations. However, other
operations of the organization also provided adequate revenues, which are sponsorship
revenue, High School course income, total commercial training, and membership fees is
considered to be one of major income source for the organization. Other income source of the
company is relatively minimal, which contributes to its income but is not adequately
providing high level of revenues to the organization (Taylor, Doherty & McGraw, 2015).
Type and nature of assets and liabilities:
Account
No. This Year Last Year
1-1130 Westpac Debit MCard $9,141.21 $4,534.17
1-1160 Undeposited Funds Account $1,431.50 $0.00
1-1210 Deposits Paid $6,600.00 $0.00
The table provides information about the overall Assets and liability that has been
listed in the balance sheet of the organization. From the relevant analysis, it can be detected
that three different countries that were listed in the balance sheet of the company is
considered to be abnormal. From the analysis, it could be identified that the entry Westpac
debit card is considered to be done and void I just cannot be considered as a current assets of
the organization. Moreover, the undeposited funds account is also considered invalid account
to be listed as the current assets. Lastly, the deposits paid account is also an entry that should
not be considered to be void under the current assets section (Agha & Taks, 2015).
⊘ This is a preview!⊘
Do you want full access?
Subscribe today to unlock all pages.
Trusted by 1+ million students worldwide
SPORT, EVENTS FUNDING, AND FINANCE
6
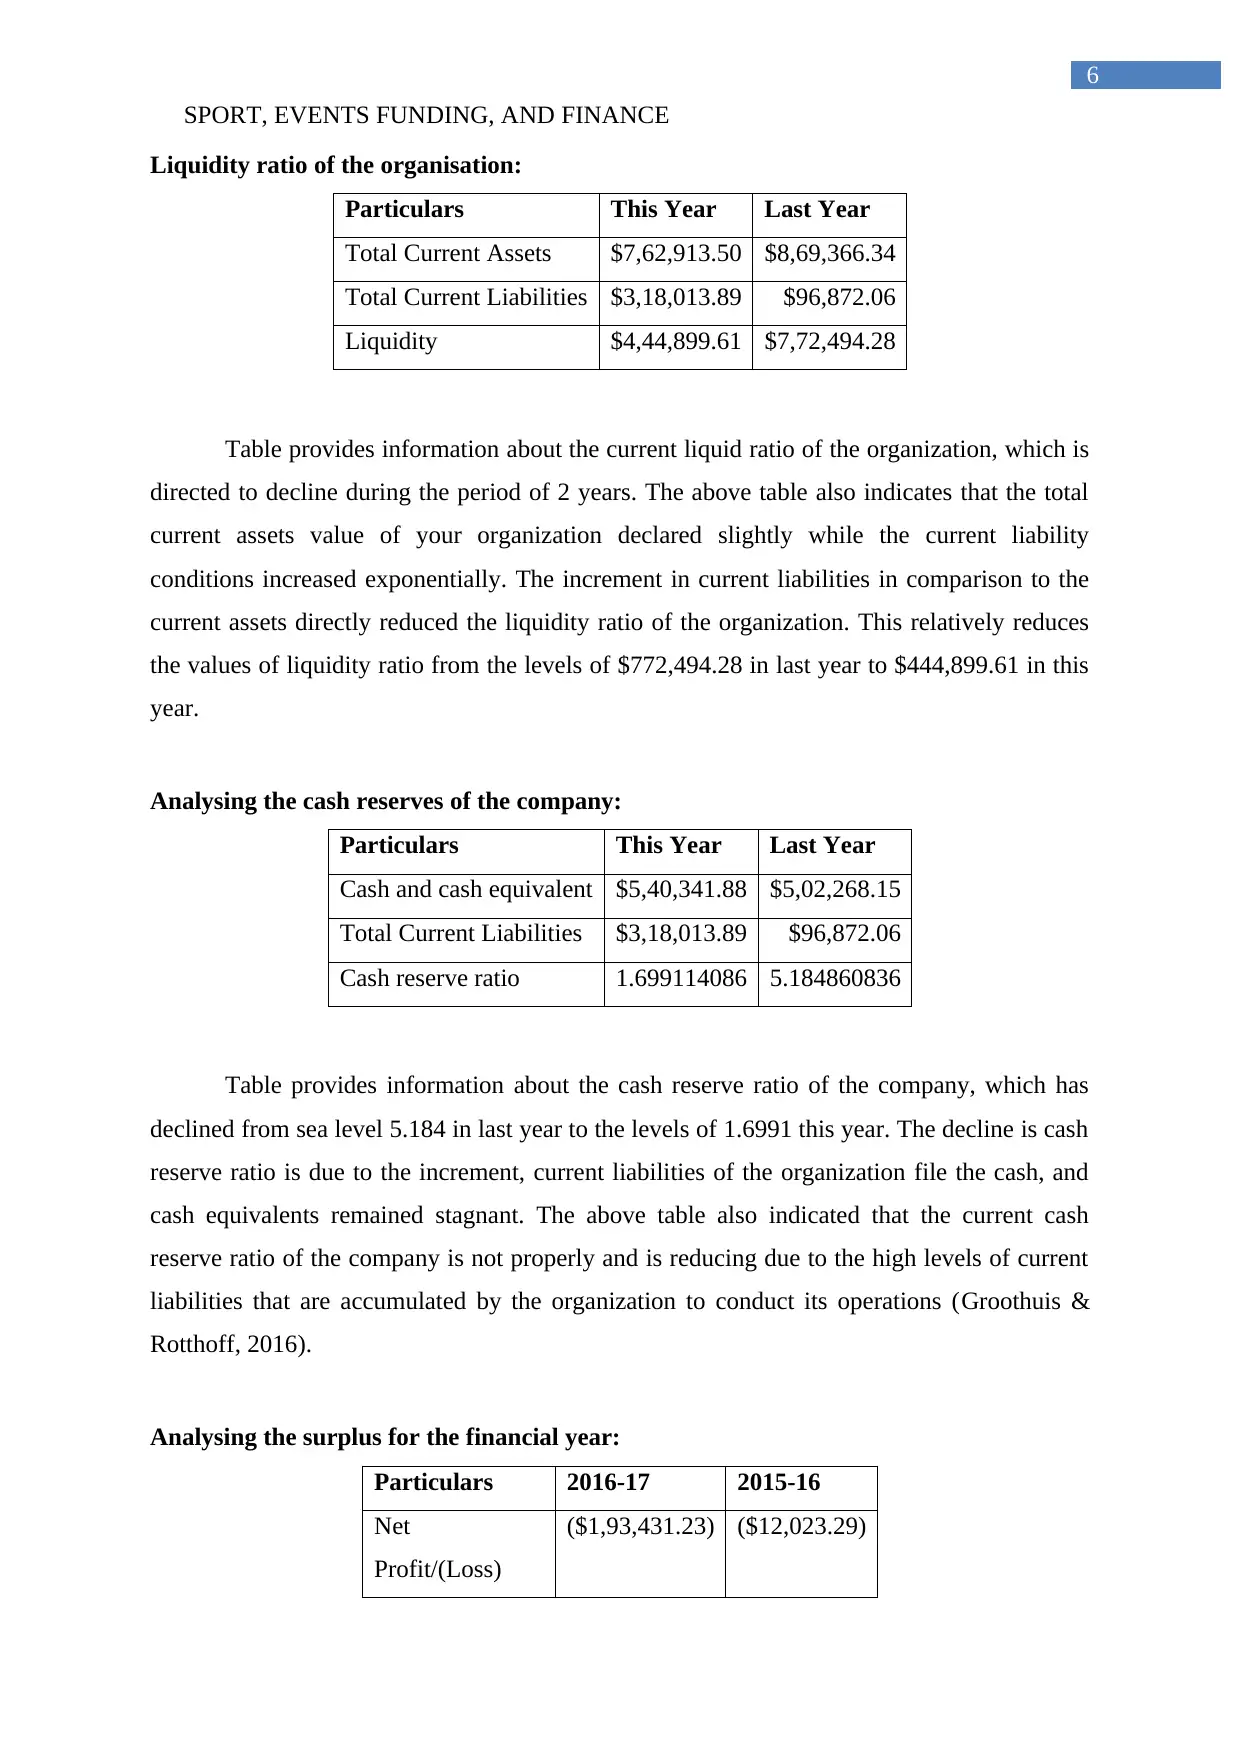
Liquidity ratio of the organisation:
Particulars This Year Last Year
Total Current Assets $7,62,913.50 $8,69,366.34
Total Current Liabilities $3,18,013.89 $96,872.06
Liquidity $4,44,899.61 $7,72,494.28
Table provides information about the current liquid ratio of the organization, which is
directed to decline during the period of 2 years. The above table also indicates that the total
current assets value of your organization declared slightly while the current liability
conditions increased exponentially. The increment in current liabilities in comparison to the
current assets directly reduced the liquidity ratio of the organization. This relatively reduces
the values of liquidity ratio from the levels of $772,494.28 in last year to $444,899.61 in this
year.
Analysing the cash reserves of the company:
Particulars This Year Last Year
Cash and cash equivalent $5,40,341.88 $5,02,268.15
Total Current Liabilities $3,18,013.89 $96,872.06
Cash reserve ratio 1.699114086 5.184860836
Table provides information about the cash reserve ratio of the company, which has
declined from sea level 5.184 in last year to the levels of 1.6991 this year. The decline is cash
reserve ratio is due to the increment, current liabilities of the organization file the cash, and
cash equivalents remained stagnant. The above table also indicated that the current cash
reserve ratio of the company is not properly and is reducing due to the high levels of current
liabilities that are accumulated by the organization to conduct its operations (Groothuis &
Rotthoff, 2016).
Analysing the surplus for the financial year:
Particulars 2016-17 2015-16
Net
Profit/(Loss)
($1,93,431.23) ($12,023.29)
6
Liquidity ratio of the organisation:
Particulars This Year Last Year
Total Current Assets $7,62,913.50 $8,69,366.34
Total Current Liabilities $3,18,013.89 $96,872.06
Liquidity $4,44,899.61 $7,72,494.28
Table provides information about the current liquid ratio of the organization, which is
directed to decline during the period of 2 years. The above table also indicates that the total
current assets value of your organization declared slightly while the current liability
conditions increased exponentially. The increment in current liabilities in comparison to the
current assets directly reduced the liquidity ratio of the organization. This relatively reduces
the values of liquidity ratio from the levels of $772,494.28 in last year to $444,899.61 in this
year.
Analysing the cash reserves of the company:
Particulars This Year Last Year
Cash and cash equivalent $5,40,341.88 $5,02,268.15
Total Current Liabilities $3,18,013.89 $96,872.06
Cash reserve ratio 1.699114086 5.184860836
Table provides information about the cash reserve ratio of the company, which has
declined from sea level 5.184 in last year to the levels of 1.6991 this year. The decline is cash
reserve ratio is due to the increment, current liabilities of the organization file the cash, and
cash equivalents remained stagnant. The above table also indicated that the current cash
reserve ratio of the company is not properly and is reducing due to the high levels of current
liabilities that are accumulated by the organization to conduct its operations (Groothuis &
Rotthoff, 2016).
Analysing the surplus for the financial year:
Particulars 2016-17 2015-16
Net
Profit/(Loss)
($1,93,431.23) ($12,023.29)
Paraphrase This Document
Need a fresh take? Get an instant paraphrase of this document with our AI Paraphraser
SPORT, EVENTS FUNDING, AND FINANCE
7
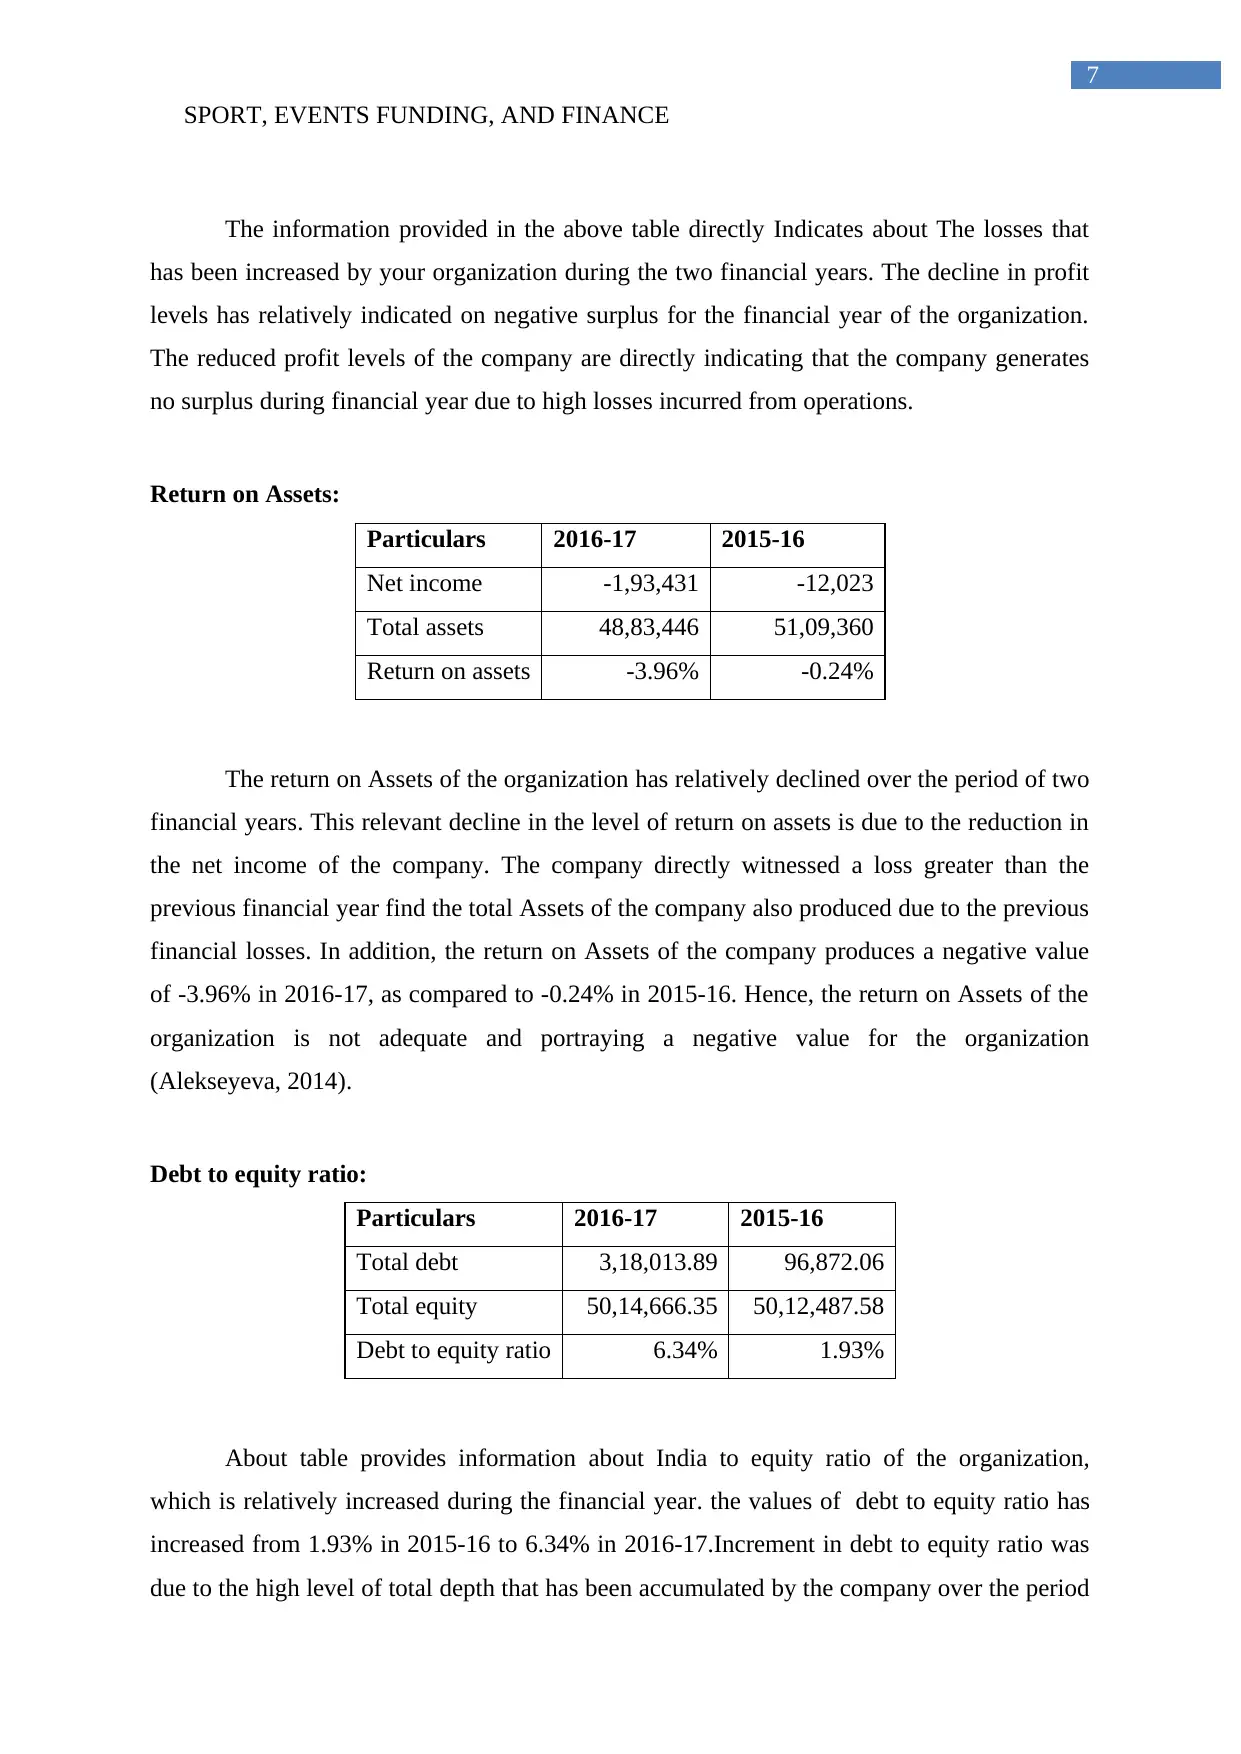
The information provided in the above table directly Indicates about The losses that
has been increased by your organization during the two financial years. The decline in profit
levels has relatively indicated on negative surplus for the financial year of the organization.
The reduced profit levels of the company are directly indicating that the company generates
no surplus during financial year due to high losses incurred from operations.
Return on Assets:
Particulars 2016-17 2015-16
Net income -1,93,431 -12,023
Total assets 48,83,446 51,09,360
Return on assets -3.96% -0.24%
The return on Assets of the organization has relatively declined over the period of two
financial years. This relevant decline in the level of return on assets is due to the reduction in
the net income of the company. The company directly witnessed a loss greater than the
previous financial year find the total Assets of the company also produced due to the previous
financial losses. In addition, the return on Assets of the company produces a negative value
of -3.96% in 2016-17, as compared to -0.24% in 2015-16. Hence, the return on Assets of the
organization is not adequate and portraying a negative value for the organization
(Alekseyeva, 2014).
Debt to equity ratio:
Particulars 2016-17 2015-16
Total debt 3,18,013.89 96,872.06
Total equity 50,14,666.35 50,12,487.58
Debt to equity ratio 6.34% 1.93%
About table provides information about India to equity ratio of the organization,
which is relatively increased during the financial year. the values of debt to equity ratio has
increased from 1.93% in 2015-16 to 6.34% in 2016-17.Increment in debt to equity ratio was
due to the high level of total depth that has been accumulated by the company over the period
7
The information provided in the above table directly Indicates about The losses that
has been increased by your organization during the two financial years. The decline in profit
levels has relatively indicated on negative surplus for the financial year of the organization.
The reduced profit levels of the company are directly indicating that the company generates
no surplus during financial year due to high losses incurred from operations.
Return on Assets:
Particulars 2016-17 2015-16
Net income -1,93,431 -12,023
Total assets 48,83,446 51,09,360
Return on assets -3.96% -0.24%
The return on Assets of the organization has relatively declined over the period of two
financial years. This relevant decline in the level of return on assets is due to the reduction in
the net income of the company. The company directly witnessed a loss greater than the
previous financial year find the total Assets of the company also produced due to the previous
financial losses. In addition, the return on Assets of the company produces a negative value
of -3.96% in 2016-17, as compared to -0.24% in 2015-16. Hence, the return on Assets of the
organization is not adequate and portraying a negative value for the organization
(Alekseyeva, 2014).
Debt to equity ratio:
Particulars 2016-17 2015-16
Total debt 3,18,013.89 96,872.06
Total equity 50,14,666.35 50,12,487.58
Debt to equity ratio 6.34% 1.93%
About table provides information about India to equity ratio of the organization,
which is relatively increased during the financial year. the values of debt to equity ratio has
increased from 1.93% in 2015-16 to 6.34% in 2016-17.Increment in debt to equity ratio was
due to the high level of total depth that has been accumulated by the company over the period
SPORT, EVENTS FUNDING, AND FINANCE
8
of two financial years. However, the changes in equity have relatively remained similar,
which can depict about the relevant stagnation in the equity capital.
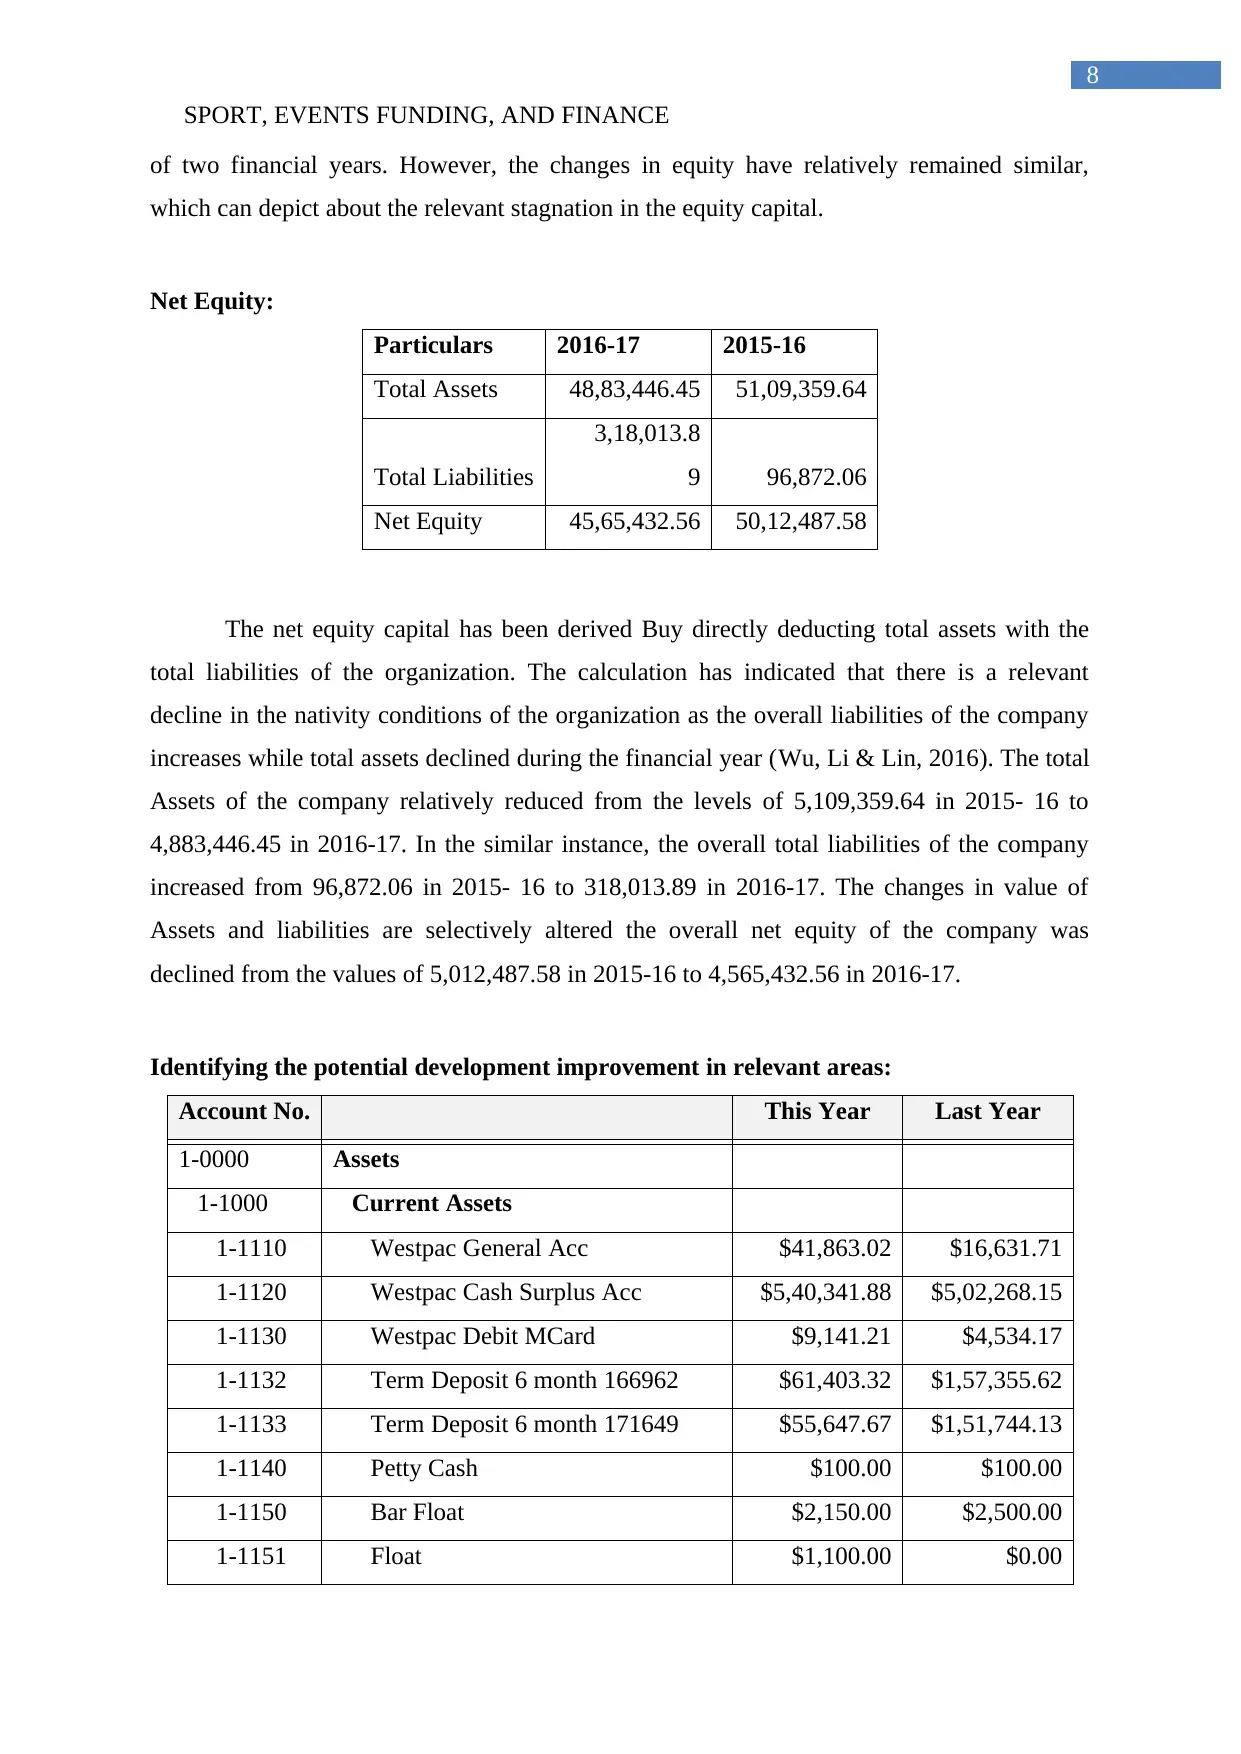
Net Equity:
Particulars 2016-17 2015-16
Total Assets 48,83,446.45 51,09,359.64
Total Liabilities
3,18,013.8
9 96,872.06
Net Equity 45,65,432.56 50,12,487.58
The net equity capital has been derived Buy directly deducting total assets with the
total liabilities of the organization. The calculation has indicated that there is a relevant
decline in the nativity conditions of the organization as the overall liabilities of the company
increases while total assets declined during the financial year (Wu, Li & Lin, 2016). The total
Assets of the company relatively reduced from the levels of 5,109,359.64 in 2015- 16 to
4,883,446.45 in 2016-17. In the similar instance, the overall total liabilities of the company
increased from 96,872.06 in 2015- 16 to 318,013.89 in 2016-17. The changes in value of
Assets and liabilities are selectively altered the overall net equity of the company was
declined from the values of 5,012,487.58 in 2015-16 to 4,565,432.56 in 2016-17.
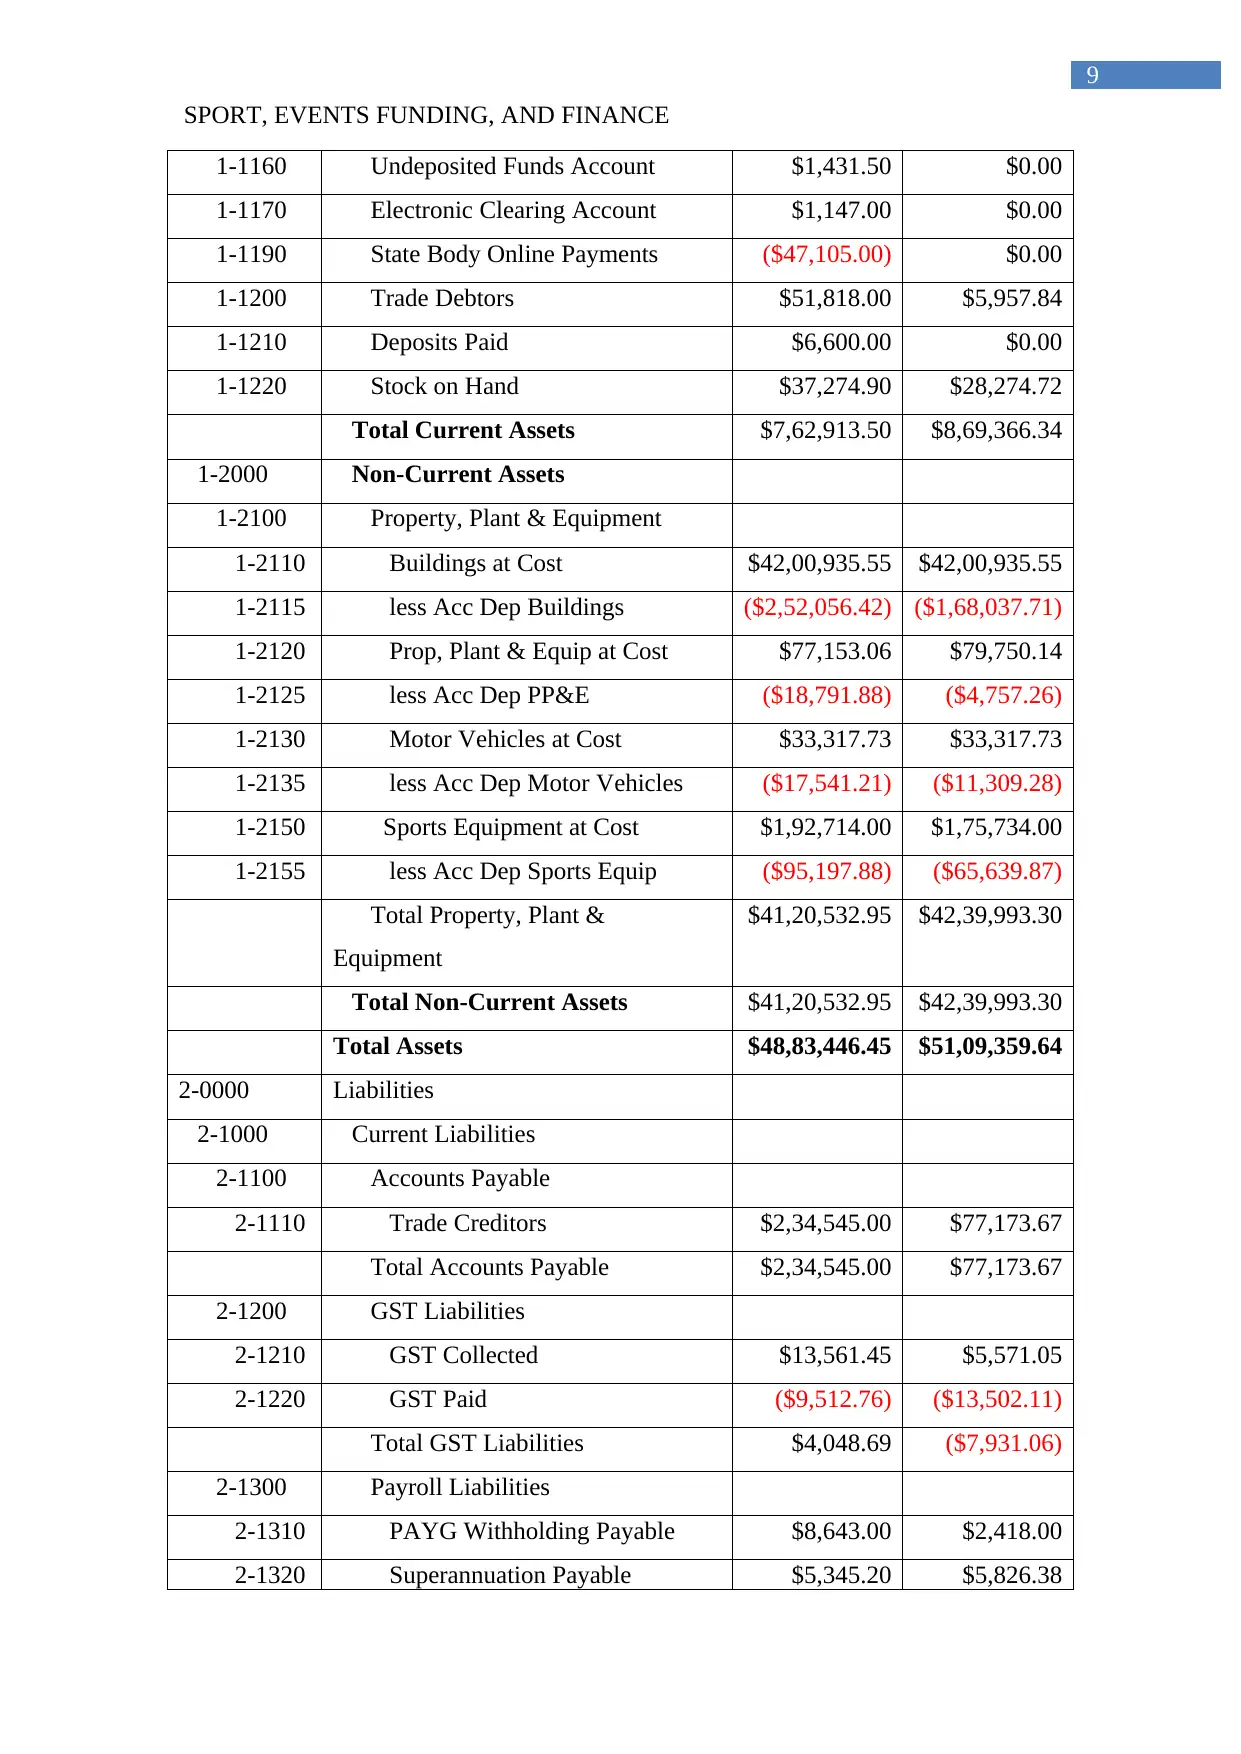
Identifying the potential development improvement in relevant areas:
Account No. This Year Last Year
1-0000 Assets
1-1000 Current Assets
1-1110 Westpac General Acc $41,863.02 $16,631.71
1-1120 Westpac Cash Surplus Acc $5,40,341.88 $5,02,268.15
1-1130 Westpac Debit MCard $9,141.21 $4,534.17
1-1132 Term Deposit 6 month 166962 $61,403.32 $1,57,355.62
1-1133 Term Deposit 6 month 171649 $55,647.67 $1,51,744.13
1-1140 Petty Cash $100.00 $100.00
1-1150 Bar Float $2,150.00 $2,500.00
1-1151 Float $1,100.00 $0.00
8
of two financial years. However, the changes in equity have relatively remained similar,
which can depict about the relevant stagnation in the equity capital.
Net Equity:
Particulars 2016-17 2015-16
Total Assets 48,83,446.45 51,09,359.64
Total Liabilities
3,18,013.8
9 96,872.06
Net Equity 45,65,432.56 50,12,487.58
The net equity capital has been derived Buy directly deducting total assets with the
total liabilities of the organization. The calculation has indicated that there is a relevant
decline in the nativity conditions of the organization as the overall liabilities of the company
increases while total assets declined during the financial year (Wu, Li & Lin, 2016). The total
Assets of the company relatively reduced from the levels of 5,109,359.64 in 2015- 16 to
4,883,446.45 in 2016-17. In the similar instance, the overall total liabilities of the company
increased from 96,872.06 in 2015- 16 to 318,013.89 in 2016-17. The changes in value of
Assets and liabilities are selectively altered the overall net equity of the company was
declined from the values of 5,012,487.58 in 2015-16 to 4,565,432.56 in 2016-17.
Identifying the potential development improvement in relevant areas:
Account No. This Year Last Year
1-0000 Assets
1-1000 Current Assets
1-1110 Westpac General Acc $41,863.02 $16,631.71
1-1120 Westpac Cash Surplus Acc $5,40,341.88 $5,02,268.15
1-1130 Westpac Debit MCard $9,141.21 $4,534.17
1-1132 Term Deposit 6 month 166962 $61,403.32 $1,57,355.62
1-1133 Term Deposit 6 month 171649 $55,647.67 $1,51,744.13
1-1140 Petty Cash $100.00 $100.00
1-1150 Bar Float $2,150.00 $2,500.00
1-1151 Float $1,100.00 $0.00
⊘ This is a preview!⊘
Do you want full access?
Subscribe today to unlock all pages.
Trusted by 1+ million students worldwide
SPORT, EVENTS FUNDING, AND FINANCE
9
1-1160 Undeposited Funds Account $1,431.50 $0.00
1-1170 Electronic Clearing Account $1,147.00 $0.00
1-1190 State Body Online Payments ($47,105.00) $0.00
1-1200 Trade Debtors $51,818.00 $5,957.84
1-1210 Deposits Paid $6,600.00 $0.00
1-1220 Stock on Hand $37,274.90 $28,274.72
Total Current Assets $7,62,913.50 $8,69,366.34
1-2000 Non-Current Assets
1-2100 Property, Plant & Equipment
1-2110 Buildings at Cost $42,00,935.55 $42,00,935.55
1-2115 less Acc Dep Buildings ($2,52,056.42) ($1,68,037.71)
1-2120 Prop, Plant & Equip at Cost $77,153.06 $79,750.14
1-2125 less Acc Dep PP&E ($18,791.88) ($4,757.26)
1-2130 Motor Vehicles at Cost $33,317.73 $33,317.73
1-2135 less Acc Dep Motor Vehicles ($17,541.21) ($11,309.28)
1-2150 Sports Equipment at Cost $1,92,714.00 $1,75,734.00
1-2155 less Acc Dep Sports Equip ($95,197.88) ($65,639.87)
Total Property, Plant &
Equipment
$41,20,532.95 $42,39,993.30
Total Non-Current Assets $41,20,532.95 $42,39,993.30
Total Assets $48,83,446.45 $51,09,359.64
2-0000 Liabilities
2-1000 Current Liabilities
2-1100 Accounts Payable
2-1110 Trade Creditors $2,34,545.00 $77,173.67
Total Accounts Payable $2,34,545.00 $77,173.67
2-1200 GST Liabilities
2-1210 GST Collected $13,561.45 $5,571.05
2-1220 GST Paid ($9,512.76) ($13,502.11)
Total GST Liabilities $4,048.69 ($7,931.06)
2-1300 Payroll Liabilities
2-1310 PAYG Withholding Payable $8,643.00 $2,418.00
2-1320 Superannuation Payable $5,345.20 $5,826.38
Paraphrase This Document
Need a fresh take? Get an instant paraphrase of this document with our AI Paraphraser
SPORT, EVENTS FUNDING, AND FINANCE
10
2-1340 Provision for Annual Leave $65,432.00 $19,385.07
Total Payroll Liabilities $79,420.20 $27,629.45
Total Current Liabilities $3,18,013.89 $96,872.06
Total Liabilities $3,18,013.89 $96,872.06
Net Assets $45,65,432.56 $50,12,487.58
3-0000 Equity
3-1000 Retained Earnings $50,12,487.58 $47,88,347.66
3-2000 Current Year Earnings $2,178.77 $2,24,139.92
Total Equity $50,14,666.35 $50,12,487.58
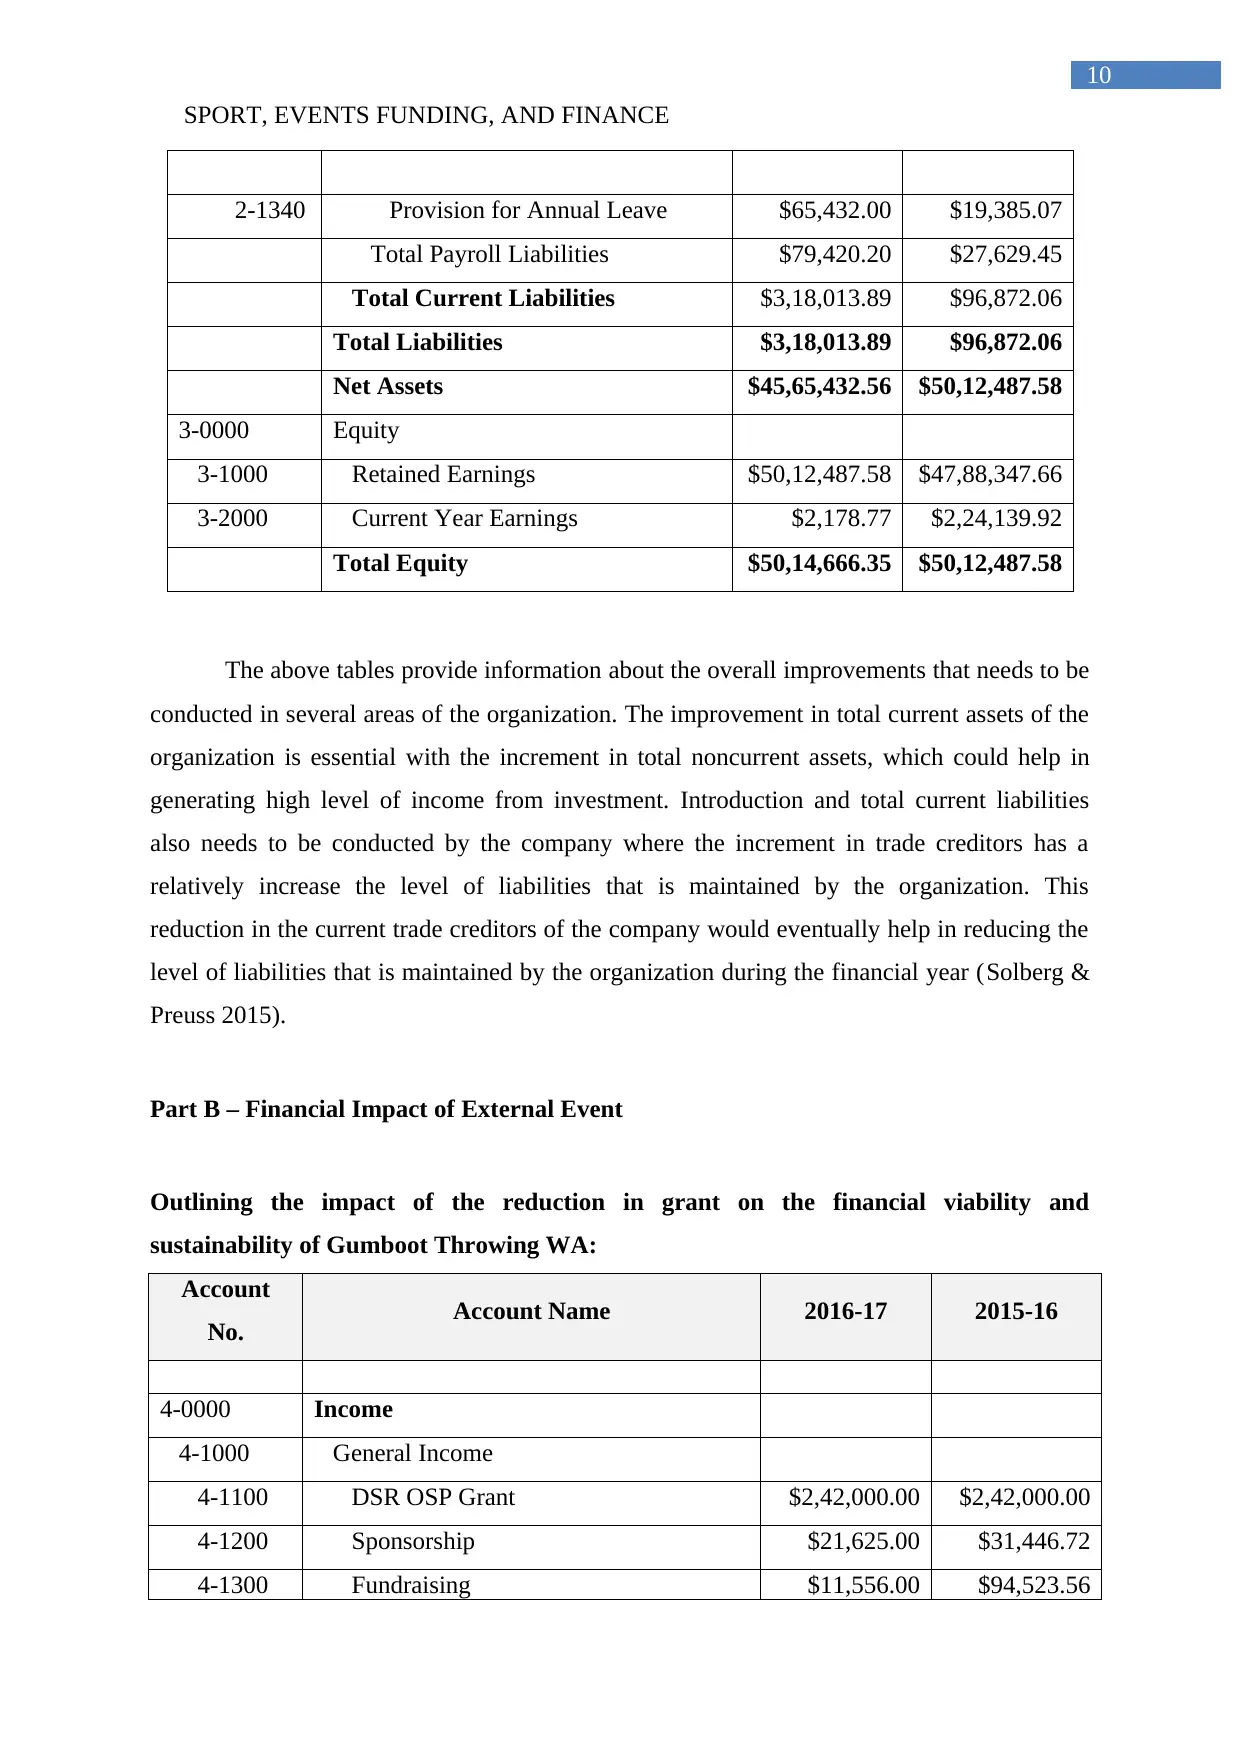
The above tables provide information about the overall improvements that needs to be
conducted in several areas of the organization. The improvement in total current assets of the
organization is essential with the increment in total noncurrent assets, which could help in
generating high level of income from investment. Introduction and total current liabilities
also needs to be conducted by the company where the increment in trade creditors has a
relatively increase the level of liabilities that is maintained by the organization. This
reduction in the current trade creditors of the company would eventually help in reducing the
level of liabilities that is maintained by the organization during the financial year (Solberg &
Preuss 2015).
Part B – Financial Impact of External Event
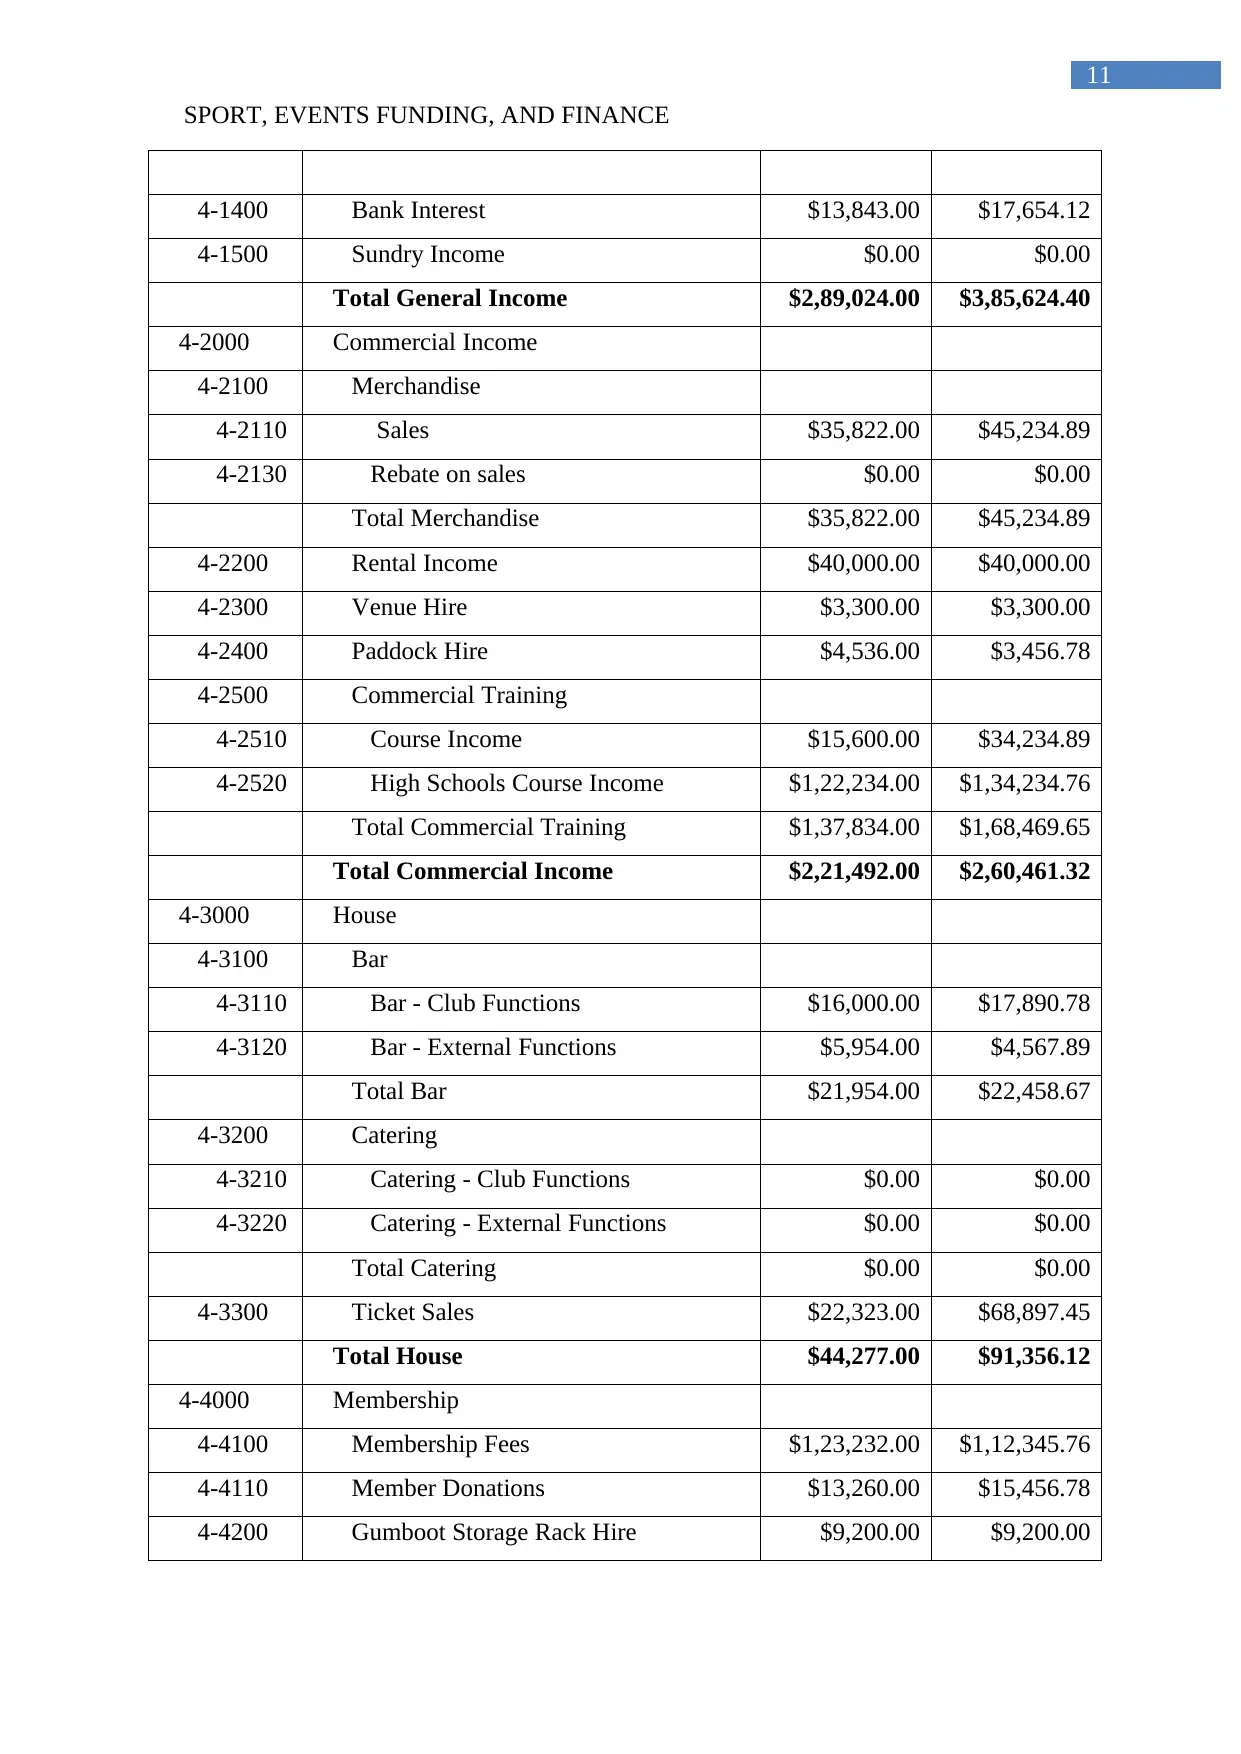
Outlining the impact of the reduction in grant on the financial viability and
sustainability of Gumboot Throwing WA:
Account
No. Account Name 2016-17 2015-16
4-0000 Income
4-1000 General Income
4-1100 DSR OSP Grant $2,42,000.00 $2,42,000.00
4-1200 Sponsorship $21,625.00 $31,446.72
4-1300 Fundraising $11,556.00 $94,523.56
10
2-1340 Provision for Annual Leave $65,432.00 $19,385.07
Total Payroll Liabilities $79,420.20 $27,629.45
Total Current Liabilities $3,18,013.89 $96,872.06
Total Liabilities $3,18,013.89 $96,872.06
Net Assets $45,65,432.56 $50,12,487.58
3-0000 Equity
3-1000 Retained Earnings $50,12,487.58 $47,88,347.66
3-2000 Current Year Earnings $2,178.77 $2,24,139.92
Total Equity $50,14,666.35 $50,12,487.58
The above tables provide information about the overall improvements that needs to be
conducted in several areas of the organization. The improvement in total current assets of the
organization is essential with the increment in total noncurrent assets, which could help in
generating high level of income from investment. Introduction and total current liabilities
also needs to be conducted by the company where the increment in trade creditors has a
relatively increase the level of liabilities that is maintained by the organization. This
reduction in the current trade creditors of the company would eventually help in reducing the
level of liabilities that is maintained by the organization during the financial year (Solberg &
Preuss 2015).
Part B – Financial Impact of External Event
Outlining the impact of the reduction in grant on the financial viability and
sustainability of Gumboot Throwing WA:
Account
No. Account Name 2016-17 2015-16
4-0000 Income
4-1000 General Income
4-1100 DSR OSP Grant $2,42,000.00 $2,42,000.00
4-1200 Sponsorship $21,625.00 $31,446.72
4-1300 Fundraising $11,556.00 $94,523.56
SPORT, EVENTS FUNDING, AND FINANCE
11
4-1400 Bank Interest $13,843.00 $17,654.12
4-1500 Sundry Income $0.00 $0.00
Total General Income $2,89,024.00 $3,85,624.40
4-2000 Commercial Income
4-2100 Merchandise
4-2110 Sales $35,822.00 $45,234.89
4-2130 Rebate on sales $0.00 $0.00
Total Merchandise $35,822.00 $45,234.89
4-2200 Rental Income $40,000.00 $40,000.00
4-2300 Venue Hire $3,300.00 $3,300.00
4-2400 Paddock Hire $4,536.00 $3,456.78
4-2500 Commercial Training
4-2510 Course Income $15,600.00 $34,234.89
4-2520 High Schools Course Income $1,22,234.00 $1,34,234.76
Total Commercial Training $1,37,834.00 $1,68,469.65
Total Commercial Income $2,21,492.00 $2,60,461.32
4-3000 House
4-3100 Bar
4-3110 Bar - Club Functions $16,000.00 $17,890.78
4-3120 Bar - External Functions $5,954.00 $4,567.89
Total Bar $21,954.00 $22,458.67
4-3200 Catering
4-3210 Catering - Club Functions $0.00 $0.00
4-3220 Catering - External Functions $0.00 $0.00
Total Catering $0.00 $0.00
4-3300 Ticket Sales $22,323.00 $68,897.45
Total House $44,277.00 $91,356.12
4-4000 Membership
4-4100 Membership Fees $1,23,232.00 $1,12,345.76
4-4110 Member Donations $13,260.00 $15,456.78
4-4200 Gumboot Storage Rack Hire $9,200.00 $9,200.00
⊘ This is a preview!⊘
Do you want full access?
Subscribe today to unlock all pages.
Trusted by 1+ million students worldwide
1 out of 20
Related Documents


Your All-in-One AI-Powered Toolkit for Academic Success.
+13062052269
info@desklib.com
Available 24*7 on WhatsApp / Email
![[object Object]](/_next/static/media/star-bottom.7253800d.svg)
Unlock your academic potential
Copyright © 2020–2026 A2Z Services. All Rights Reserved. Developed and managed by ZUCOL.