Holmes Institute HA1011 Applied Quantitative Methods Assignment 2

Verified

Added on  2022/11/23

|14
|1221
|283
Homework Assignment
AI Summary
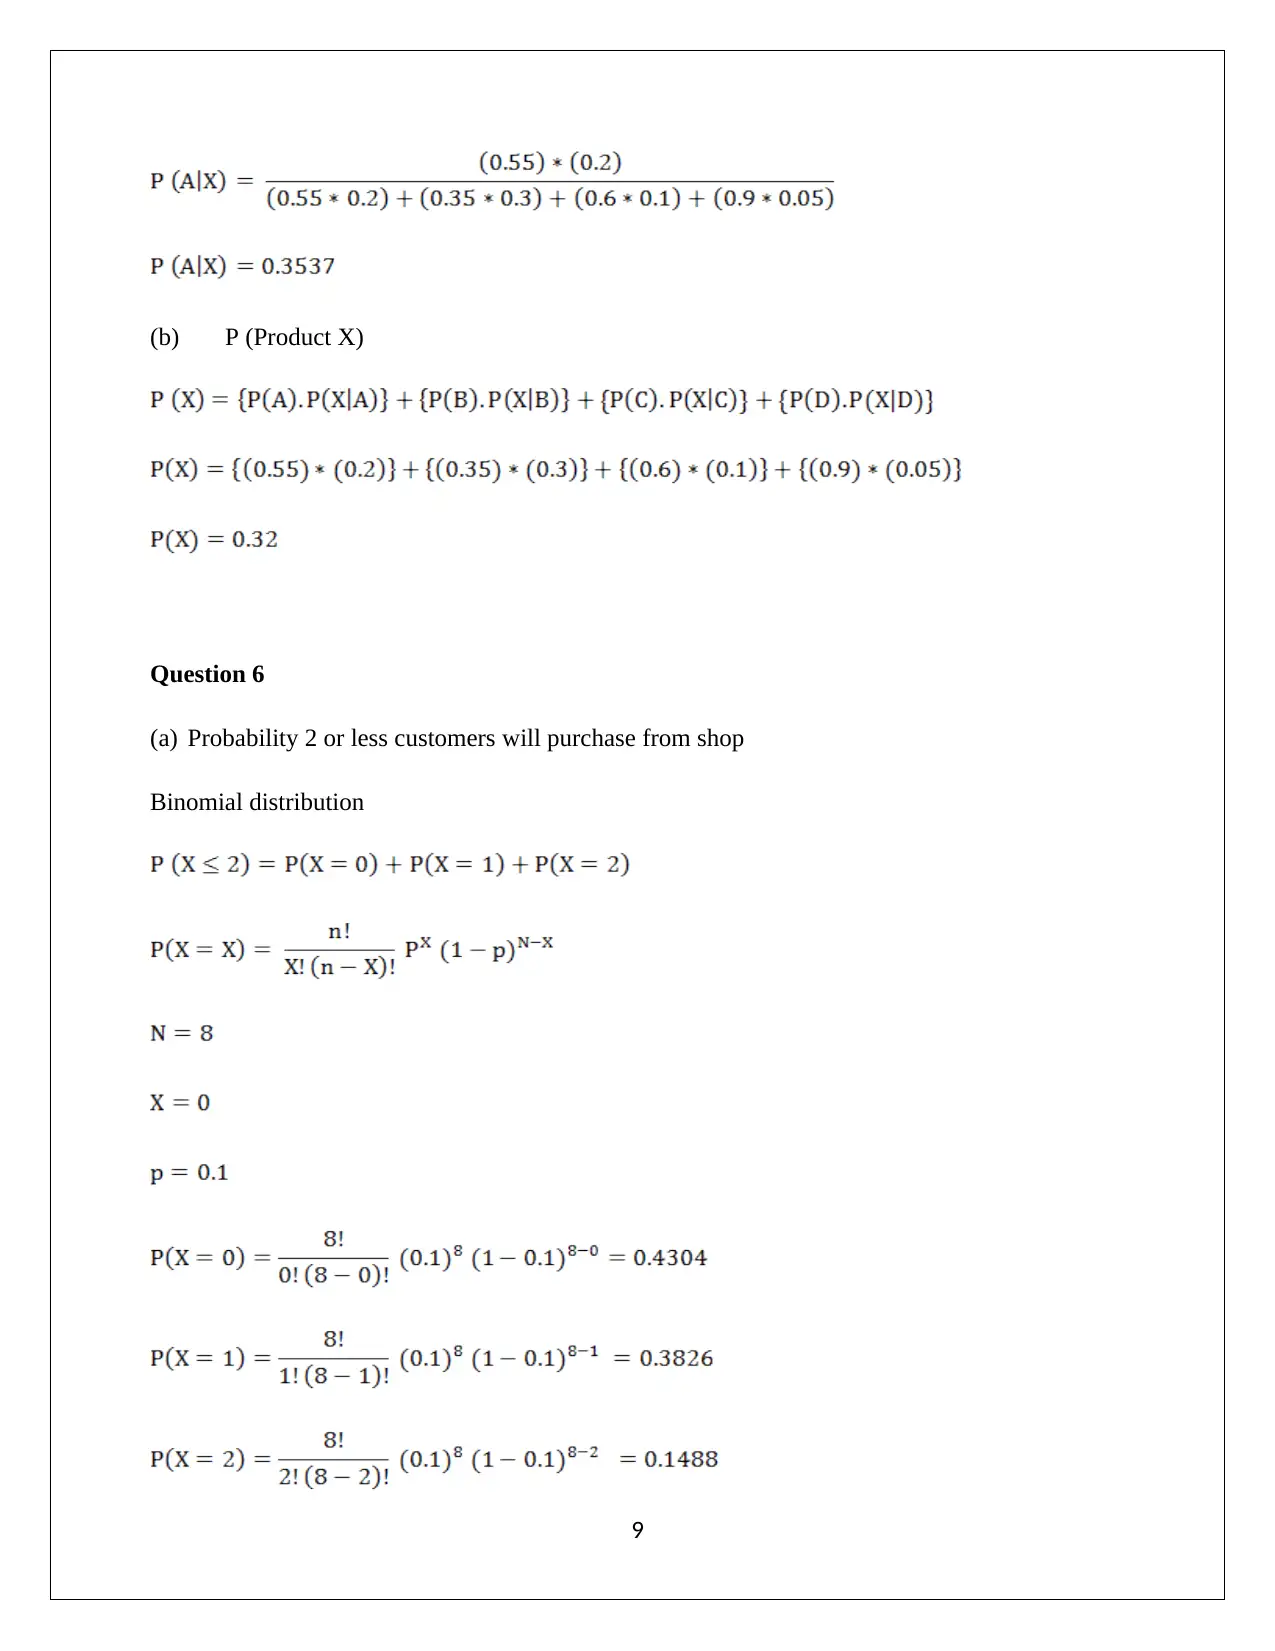
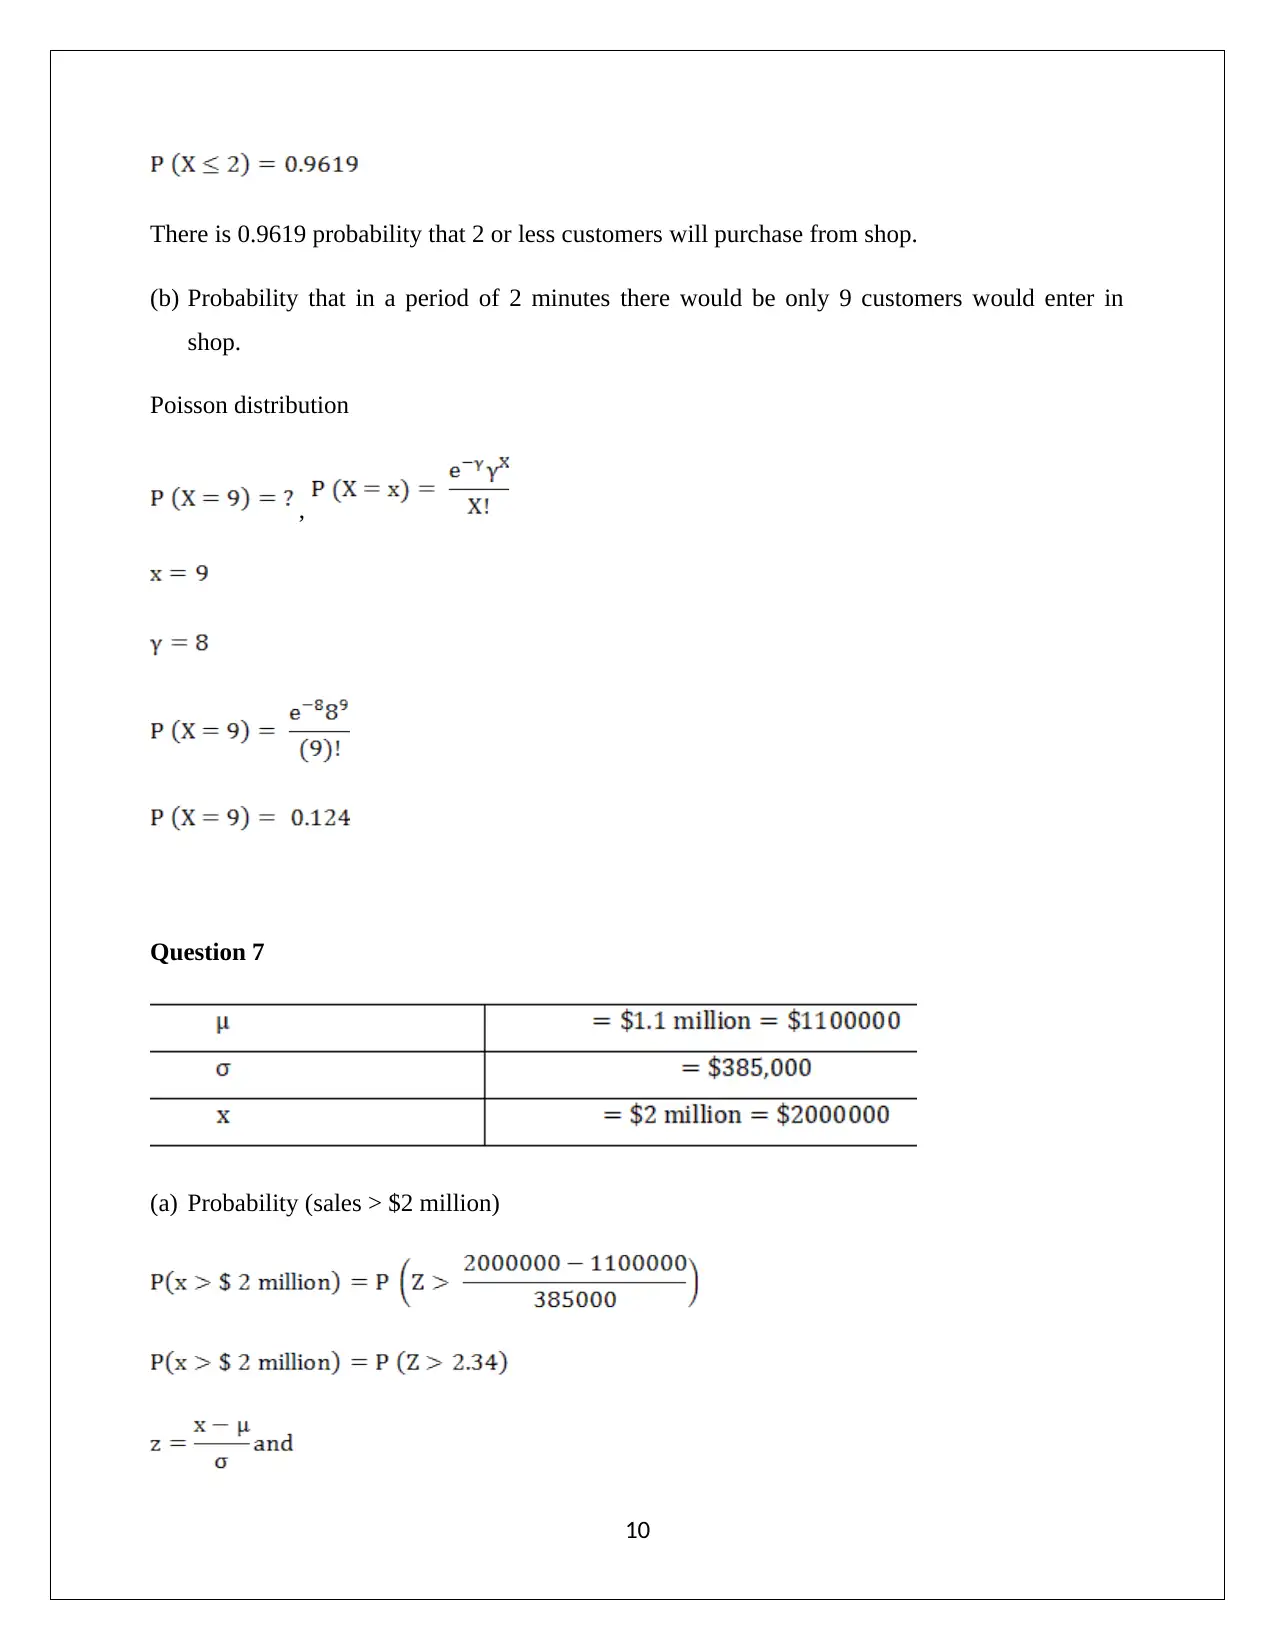
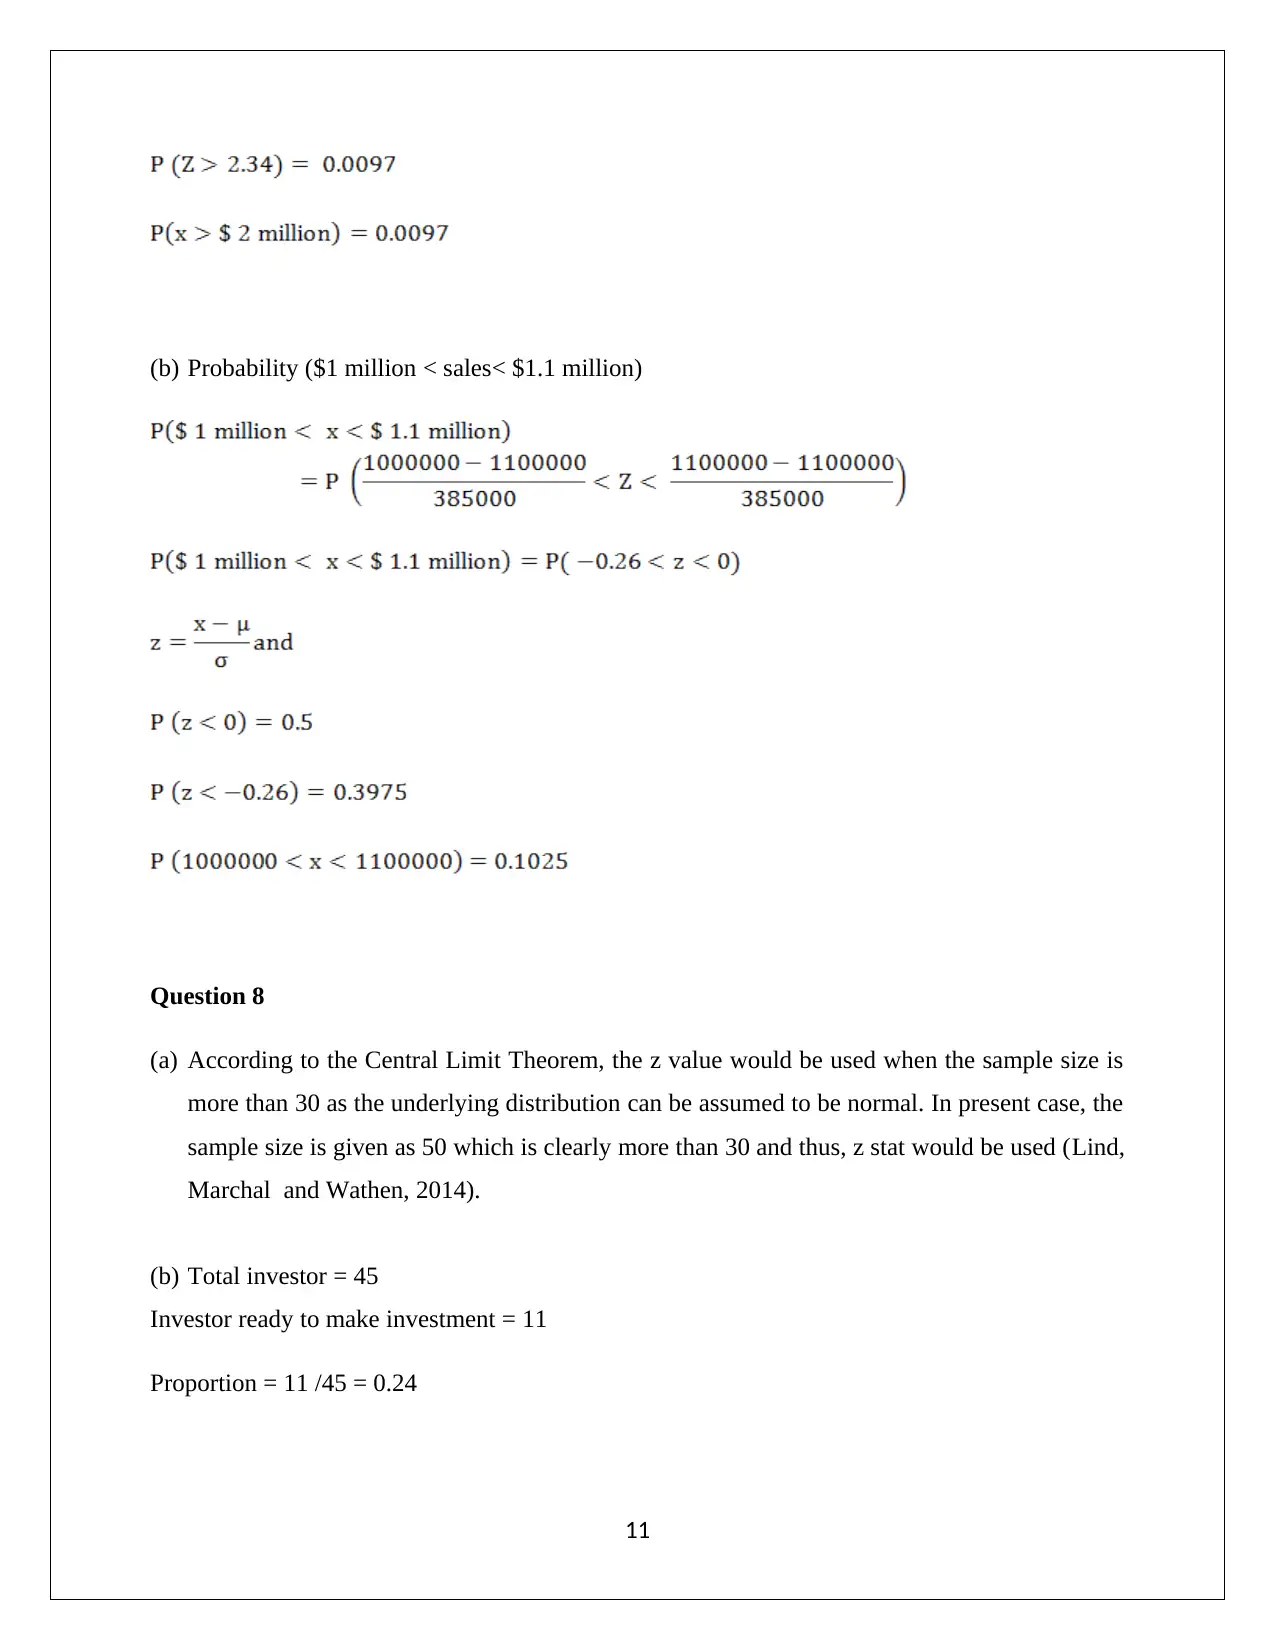
This document presents a comprehensive solution to an Applied Quantitative Methods assignment, focusing on statistical analysis and its application to business problems. The assignment covers a range of topics, including frequency distributions, histograms, and measures of central tendency (mean, median, and mode). It delves into sample vs. population data, standard deviation, and the Interquartile Range (IQR). Furthermore, the solution explores correlation coefficients, least square regression, and the coefficient of determination (R-squared). Probability concepts, such as conditional probability and independent events, are also addressed. The assignment also includes applications of binomial and Poisson distributions. Finally, the solution uses the Central Limit Theorem and hypothesis testing to solve a variety of statistical problems.
tabler-icon-diamond-filled.svg

Contribute Materials

Your contribution can guide someone’s learning journey. Share your documents today.
Document Page
APPLIED QUANTITATIVE METHODS
ASSIGNMENT 2
Student Name
[Pick the date]
tabler-icon-diamond-filled.svg

Secure Best Marks with AI Grader

Need help grading? Try our AI Grader for instant feedback on your assignments.
Document Page
Question 1
(a) Frequency distribution of number of passengers at Melbourne train station
(b) Histogram
(c) Mean, median and mode
Sorted data (Ascending order)
1
Document Page
2
Document Page
Sample size = 60
Sum of observation= 58594
Mean = 58594/60 = 976.57
Median
= (733+862)/2 = 797.5
Mode
Maximum frequency has observed for 401 and thus, mode would be 401.
Question 2
(a) It can be seen from above that the given data has been extracted from the population because
it is data only for 7 weeks not for all the 52 weeks, which means that the data is sample.. The
population data would correspond to all the possible values and thereby would highlight the
data for all the weeks over a given year which is not the case here (Hair et. al., 2015).
(b) Standard deviation of ‘weekly attendance’
3
tabler-icon-diamond-filled.svg

Secure Best Marks with AI Grader

Need help grading? Try our AI Grader for instant feedback on your assignments.
Document Page
(c) The Inter Quartile Range (IQR) of ‘number of chocolate bars sold’
Sorted data (Ascending order)
Q3 is mainly 75th percentile whereas Q1 is 25th percentile.
4
Document Page
IQR is more useful than standard deviation when the underlying data is skewed. This is because
standard deviation is quite vulnerable to outliers and extreme values which is not the case for
IQR which is immune to such extreme values. For instance, if the data for weekly chocolate
consumption is 500,600, 550, 575, 1500, then IQR is more suitable than standard deviation since
1500 seems to be an outlier (Lieberman et. al., 2013).
(d) Correlation coefficient
The correlation coefficient implies that there is strong positive association between weekly
attendance and chocolates sold. As a result, it would make sense to stock chocolate based on the
5
Document Page
expected weekly attendance. Further, in case of holidays the sale of chocolates would be
adversely impacted (Hastie, Tibshirani and Friedman, 2014).
Question 3
(a) Least square regression line equation
Now,
Regression equation
6
tabler-icon-diamond-filled.svg

Paraphrase This Document

Need a fresh take? Get an instant paraphrase of this document with our AI Paraphraser
Document Page
y = 1628.689 +10.67 x
Number of chocolate bars sold = 1628.689 + (10.67* Weekly attendance)
Example
1) When the weekly attenance of student is zero i.e (x = 0)
Number of chocolate bars sold = 1628.689 +(10.67 * 0)
Number of chocolate bars sold = 1629
2) When the weekly attandance of student is improve by 10 then the number of chocolate bars
would also be increased by (10*10.67 or) 1067 units.
(b) Correlation of determination
R square = (
The R square reresents that 93.7% variation in number of chocolate bars sold would be explained
by variation in the weekly attendance of the student. The value is signifiantly high which means
that the regression model is a good fit (Medhi, 2016).
Question 4
(a) P (Grassroots and Holmes) = (35+92+12)/ (35+92+54+12) = 139/193 =0.72
(b) P (Scientific and External) = (54)/ (35+92+54+12) = 54/193 =0.28
(c) P (Scientific and Holmes) = (35)/ (35+92) = 0.276
(d) Training and Recruitment are considered as independent events?
7
Document Page
They will be independent events when P(A). P(B) = P (A and B)
P (A). P (B) = 0.341* 0.461 = 0.157
P (A and B) = 0.257
Here, P(A). P(B) is not equal to P (A and B) and hence, Training and Recruitment are not
considered as independent events.
Question 5
(a) Probability (Product x | segment A)
8
Document Page
(b) P (Product X)
Question 6
(a) Probability 2 or less customers will purchase from shop
Binomial distribution
9
tabler-icon-diamond-filled.svg

Secure Best Marks with AI Grader

Need help grading? Try our AI Grader for instant feedback on your assignments.
Document Page
There is 0.9619 probability that 2 or less customers will purchase from shop.
(b) Probability that in a period of 2 minutes there would be only 9 customers would enter in
shop.
Poisson distribution
,
Question 7
(a) Probability (sales > $2 million)
10
Document Page
(b) Probability ($1 million < sales< $1.1 million)
Question 8
(a) According to the Central Limit Theorem, the z value would be used when the sample size is
more than 30 as the underlying distribution can be assumed to be normal. In present case, the
sample size is given as 50 which is clearly more than 30 and thus, z stat would be used (Lind,
Marchal and Wathen, 2014).
(b) Total investor = 45
Investor ready to make investment = 11
Proportion = 11 /45 = 0.24
11
Document Page
Standard error =
The required probability would be 0.192.
12
tabler-icon-diamond-filled.svg

Paraphrase This Document

Need a fresh take? Get an instant paraphrase of this document with our AI Paraphraser
Document Page
References
Hair, J. F., Wolfinbarger, M., Money, A. H., Samouel, P., and Page, M. J. (2015) Essentials of
business research methods. 2nd ed. New York: Routledge
Hastie, T., Tibshirani, R. and Friedman, J. (2014) The Elements of Statistical Learning. 4th
ed. New York: Springer Publications.
Lieberman, F. J., Nag, B., Hiller, F.S. and Basu, P. (2013) Introduction To Operations Research.
5th ed.New Delhi: Tata McGraw Hill Publishers.
Lind, A.D., Marchal, G.W. and Wathen, A.S. (2014) Statistical Techniques in Business and
Economics. 15th ed. New York : McGraw-Hill/Irwin.
Medhi, J. (2016) Statistical Methods: An Introductory Text. 4th ed. Sydney: New Age
International.
13
chevron_up_icon
1 out of 14
circle_padding
hide_on_mobile
zoom_out_icon
logo.png

Your All-in-One AI-Powered Toolkit for Academic Success.

Available 24*7 on WhatsApp / Email

[object Object]