HA1022: Financial Analysis of Myer & Woolworths in Australian Retail
VerifiedAdded on 2023/06/11
|15
|3480
|238
Report
AI Summary
This report evaluates Myer Limited and Woolworths Limited, two companies in the Australian retail industry, to analyze their investment positions. Using top-down and bottom-up analysis, the report assesses the firms' performance and the overall Australian retail industry. The top-down analysis considers factors like GDP, fiscal policies, and future market projections, while the bottom-up analysis employs ratio analysis to examine the companies' financial health. The study concludes that investment in the Australian retail industry offers potentially great returns, highlighting the growing factors and positive changes within the market. The report provides a detailed overview of the financial standing of both companies, offering insights into their profitability, asset efficiency, liquidity, and capital structure.
Running Head: Principle of financial management
1
Project Report: Principle of financial management
1
Project Report: Principle of financial management
Paraphrase This Document
Need a fresh take? Get an instant paraphrase of this document with our AI Paraphraser
Principle of financial management 2
Executive summary:
In this report, Myer limited and Australian limited, two companies has been evaluated, the
report focuses on the two companies from the same industry to analyze and evaluate the
investment position in the Australian market, the report conducts the top down analysis and
bottom up analysis method in the report to measure the performance of the firms and the
Australian retail industry. On the basis of the study, it has been recognized that the
investment into the retail industry would offer great returns to the company.
Principle of financial management 3
Contents
Introduction.......................................................................................................................4
Industry and company evaluation.....................................................................................4
Top down analysis............................................................................................................4
Gross domestic product................................................................................................5
Fiscal policies...............................................................................................................6
Future projection on Australian stock market..............................................................6
Industry Viewpoint.......................................................................................................7
Industry data.............................................................................................................7
Future Outlook..............................................................................................................8
Bottom up analysis...........................................................................................................8
Ratio analysis................................................................................................................9
Myer limited.............................................................................................................9
Woolworths limited................................................................................................11
Summary and recommendation......................................................................................13
References.......................................................................................................................15
⊘ This is a preview!⊘
Do you want full access?
Subscribe today to unlock all pages.
Trusted by 1+ million students worldwide
Principle of financial management 4
Introduction:
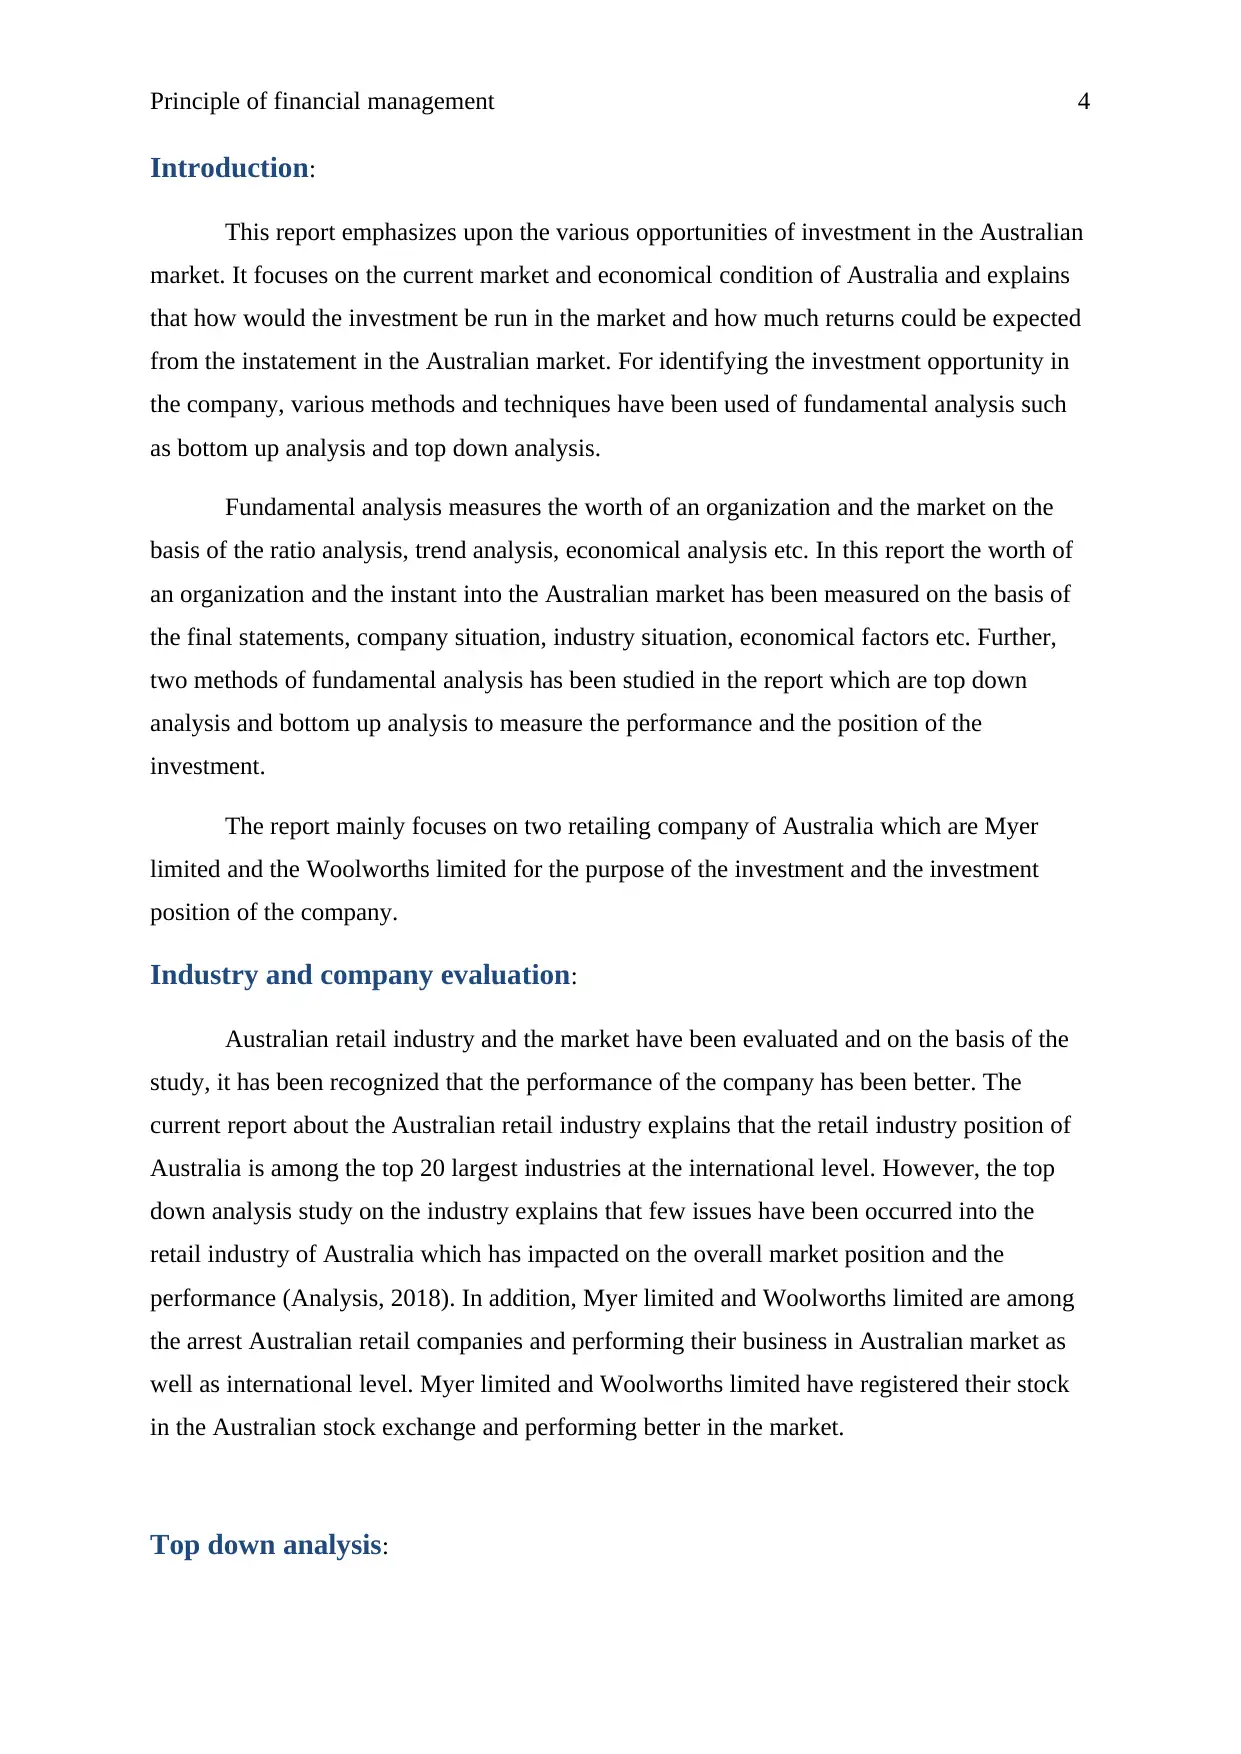
This report emphasizes upon the various opportunities of investment in the Australian
market. It focuses on the current market and economical condition of Australia and explains
that how would the investment be run in the market and how much returns could be expected
from the instatement in the Australian market. For identifying the investment opportunity in
the company, various methods and techniques have been used of fundamental analysis such
as bottom up analysis and top down analysis.
Fundamental analysis measures the worth of an organization and the market on the
basis of the ratio analysis, trend analysis, economical analysis etc. In this report the worth of
an organization and the instant into the Australian market has been measured on the basis of
the final statements, company situation, industry situation, economical factors etc. Further,
two methods of fundamental analysis has been studied in the report which are top down
analysis and bottom up analysis to measure the performance and the position of the
investment.
The report mainly focuses on two retailing company of Australia which are Myer
limited and the Woolworths limited for the purpose of the investment and the investment
position of the company.
Industry and company evaluation:
Australian retail industry and the market have been evaluated and on the basis of the
study, it has been recognized that the performance of the company has been better. The
current report about the Australian retail industry explains that the retail industry position of
Australia is among the top 20 largest industries at the international level. However, the top
down analysis study on the industry explains that few issues have been occurred into the
retail industry of Australia which has impacted on the overall market position and the
performance (Analysis, 2018). In addition, Myer limited and Woolworths limited are among
the arrest Australian retail companies and performing their business in Australian market as
well as international level. Myer limited and Woolworths limited have registered their stock
in the Australian stock exchange and performing better in the market.
Top down analysis:
Introduction:
This report emphasizes upon the various opportunities of investment in the Australian
market. It focuses on the current market and economical condition of Australia and explains
that how would the investment be run in the market and how much returns could be expected
from the instatement in the Australian market. For identifying the investment opportunity in
the company, various methods and techniques have been used of fundamental analysis such
as bottom up analysis and top down analysis.
Fundamental analysis measures the worth of an organization and the market on the
basis of the ratio analysis, trend analysis, economical analysis etc. In this report the worth of
an organization and the instant into the Australian market has been measured on the basis of
the final statements, company situation, industry situation, economical factors etc. Further,
two methods of fundamental analysis has been studied in the report which are top down
analysis and bottom up analysis to measure the performance and the position of the
investment.
The report mainly focuses on two retailing company of Australia which are Myer
limited and the Woolworths limited for the purpose of the investment and the investment
position of the company.
Industry and company evaluation:
Australian retail industry and the market have been evaluated and on the basis of the
study, it has been recognized that the performance of the company has been better. The
current report about the Australian retail industry explains that the retail industry position of
Australia is among the top 20 largest industries at the international level. However, the top
down analysis study on the industry explains that few issues have been occurred into the
retail industry of Australia which has impacted on the overall market position and the
performance (Analysis, 2018). In addition, Myer limited and Woolworths limited are among
the arrest Australian retail companies and performing their business in Australian market as
well as international level. Myer limited and Woolworths limited have registered their stock
in the Australian stock exchange and performing better in the market.
Top down analysis:
Paraphrase This Document
Need a fresh take? Get an instant paraphrase of this document with our AI Paraphraser
Principle of financial management 5
The fundamental study on Australian retail market has been done with the help of the
top down analysis method. In the analysis of top down method, a particular industry and all
the changes and the movements of the industry are evaluated which has taken place into the
industry. Top down analysis mainly works on an assumption that the performance and the
position of an organization mainly bases upon the industry under which the company is
working.
The process and the methods of top down analysis are contradictory to bottom up
analysis. Top down analysis study could be performed in better way on the basis of the depth
economical and industry evaluation (Jamshidi and Palsson, 2008). In the report, top down
analysis study of retail industry has been done on the basis of the total GDP of the industry,
fiscal policies of Australian market, forecasting on the Australian market, future outlook of
the industry etc.
The tools of top down analysis explain about those factors which have been directly
related to the performance of the firm which is operating under the particular industry. The
top down analysis study of retail industry are as follows:
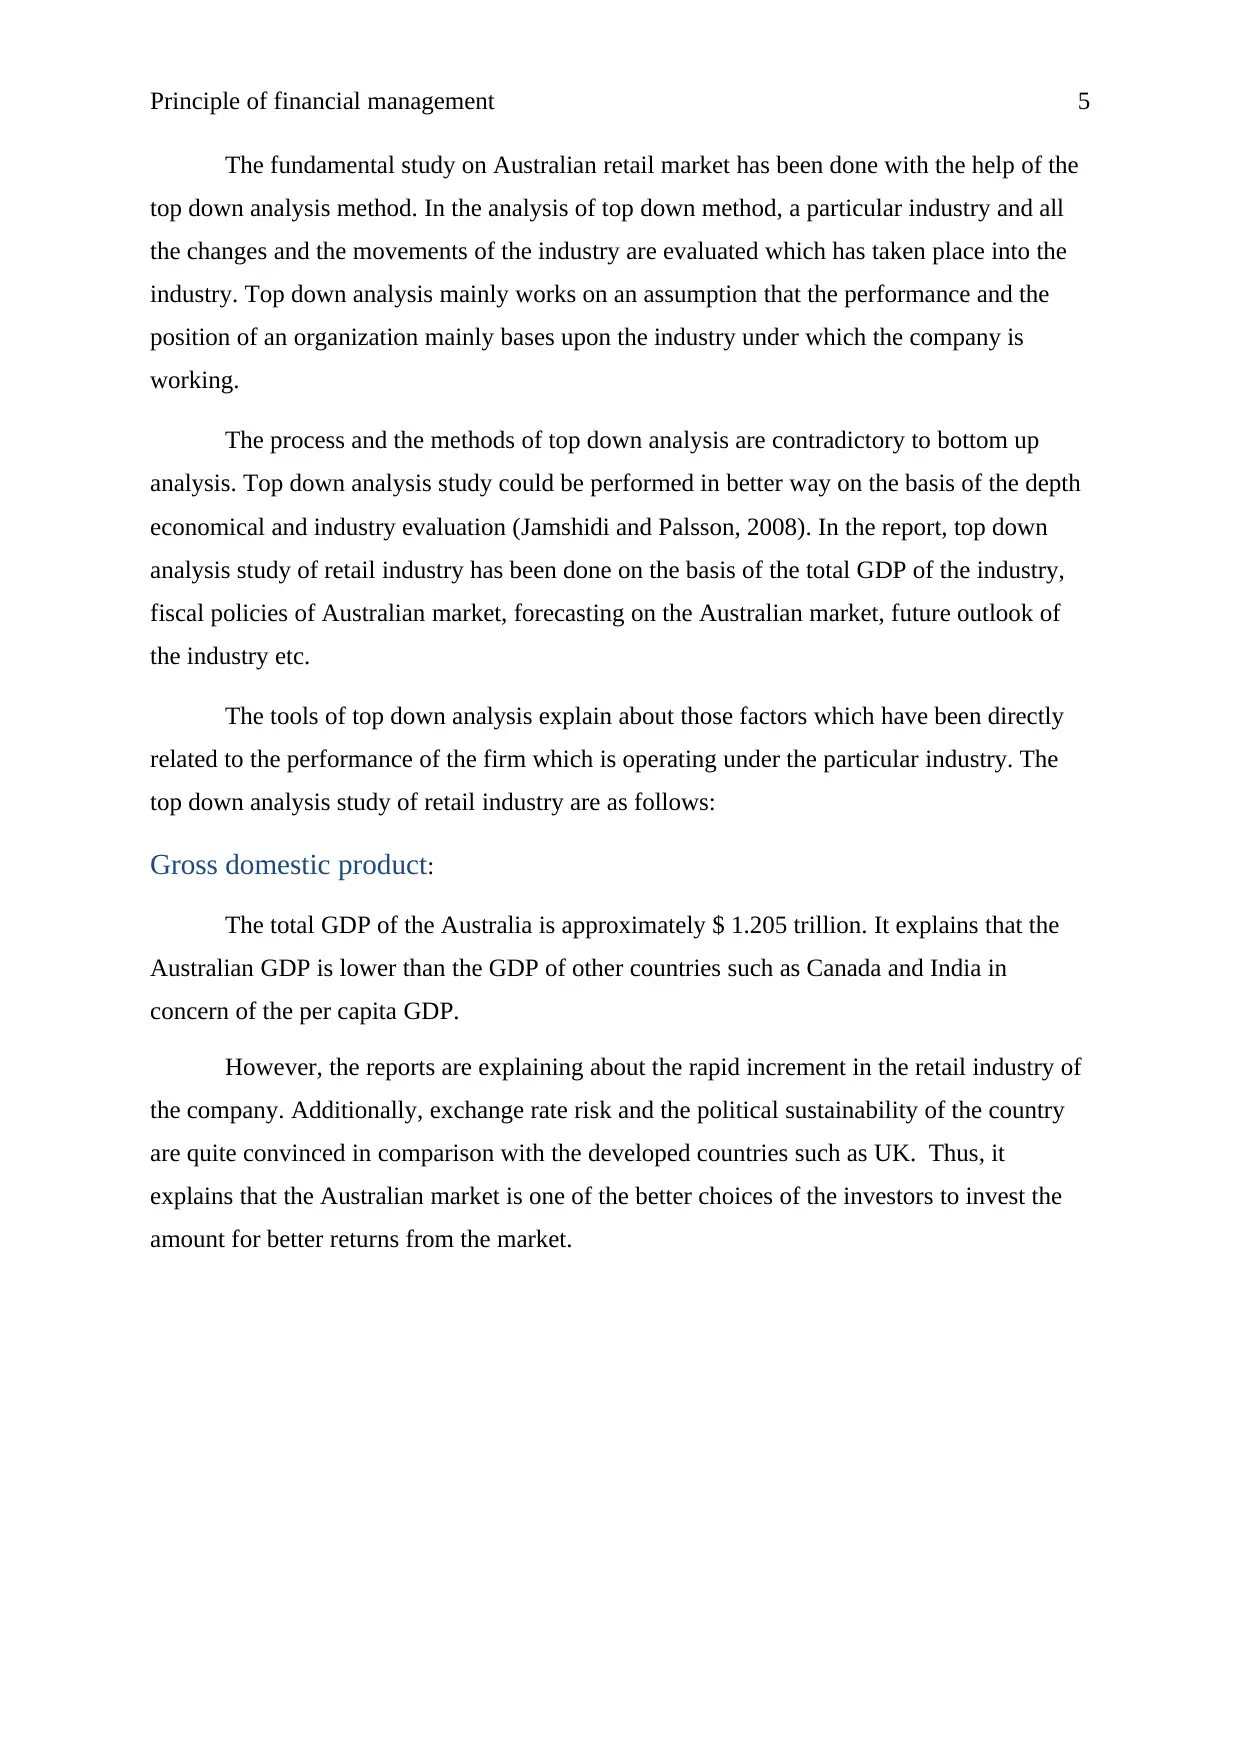
Gross domestic product:
The total GDP of the Australia is approximately $ 1.205 trillion. It explains that the
Australian GDP is lower than the GDP of other countries such as Canada and India in
concern of the per capita GDP.
However, the reports are explaining about the rapid increment in the retail industry of
the company. Additionally, exchange rate risk and the political sustainability of the country
are quite convinced in comparison with the developed countries such as UK. Thus, it
explains that the Australian market is one of the better choices of the investors to invest the
amount for better returns from the market.
The fundamental study on Australian retail market has been done with the help of the
top down analysis method. In the analysis of top down method, a particular industry and all
the changes and the movements of the industry are evaluated which has taken place into the
industry. Top down analysis mainly works on an assumption that the performance and the
position of an organization mainly bases upon the industry under which the company is
working.
The process and the methods of top down analysis are contradictory to bottom up
analysis. Top down analysis study could be performed in better way on the basis of the depth
economical and industry evaluation (Jamshidi and Palsson, 2008). In the report, top down
analysis study of retail industry has been done on the basis of the total GDP of the industry,
fiscal policies of Australian market, forecasting on the Australian market, future outlook of
the industry etc.
The tools of top down analysis explain about those factors which have been directly
related to the performance of the firm which is operating under the particular industry. The
top down analysis study of retail industry are as follows:
Gross domestic product:
The total GDP of the Australia is approximately $ 1.205 trillion. It explains that the
Australian GDP is lower than the GDP of other countries such as Canada and India in
concern of the per capita GDP.
However, the reports are explaining about the rapid increment in the retail industry of
the company. Additionally, exchange rate risk and the political sustainability of the country
are quite convinced in comparison with the developed countries such as UK. Thus, it
explains that the Australian market is one of the better choices of the investors to invest the
amount for better returns from the market.
Principle of financial management 6
(Australian retail index, 2018)
Further, the investigation on the retail industry of the Australia explains that the
higher growing factors could be seen in the Australian retail industry. It is continuously
enjoying the great growth in the Australian market. The growth rate of retail industry of
Australia is around 8%. It leads to a conclusion that the investment into the company would
offer great returns to the shareholders of the company.
Fiscal policies:
In addition, the study has been done on the fiscal policy of Australian and the retail
industry of Australia. On the basis of the study, it has been observed that Australian
government has made various changes into the policy from last few years to mange and
enhance the performance of the company. the changes into the fiscal policy has lead to the
Australian retail industry towards the higher FDI increment, gross domestic product of the
Australian retail industry is also among the few reasons behind the improved FDIs in the
Australian country (Trading economy, 2018).
Future projection on Australian stock market:
The forecasting study has been done on the Australian stock exchange and the
security market of the Australian to indicate and evaluate the performance of the company.
The stock exchange of the country explains about better index prices and a great return from
⊘ This is a preview!⊘
Do you want full access?
Subscribe today to unlock all pages.
Trusted by 1+ million students worldwide
Principle of financial management 7
the market. The gross domestic product of the company is also developing the changes into
the industry and the stock exchange (Analysis, 2018).
It has been found that the DDP is growing in upper direction as well as the
employment rate and the performance of the Australian market has also been improved which
explains that the Australia could be a better option for the purpose of investment.
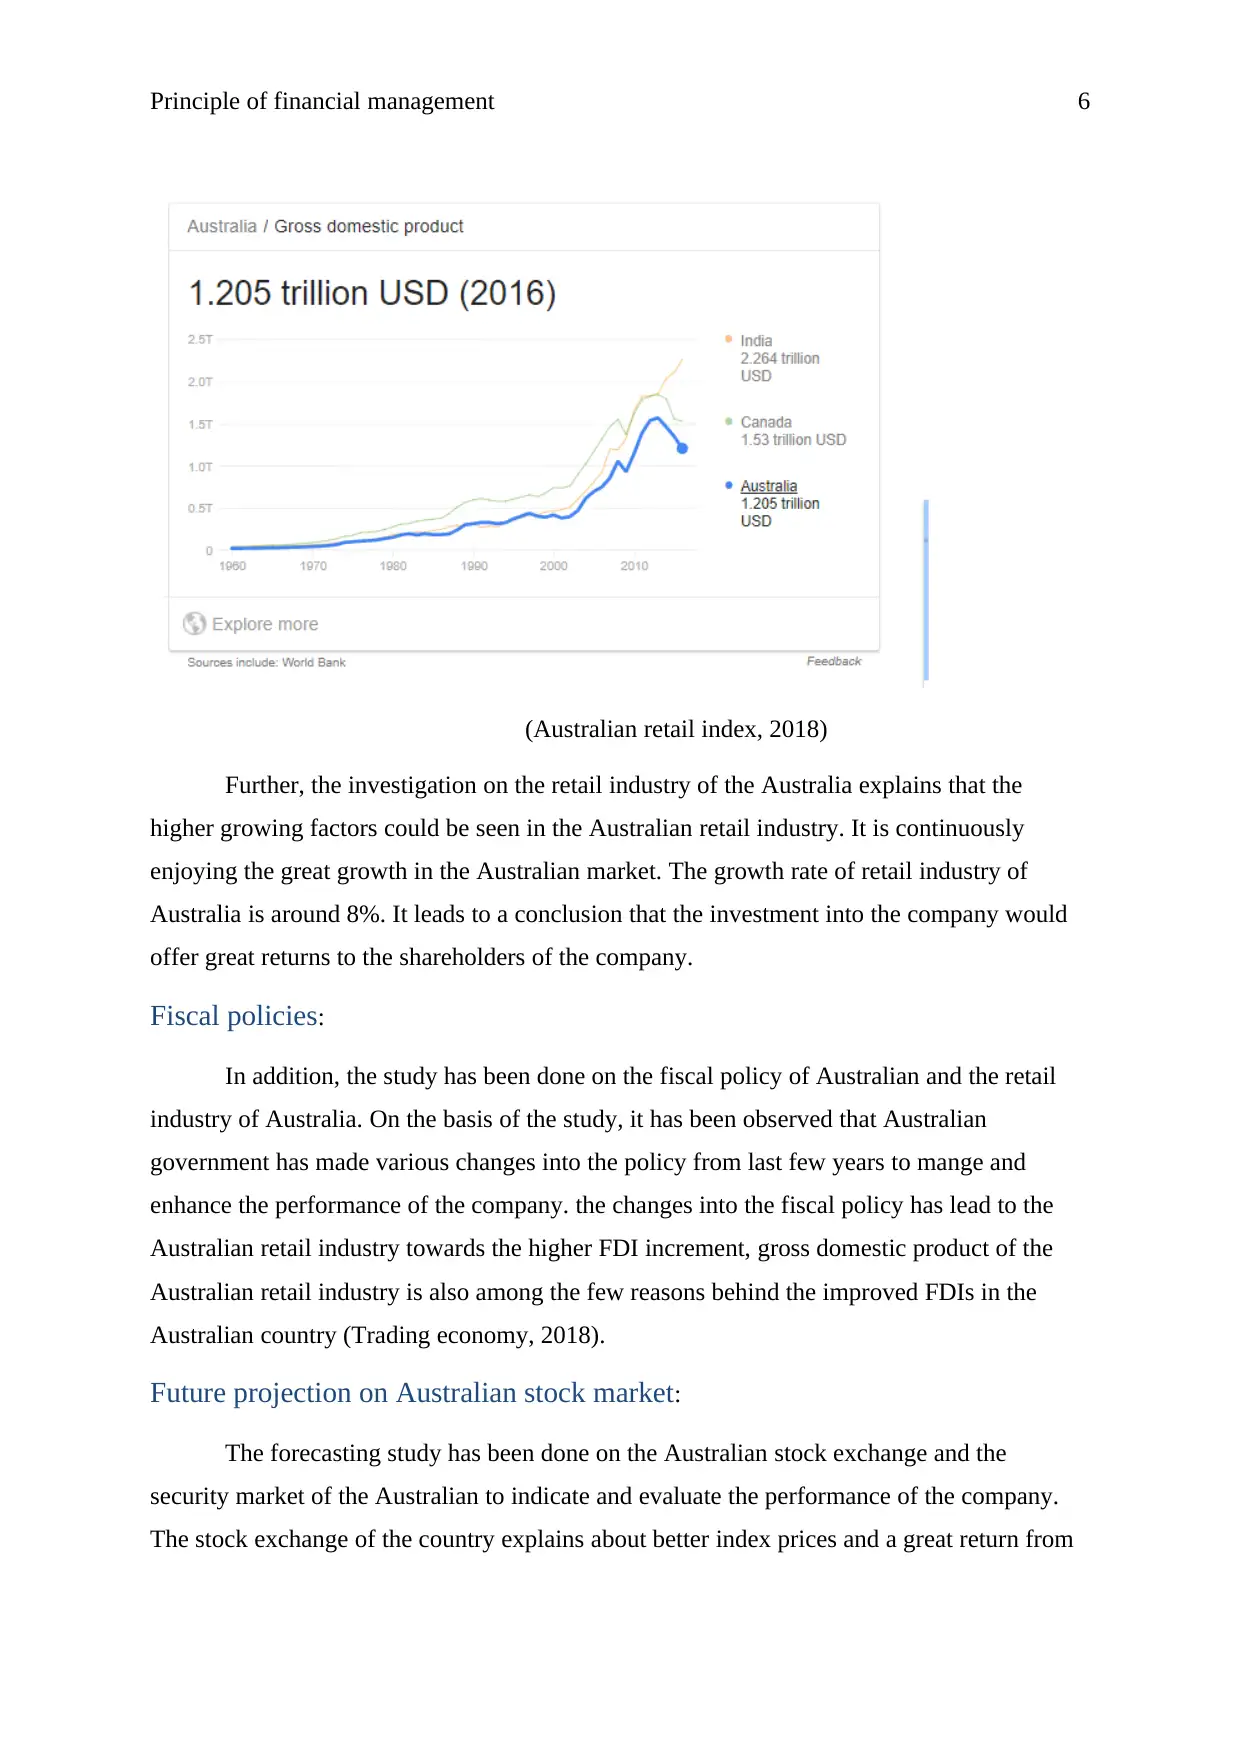
Industry Viewpoint:
Retail industry of Australia explains about growing and positive changes into the
industry in last few years. The retail industry is currently enjoying the great market share and
the GDP of the industry has also been improved. Though the current position explains about
few changes into the industry data and explains that the changes are positive and offers a
great base to the investors to evaluate the market performance and investment into the
industry for the better returns.
Industry data:
(Trading economy, 2018)
the market. The gross domestic product of the company is also developing the changes into
the industry and the stock exchange (Analysis, 2018).
It has been found that the DDP is growing in upper direction as well as the
employment rate and the performance of the Australian market has also been improved which
explains that the Australia could be a better option for the purpose of investment.
Industry Viewpoint:
Retail industry of Australia explains about growing and positive changes into the
industry in last few years. The retail industry is currently enjoying the great market share and
the GDP of the industry has also been improved. Though the current position explains about
few changes into the industry data and explains that the changes are positive and offers a
great base to the investors to evaluate the market performance and investment into the
industry for the better returns.
Industry data:
(Trading economy, 2018)
Paraphrase This Document
Need a fresh take? Get an instant paraphrase of this document with our AI Paraphraser
Principle of financial management 8
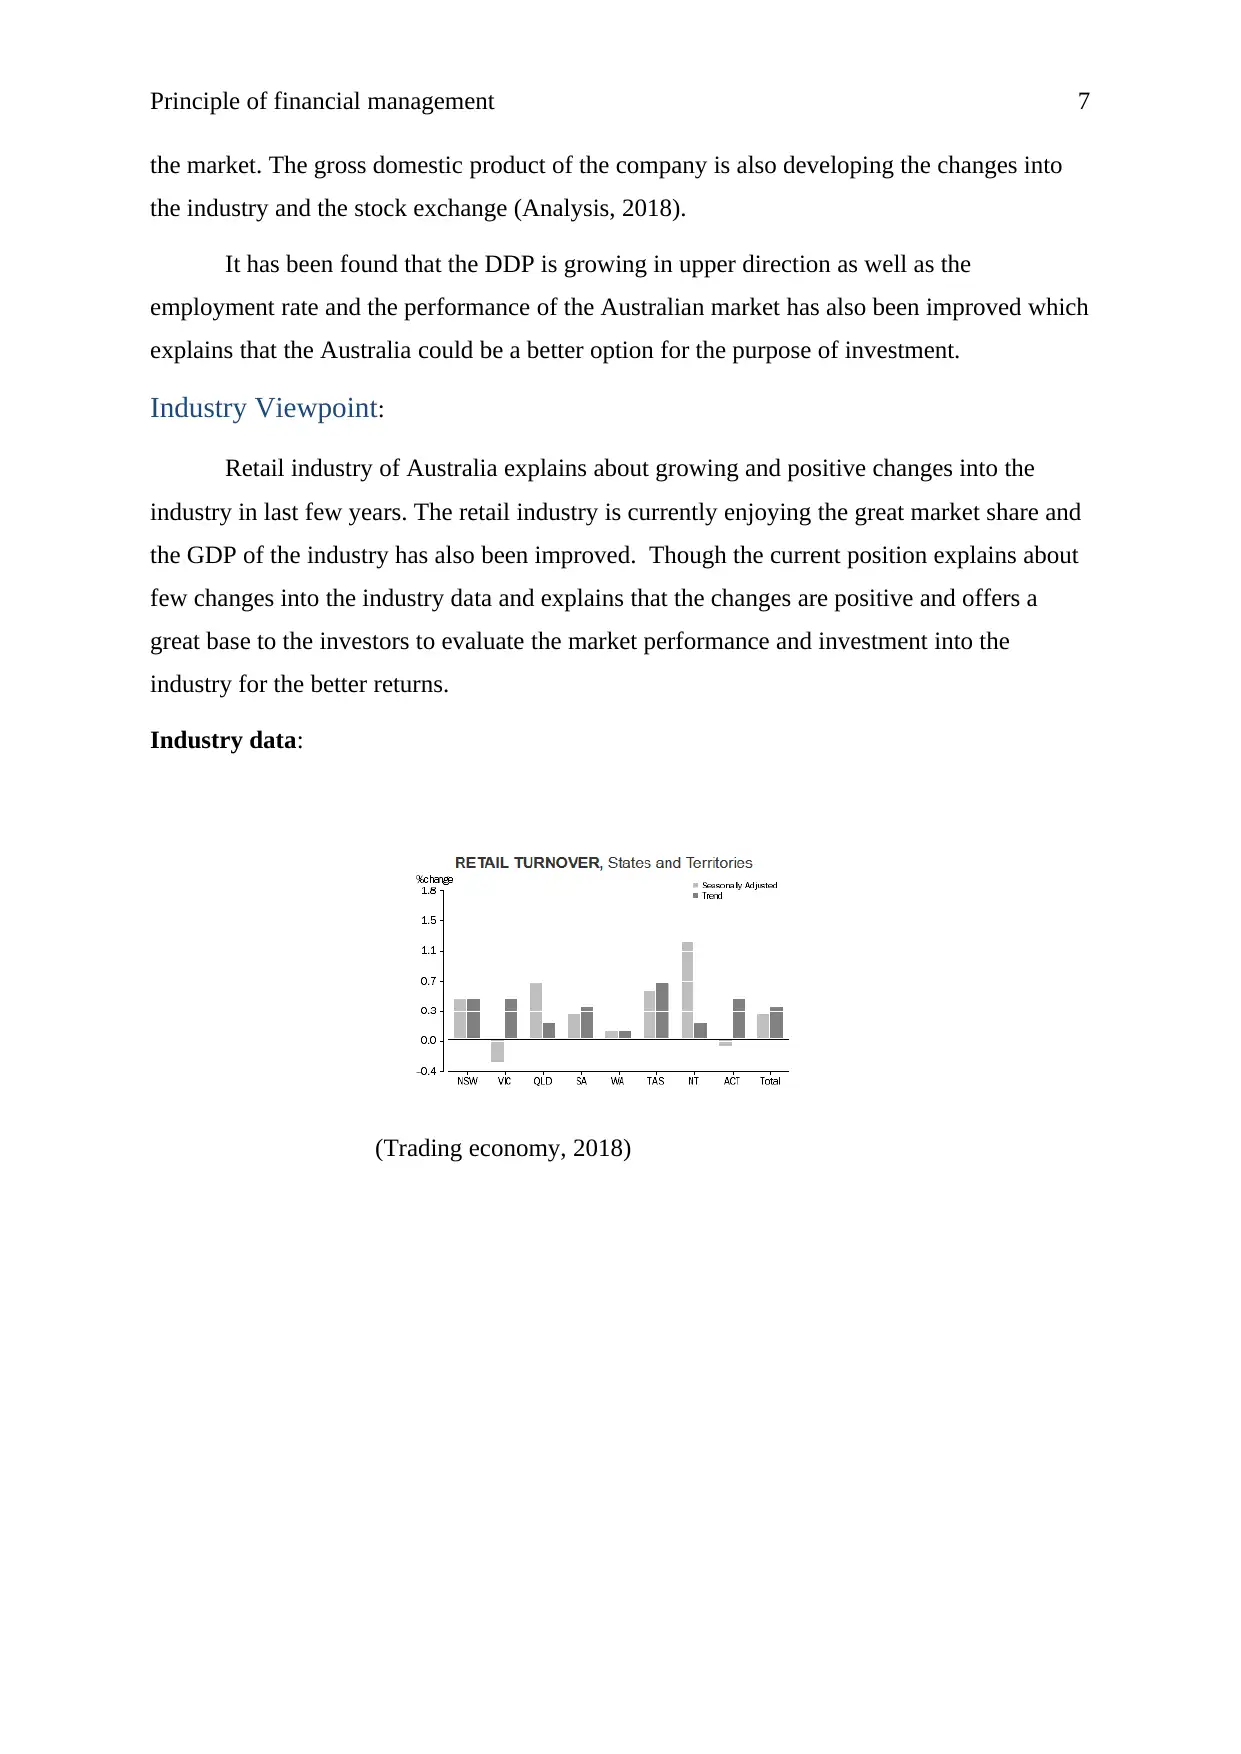
(Australian retail index, 2018)
Future Outlook:
The forecasting of Australian market and retail industry has been done on the basis of
the current trends in the market and the historical changes. On the basis of the study, it has
been found that the performance of the industry would be better in near future and it would
be quite attractive to attract enough investors towards the industry. Though, it has also been
found that the subparts of the retail industry would help the company to enhance the
performance of the company. The firms in the retail industry are also performing well and
explain about the great performance of the company in the market.
On the basis of the top down analysis, it has been investigated that the performance of
the industry is attracting now and it would more stunning on the basis of the foresting study.
It explains about the better performance and the position of the industry.
Bottom up analysis:
The fundamental study on Australian retail market has been done with the help of the
top down analysis as well as bottom up analysis method. In the analysis of bottom up method,
a particular firm and all the changes and the movements of the firm are evaluated which has
taken place into the firm. Bottom up analysis mainly works on an assumption that the
performance and the position of an organization does not bases on anything. The financial
Principle of financial management 9
and non financial performance and the factors are the only thing which affects the bottom up
analysis (Ciani, Summers and Easter, 2008).
The process and the methods of bottom up analysis are contradictory to top down
analysis. Bottom up analysis study could be performed in better way on the basis of the depth
financial evaluation of the firm. In the report, bottom up analysis study of Myer limited and
Woolworths limited has been done on the basis of the ratio analysis, financial data and the
DuPont analysis.
The tools of bottom up analysis explain about those factors which have been directly
related to the performance of the firm. The bottom up analysis study of retail industry is as
follows.
Ratio analysis:
Ratio analysis is a fundamental analysis study which explains about the financial
performance and position of the company on the basis of the various levels. This analysis is
conducted by the professionals to measure the liquidity, solvency, profitability etc position of
the company. In ratio analysis, financial statement of the company is evaluated to measure
the performance of the company. In the report, ratio analysis study has been performed on
Myer limited and Woolworths limited to measure the performance of the company.
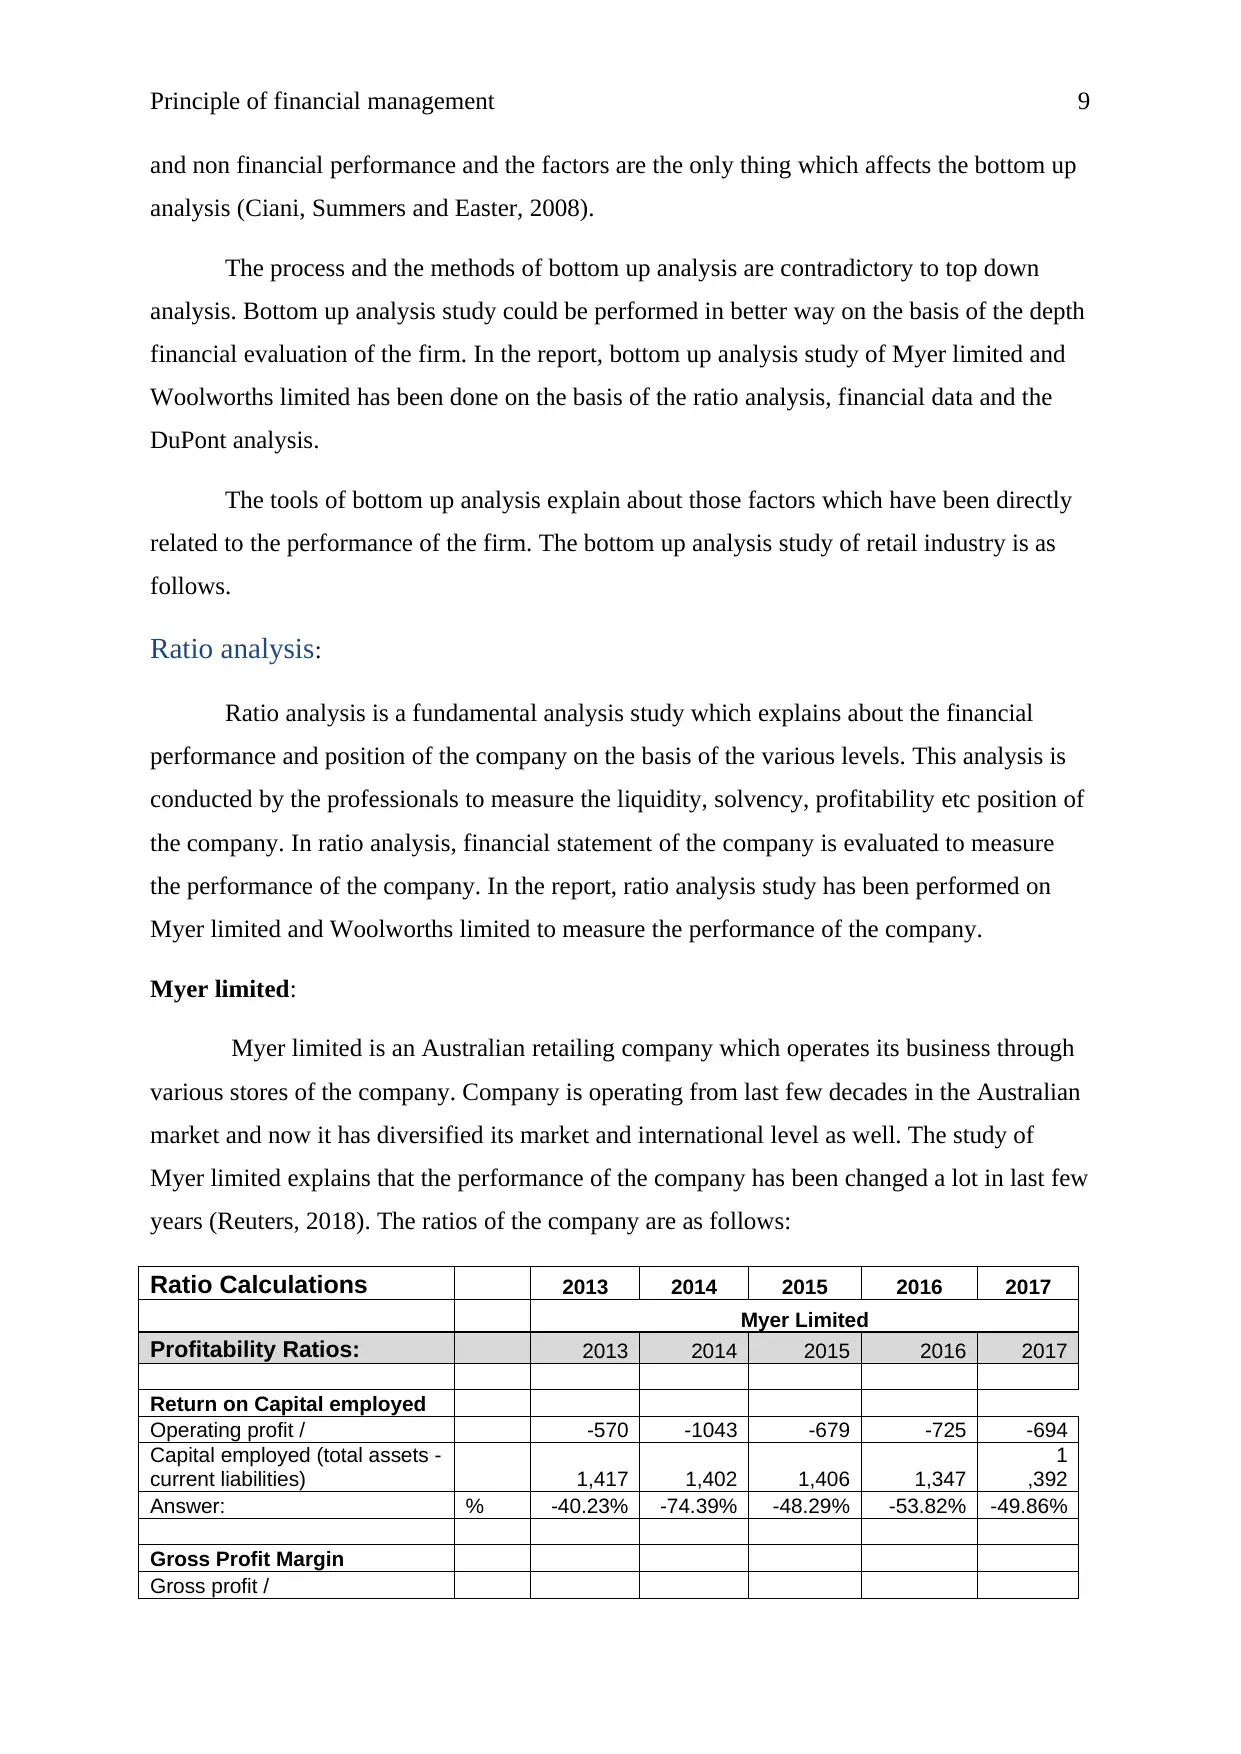
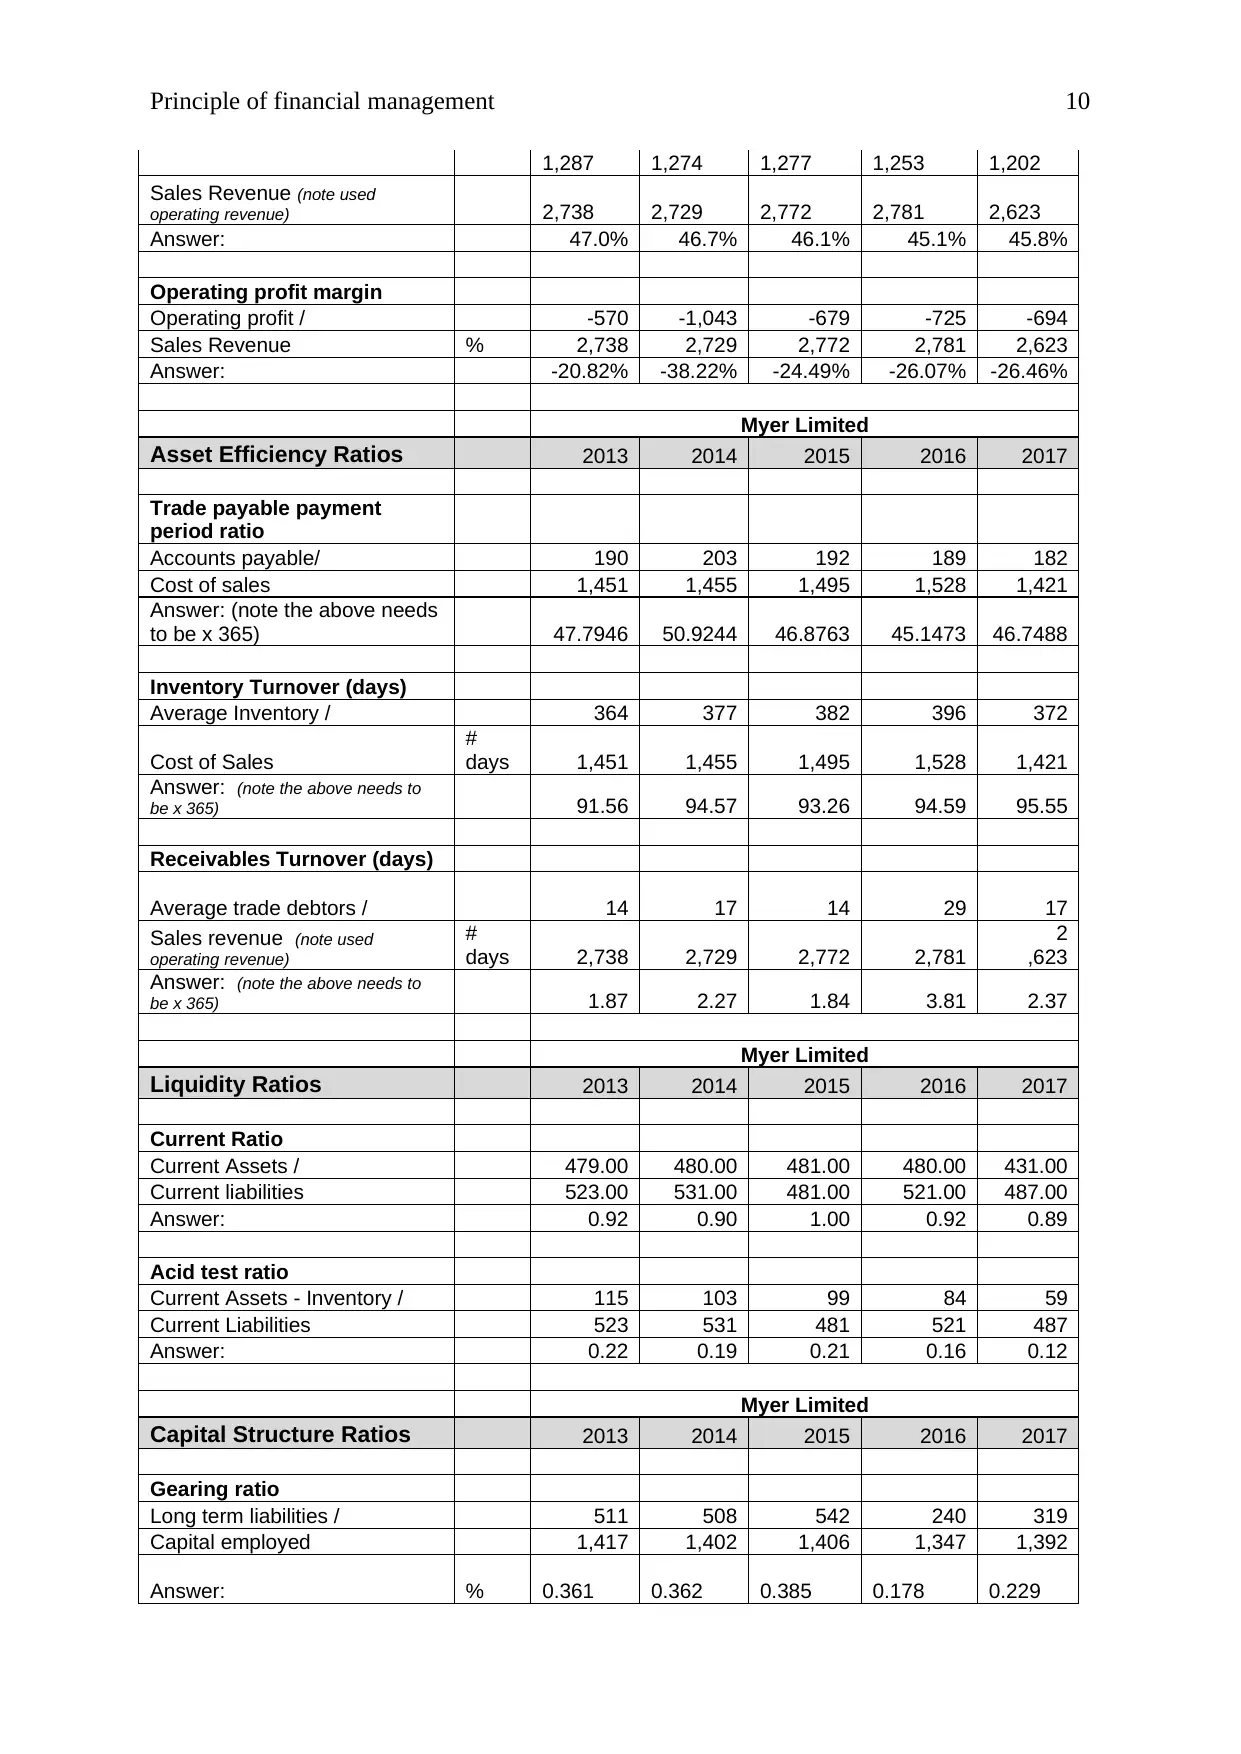
Myer limited:
Myer limited is an Australian retailing company which operates its business through
various stores of the company. Company is operating from last few decades in the Australian
market and now it has diversified its market and international level as well. The study of
Myer limited explains that the performance of the company has been changed a lot in last few
years (Reuters, 2018). The ratios of the company are as follows:
Ratio Calculations 2013 2014 2015 2016 2017
Myer Limited
Profitability Ratios: 2013 2014 2015 2016 2017
Return on Capital employed
Operating profit / -570 -1043 -679 -725 -694
Capital employed (total assets -
current liabilities) 1,417 1,402 1,406 1,347
1
,392
Answer: % -40.23% -74.39% -48.29% -53.82% -49.86%
Gross Profit Margin
Gross profit /
and non financial performance and the factors are the only thing which affects the bottom up
analysis (Ciani, Summers and Easter, 2008).
The process and the methods of bottom up analysis are contradictory to top down
analysis. Bottom up analysis study could be performed in better way on the basis of the depth
financial evaluation of the firm. In the report, bottom up analysis study of Myer limited and
Woolworths limited has been done on the basis of the ratio analysis, financial data and the
DuPont analysis.
The tools of bottom up analysis explain about those factors which have been directly
related to the performance of the firm. The bottom up analysis study of retail industry is as
follows.
Ratio analysis:
Ratio analysis is a fundamental analysis study which explains about the financial
performance and position of the company on the basis of the various levels. This analysis is
conducted by the professionals to measure the liquidity, solvency, profitability etc position of
the company. In ratio analysis, financial statement of the company is evaluated to measure
the performance of the company. In the report, ratio analysis study has been performed on
Myer limited and Woolworths limited to measure the performance of the company.
Myer limited:
Myer limited is an Australian retailing company which operates its business through
various stores of the company. Company is operating from last few decades in the Australian
market and now it has diversified its market and international level as well. The study of
Myer limited explains that the performance of the company has been changed a lot in last few
years (Reuters, 2018). The ratios of the company are as follows:
Ratio Calculations 2013 2014 2015 2016 2017
Myer Limited
Profitability Ratios: 2013 2014 2015 2016 2017
Return on Capital employed
Operating profit / -570 -1043 -679 -725 -694
Capital employed (total assets -
current liabilities) 1,417 1,402 1,406 1,347
1
,392
Answer: % -40.23% -74.39% -48.29% -53.82% -49.86%
Gross Profit Margin
Gross profit /
⊘ This is a preview!⊘
Do you want full access?
Subscribe today to unlock all pages.
Trusted by 1+ million students worldwide
Principle of financial management 10
1,287 1,274 1,277 1,253 1,202
Sales Revenue (note used
operating revenue) 2,738 2,729 2,772 2,781 2,623
Answer: 47.0% 46.7% 46.1% 45.1% 45.8%
Operating profit margin
Operating profit / -570 -1,043 -679 -725 -694
Sales Revenue % 2,738 2,729 2,772 2,781 2,623
Answer: -20.82% -38.22% -24.49% -26.07% -26.46%
Myer Limited
Asset Efficiency Ratios 2013 2014 2015 2016 2017
Trade payable payment
period ratio
Accounts payable/ 190 203 192 189 182
Cost of sales 1,451 1,455 1,495 1,528 1,421
Answer: (note the above needs
to be x 365) 47.7946 50.9244 46.8763 45.1473 46.7488
Inventory Turnover (days)
Average Inventory / 364 377 382 396 372
Cost of Sales
#
days 1,451 1,455 1,495 1,528 1,421
Answer: (note the above needs to
be x 365) 91.56 94.57 93.26 94.59 95.55
Receivables Turnover (days)
Average trade debtors / 14 17 14 29 17
Sales revenue (note used
operating revenue)
#
days 2,738 2,729 2,772 2,781
2
,623
Answer: (note the above needs to
be x 365) 1.87 2.27 1.84 3.81 2.37
Myer Limited
Liquidity Ratios 2013 2014 2015 2016 2017
Current Ratio
Current Assets / 479.00 480.00 481.00 480.00 431.00
Current liabilities 523.00 531.00 481.00 521.00 487.00
Answer: 0.92 0.90 1.00 0.92 0.89
Acid test ratio
Current Assets - Inventory / 115 103 99 84 59
Current Liabilities 523 531 481 521 487
Answer: 0.22 0.19 0.21 0.16 0.12
Myer Limited
Capital Structure Ratios 2013 2014 2015 2016 2017
Gearing ratio
Long term liabilities / 511 508 542 240 319
Capital employed 1,417 1,402 1,406 1,347 1,392
Answer: % 0.361 0.362 0.385 0.178 0.229
Paraphrase This Document
Need a fresh take? Get an instant paraphrase of this document with our AI Paraphraser
Principle of financial management 11
Interest Coverage Ratio
EBIT / -570.00
-
1,043.00 -679.00 -725.00 -694.00
Net Finance Costs (used net
interest expense) 30 23 23 15 11
Answer:
times
p.a
-
19.000
-
45.348
-
29.522
-
48.333
-
63.091
Myer Limited
Investor's Ratios 2013 2014 2015 2016 2017
Earnings per share
Net income 127 98 30 61 12
Weighted average shares
outstanding 729 585 586 787 821
Answer: 0.174 0.168 0.051 0.078 0.015
Dividend coverage ratio
Net income / 127 98 30 61 12
Dividend paid to shareholders 113 99 73 16 49
Answer: 1.124 0.990 0.411 3.813
0
.245
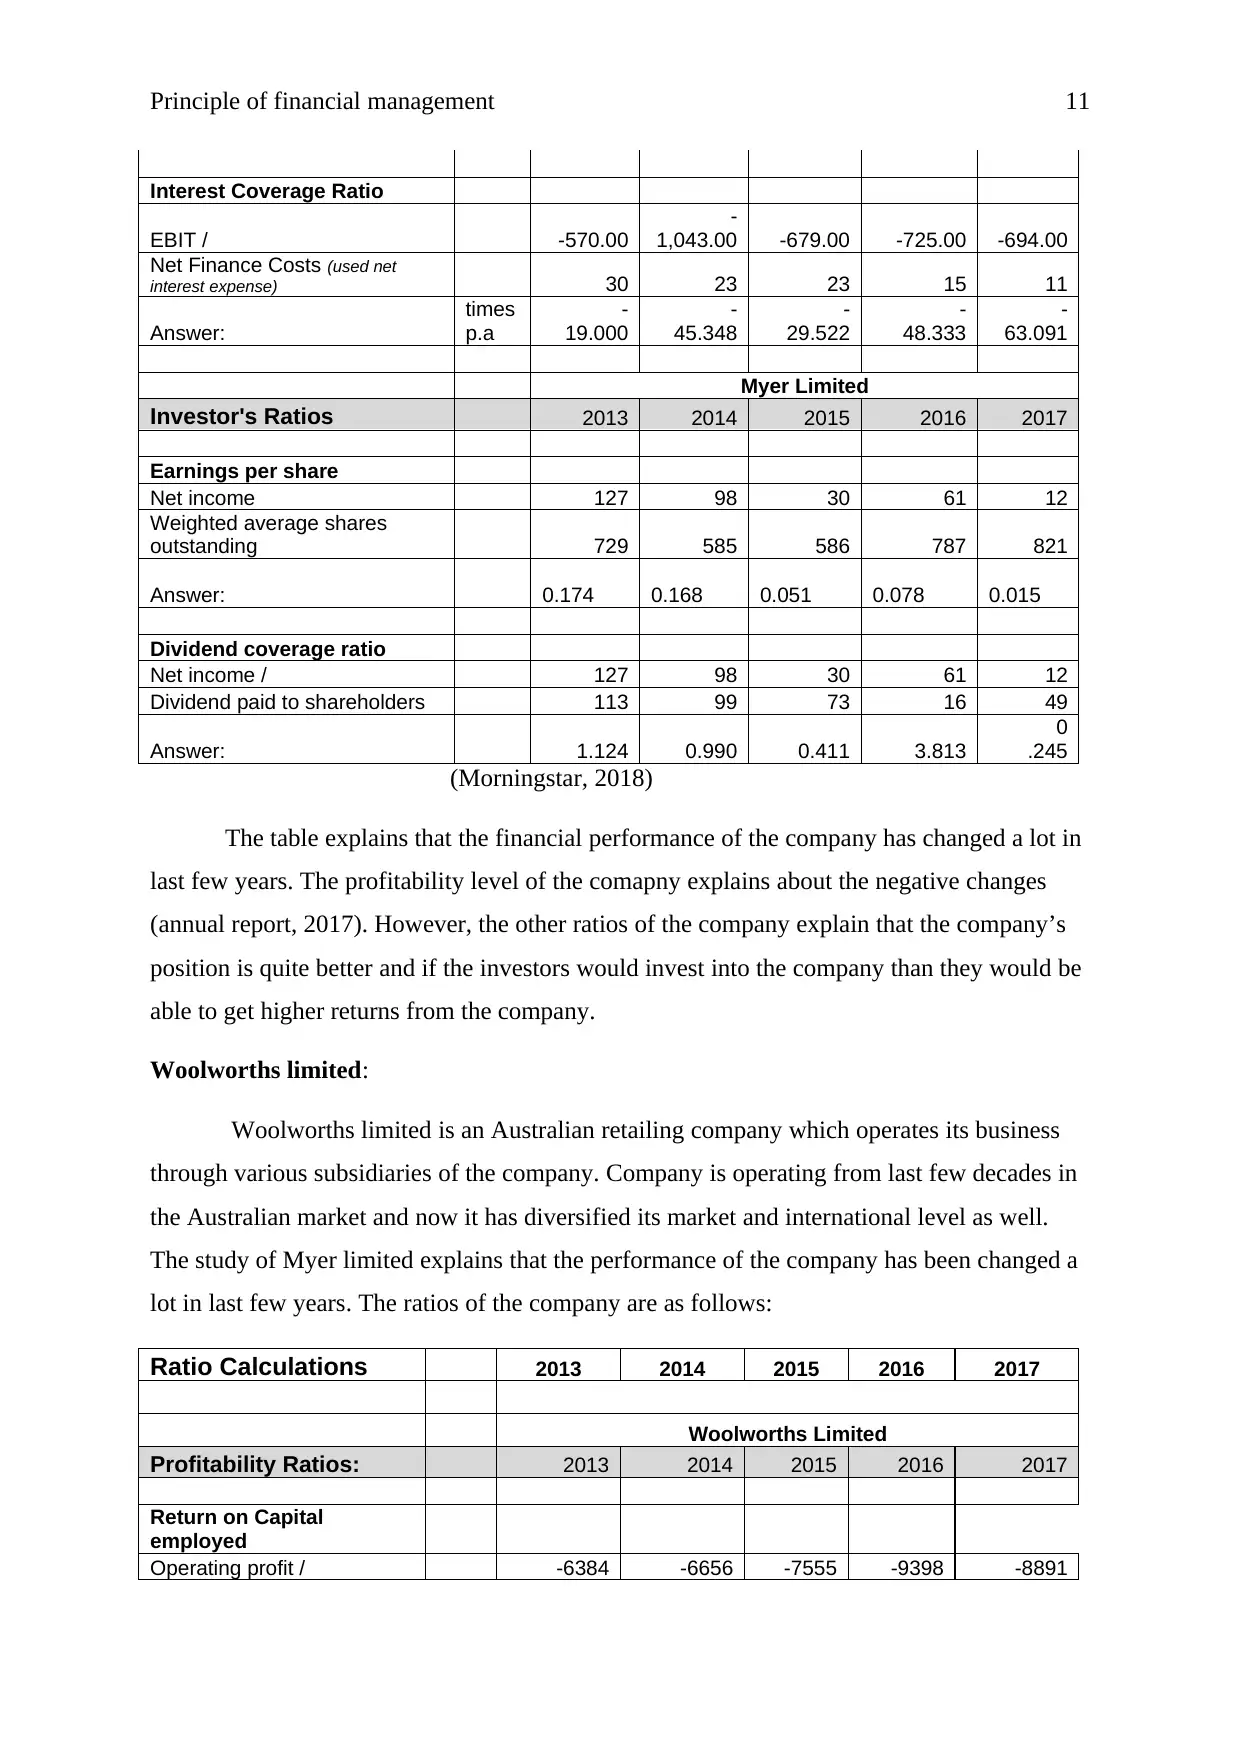
(Morningstar, 2018)
The table explains that the financial performance of the company has changed a lot in
last few years. The profitability level of the comapny explains about the negative changes
(annual report, 2017). However, the other ratios of the company explain that the company’s
position is quite better and if the investors would invest into the company than they would be
able to get higher returns from the company.
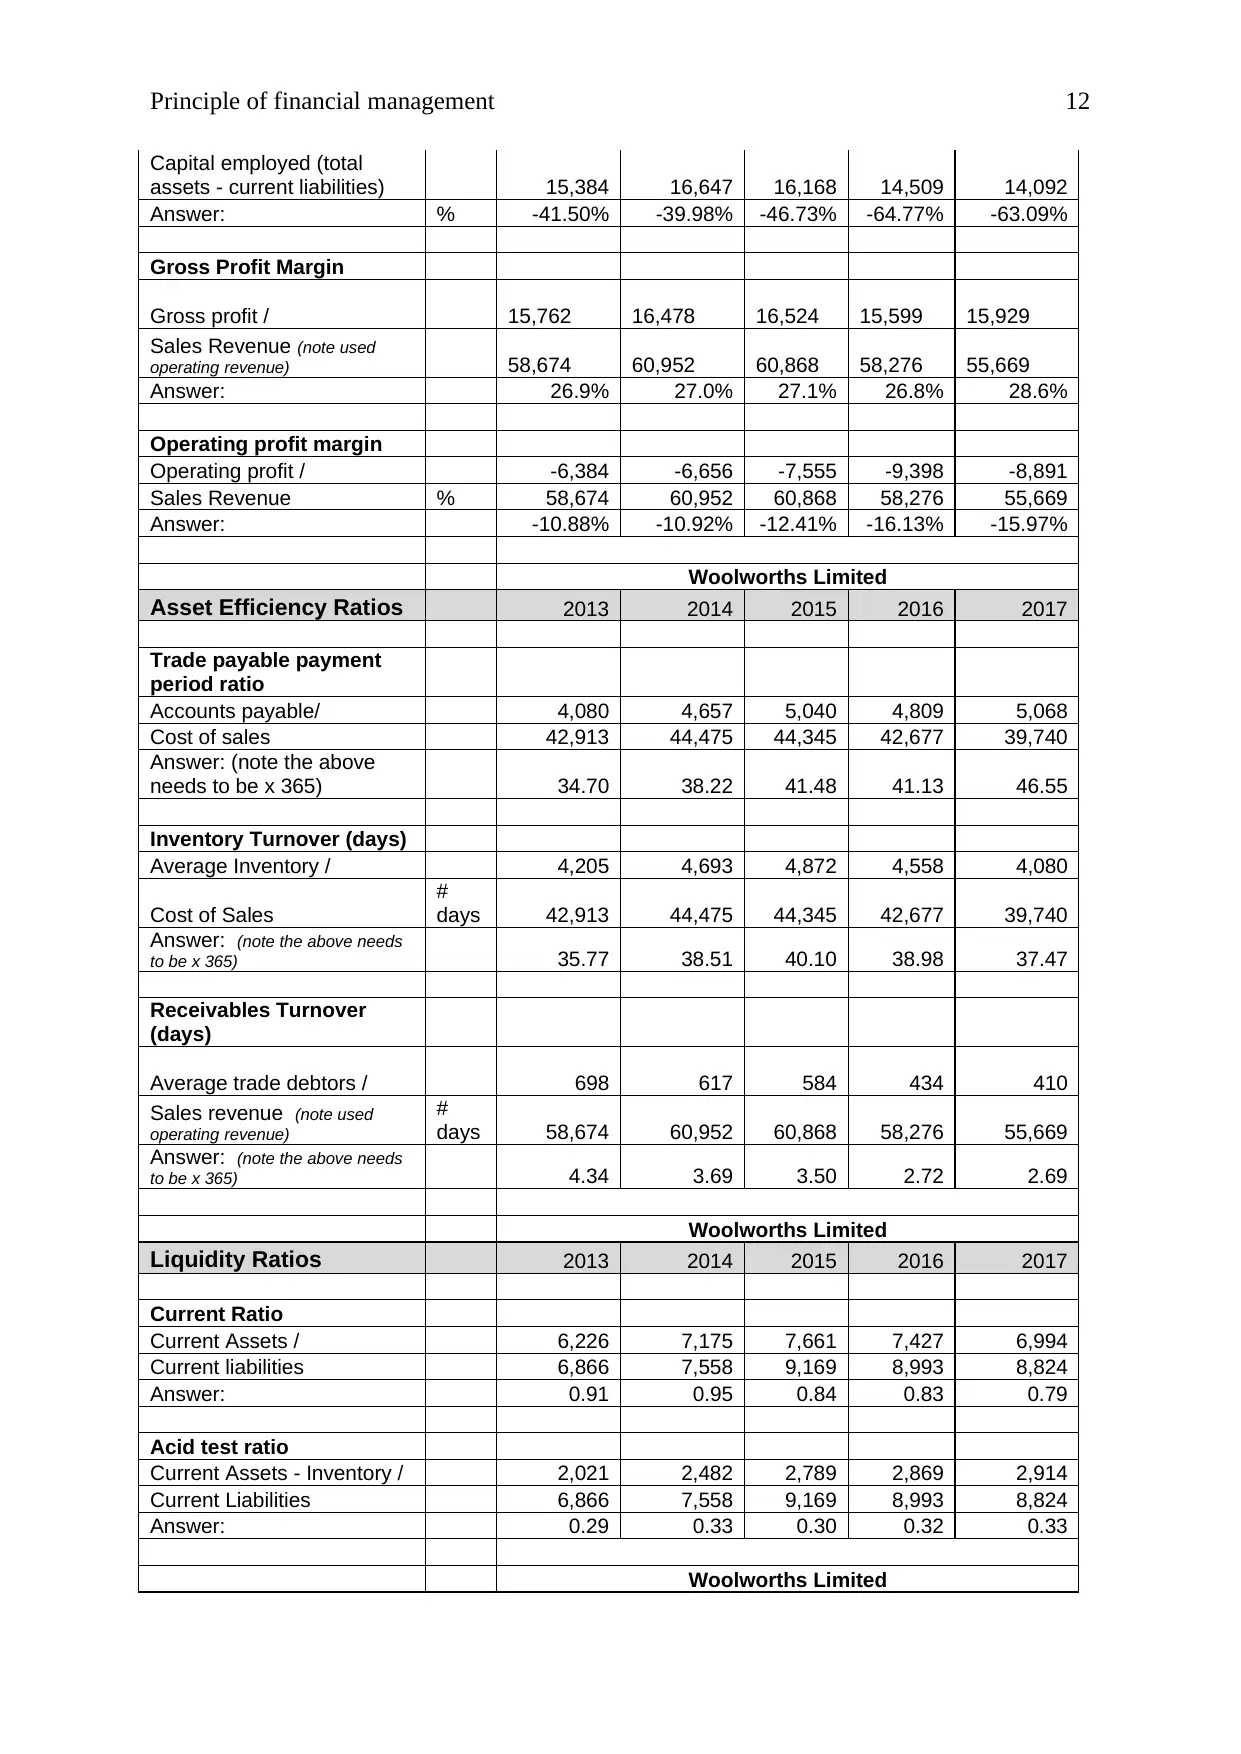
Woolworths limited:
Woolworths limited is an Australian retailing company which operates its business
through various subsidiaries of the company. Company is operating from last few decades in
the Australian market and now it has diversified its market and international level as well.
The study of Myer limited explains that the performance of the company has been changed a
lot in last few years. The ratios of the company are as follows:
Ratio Calculations 2013 2014 2015 2016 2017
Woolworths Limited
Profitability Ratios: 2013 2014 2015 2016 2017
Return on Capital
employed
Operating profit / -6384 -6656 -7555 -9398 -8891
Interest Coverage Ratio
EBIT / -570.00
-
1,043.00 -679.00 -725.00 -694.00
Net Finance Costs (used net
interest expense) 30 23 23 15 11
Answer:
times
p.a
-
19.000
-
45.348
-
29.522
-
48.333
-
63.091
Myer Limited
Investor's Ratios 2013 2014 2015 2016 2017
Earnings per share
Net income 127 98 30 61 12
Weighted average shares
outstanding 729 585 586 787 821
Answer: 0.174 0.168 0.051 0.078 0.015
Dividend coverage ratio
Net income / 127 98 30 61 12
Dividend paid to shareholders 113 99 73 16 49
Answer: 1.124 0.990 0.411 3.813
0
.245
(Morningstar, 2018)
The table explains that the financial performance of the company has changed a lot in
last few years. The profitability level of the comapny explains about the negative changes
(annual report, 2017). However, the other ratios of the company explain that the company’s
position is quite better and if the investors would invest into the company than they would be
able to get higher returns from the company.
Woolworths limited:
Woolworths limited is an Australian retailing company which operates its business
through various subsidiaries of the company. Company is operating from last few decades in
the Australian market and now it has diversified its market and international level as well.
The study of Myer limited explains that the performance of the company has been changed a
lot in last few years. The ratios of the company are as follows:
Ratio Calculations 2013 2014 2015 2016 2017
Woolworths Limited
Profitability Ratios: 2013 2014 2015 2016 2017
Return on Capital
employed
Operating profit / -6384 -6656 -7555 -9398 -8891
Principle of financial management 12
Capital employed (total
assets - current liabilities) 15,384 16,647 16,168 14,509 14,092
Answer: % -41.50% -39.98% -46.73% -64.77% -63.09%
Gross Profit Margin
Gross profit / 15,762 16,478 16,524 15,599 15,929
Sales Revenue (note used
operating revenue) 58,674 60,952 60,868 58,276 55,669
Answer: 26.9% 27.0% 27.1% 26.8% 28.6%
Operating profit margin
Operating profit / -6,384 -6,656 -7,555 -9,398 -8,891
Sales Revenue % 58,674 60,952 60,868 58,276 55,669
Answer: -10.88% -10.92% -12.41% -16.13% -15.97%
Woolworths Limited
Asset Efficiency Ratios 2013 2014 2015 2016 2017
Trade payable payment
period ratio
Accounts payable/ 4,080 4,657 5,040 4,809 5,068
Cost of sales 42,913 44,475 44,345 42,677 39,740
Answer: (note the above
needs to be x 365) 34.70 38.22 41.48 41.13 46.55
Inventory Turnover (days)
Average Inventory / 4,205 4,693 4,872 4,558 4,080
Cost of Sales
#
days 42,913 44,475 44,345 42,677 39,740
Answer: (note the above needs
to be x 365) 35.77 38.51 40.10 38.98 37.47
Receivables Turnover
(days)
Average trade debtors / 698 617 584 434 410
Sales revenue (note used
operating revenue)
#
days 58,674 60,952 60,868 58,276 55,669
Answer: (note the above needs
to be x 365) 4.34 3.69 3.50 2.72 2.69
Woolworths Limited
Liquidity Ratios 2013 2014 2015 2016 2017
Current Ratio
Current Assets / 6,226 7,175 7,661 7,427 6,994
Current liabilities 6,866 7,558 9,169 8,993 8,824
Answer: 0.91 0.95 0.84 0.83 0.79
Acid test ratio
Current Assets - Inventory / 2,021 2,482 2,789 2,869 2,914
Current Liabilities 6,866 7,558 9,169 8,993 8,824
Answer: 0.29 0.33 0.30 0.32 0.33
Woolworths Limited
⊘ This is a preview!⊘
Do you want full access?
Subscribe today to unlock all pages.
Trusted by 1+ million students worldwide
1 out of 15
Related Documents


Your All-in-One AI-Powered Toolkit for Academic Success.
+13062052269
info@desklib.com
Available 24*7 on WhatsApp / Email
![[object Object]](/_next/static/media/star-bottom.7253800d.svg)
Unlock your academic potential
Copyright © 2020–2026 A2Z Services. All Rights Reserved. Developed and managed by ZUCOL.