University of East London: Halfords Plc Financial Performance Analysis
VerifiedAdded on 2022/08/25
|15
|4062
|20
Report
AI Summary
This report provides a detailed analysis of Halfords Plc's financial performance, focusing on the period of four years. The analysis employs ratio analysis to assess the company's liquidity, profitability, efficiency, and market performance. The report calculates and interprets key financial ratios such as return on capital employed, operating profit margin, gross profit margin, current ratio, acid test ratio, accounts payable turnover, accounts receivable turnover, inventory turnover, earnings per share, and price-earnings ratio. The analysis reveals trends and fluctuations in these ratios, offering insights into the company's financial health and operational efficiency. The report concludes with a recommendation for potential investors seeking to invest in Halfords Plc, based on the overall financial performance assessment. The report also includes tables and graphs to visually represent the financial data and trends.
0
Running head: ACCOUNTING
Accounting
Name of the Student
Name of the University
Author Note
Student number:
Running head: ACCOUNTING
Accounting
Name of the Student
Name of the University
Author Note
Student number:
Paraphrase This Document
Need a fresh take? Get an instant paraphrase of this document with our AI Paraphraser
1
ACCOUNTING
Abstract:
The paper reviews the financial performance of a company operating in retail sector
of United Kingdom that is listed on the London Stock exchange. The chosen
company for the analysis of the financial performance is Hanford Plc. The financial
performance is assessed in terms of liquidity, profitability, efficiency and market
ratios for over a time period of four years. Based on the overall analysis of Hanford
Plc, it is recommended to the potential investors seeking to make investment of
amount £ 3 million to wait for a while before making investment. Although, the falling
value of few ratios indicating the profitability and efficiency position of company does
not implies the poor financial performance of the company.
Student number:
2
ACCOUNTING
Table of Contents
Introduction:..................................................................................................................3
Discussion:...................................................................................................................3
Calculating the appropriate financial ratios of Halfords Plc for the period of four
years:............................................................................................................................3
Discussing the advantages and disadvantages of financial ratios:............................11
Discussing the source of finance of chosen company:..............................................12
Briefly discussing the report presented by the auditor:..............................................12
Conclusion:.................................................................................................................13
Appendix:....................................................................................................................14
References list:...........................................................................................................15
Student number:
⊘ This is a preview!⊘
Do you want full access?
Subscribe today to unlock all pages.
Trusted by 1+ million students worldwide
3
ACCOUNTING
Introduction:
The report is prepared to evaluate the financial performance of a company
operating in the retail sector of the United Kingdom. Financial position of the
company is assessed for providing information about the customers, business and
suppliers to the investors seeking investment of amount £ 3 million. For the analysis
of the financial information, the chosen organization is Halfords Plc that is listed on
the London stock exchange. Halfords is the leading retailer of cycling, motoring and
leisure services and products of United Kingdom (Halfordscompany.com 2020). A
clear plan is adopted by the company that intends to drive the business towards long
term sustainable growth. The principal operation of the company is in the markets of
cycling and motoring. The motoring market generates more than half of the sales of
group and the remaining generated from cycling. The sales growth of Halfords has
been good because of improvement in the ranges of products introduced and new in
store services despite the challenging environment of business. In addition to this,
there was a growth in retail sales by 14% (Halfordscompany.com 2020). Increased
cost of labour and fluctuation in currency has adversely impacted the earnings of
business. The company rests on the policy of paying an increasing dividends to their
shareholders.
Discussion:
Calculating the appropriate financial ratios of Halfords Plc for the period of
four years:
In this section of the report, a detailed evaluation of the financial performance
of Halfords Plc over the time period of four years is demonstrated. The financial
performance of the company is assessed in terms of liquidity position, profitability
position, efficiency position and market performance using ratio analysis technique.
Ratio analysis helps in identifying the trend of the financial performance and
facilitates the comparison over a period of time and assist in the investment decision
making (Merkl et al. 2017).
Profitability ratios:
Student number:
Paraphrase This Document
Need a fresh take? Get an instant paraphrase of this document with our AI Paraphraser
4
ACCOUNTING
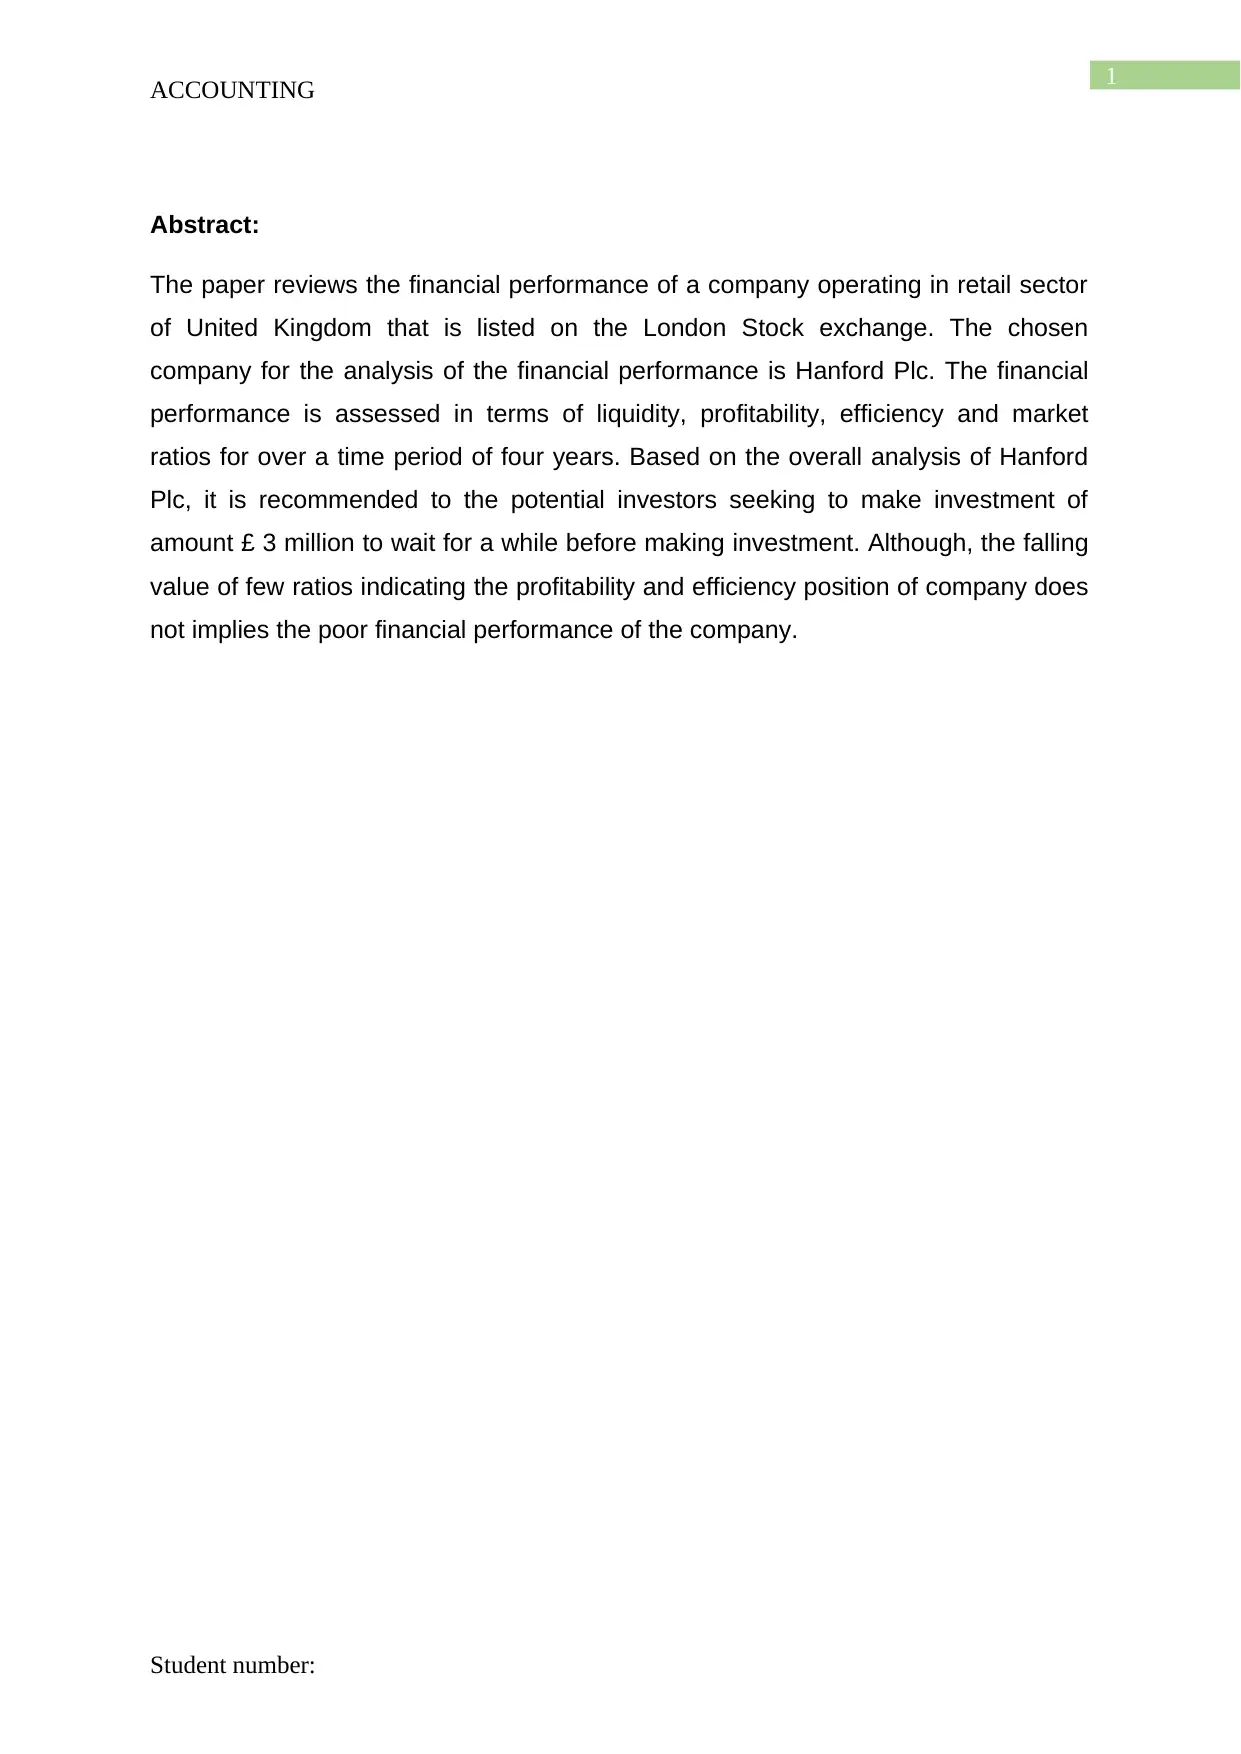
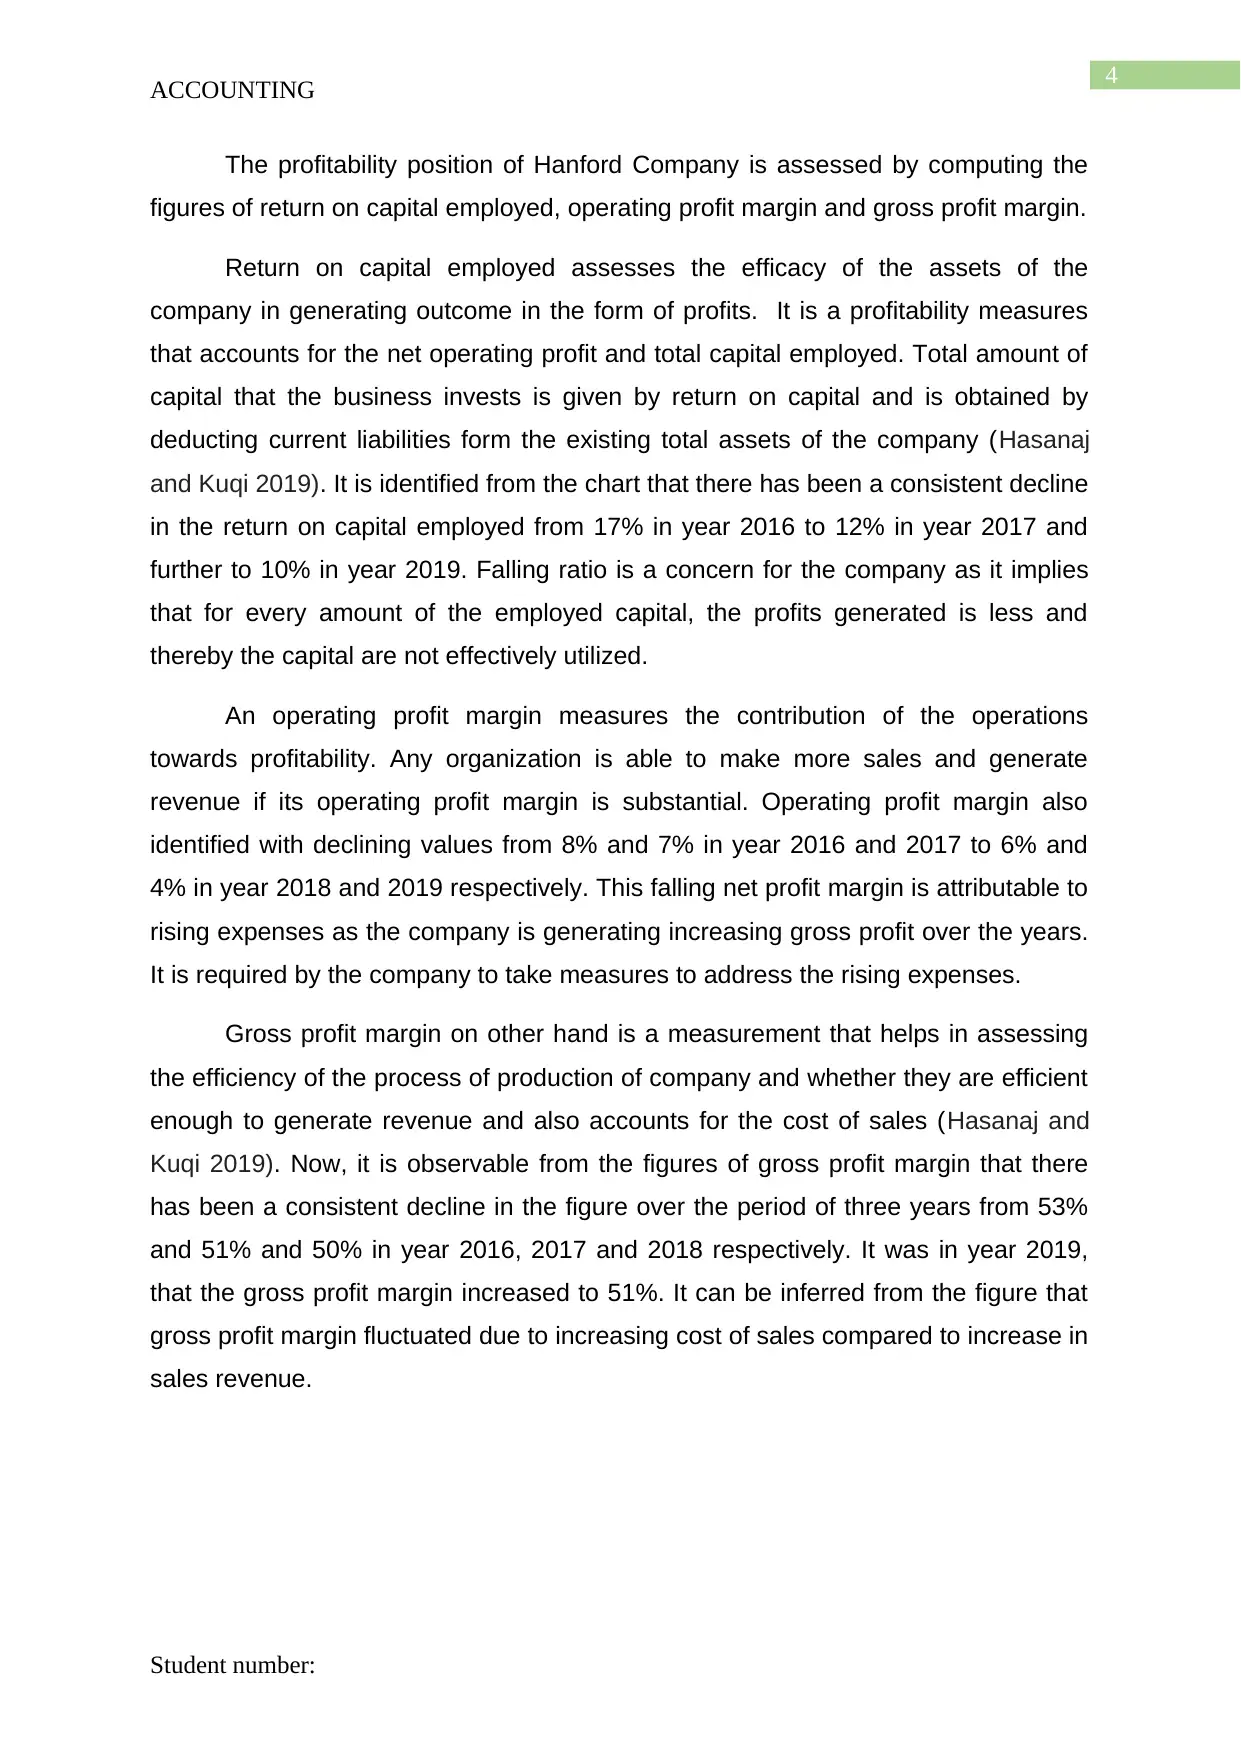
The profitability position of Hanford Company is assessed by computing the
figures of return on capital employed, operating profit margin and gross profit margin.
Return on capital employed assesses the efficacy of the assets of the
company in generating outcome in the form of profits. It is a profitability measures
that accounts for the net operating profit and total capital employed. Total amount of
capital that the business invests is given by return on capital and is obtained by
deducting current liabilities form the existing total assets of the company (Hasanaj
and Kuqi 2019). It is identified from the chart that there has been a consistent decline
in the return on capital employed from 17% in year 2016 to 12% in year 2017 and
further to 10% in year 2019. Falling ratio is a concern for the company as it implies
that for every amount of the employed capital, the profits generated is less and
thereby the capital are not effectively utilized.
An operating profit margin measures the contribution of the operations
towards profitability. Any organization is able to make more sales and generate
revenue if its operating profit margin is substantial. Operating profit margin also
identified with declining values from 8% and 7% in year 2016 and 2017 to 6% and
4% in year 2018 and 2019 respectively. This falling net profit margin is attributable to
rising expenses as the company is generating increasing gross profit over the years.
It is required by the company to take measures to address the rising expenses.
Gross profit margin on other hand is a measurement that helps in assessing
the efficiency of the process of production of company and whether they are efficient
enough to generate revenue and also accounts for the cost of sales (Hasanaj and
Kuqi 2019). Now, it is observable from the figures of gross profit margin that there
has been a consistent decline in the figure over the period of three years from 53%
and 51% and 50% in year 2016, 2017 and 2018 respectively. It was in year 2019,
that the gross profit margin increased to 51%. It can be inferred from the figure that
gross profit margin fluctuated due to increasing cost of sales compared to increase in
sales revenue.
Student number:
ACCOUNTING
The profitability position of Hanford Company is assessed by computing the
figures of return on capital employed, operating profit margin and gross profit margin.
Return on capital employed assesses the efficacy of the assets of the
company in generating outcome in the form of profits. It is a profitability measures
that accounts for the net operating profit and total capital employed. Total amount of
capital that the business invests is given by return on capital and is obtained by
deducting current liabilities form the existing total assets of the company (Hasanaj
and Kuqi 2019). It is identified from the chart that there has been a consistent decline
in the return on capital employed from 17% in year 2016 to 12% in year 2017 and
further to 10% in year 2019. Falling ratio is a concern for the company as it implies
that for every amount of the employed capital, the profits generated is less and
thereby the capital are not effectively utilized.
An operating profit margin measures the contribution of the operations
towards profitability. Any organization is able to make more sales and generate
revenue if its operating profit margin is substantial. Operating profit margin also
identified with declining values from 8% and 7% in year 2016 and 2017 to 6% and
4% in year 2018 and 2019 respectively. This falling net profit margin is attributable to
rising expenses as the company is generating increasing gross profit over the years.
It is required by the company to take measures to address the rising expenses.
Gross profit margin on other hand is a measurement that helps in assessing
the efficiency of the process of production of company and whether they are efficient
enough to generate revenue and also accounts for the cost of sales (Hasanaj and
Kuqi 2019). Now, it is observable from the figures of gross profit margin that there
has been a consistent decline in the figure over the period of three years from 53%
and 51% and 50% in year 2016, 2017 and 2018 respectively. It was in year 2019,
that the gross profit margin increased to 51%. It can be inferred from the figure that
gross profit margin fluctuated due to increasing cost of sales compared to increase in
sales revenue.
Student number:
5
ACCOUNTING
51 67.1 71.4 79.8
0%
10%
20%
30%
40%
50%
60%
10% 12% 13% 17%
4% 6% 7% 8%
51% 50% 51% 53%
Profitability ratios
Return on capital employed Operating profit margin Gross profit margin
Graph 1:
Liquidity ratios:
Liquidity position of Hanford Company is analysed by computing ratios such
as current ratio and acid test ratio. The measurement of the liquid ratios helps in
evaluating the ability of the company to meet their short term liabilities using their
total current assets. This implies whether the business can further raise the cash
from elsewhere. It is always favourable for the business to have adequate current
assets so that their liabilities can be paid off in shorter duration (Arkan 2016).
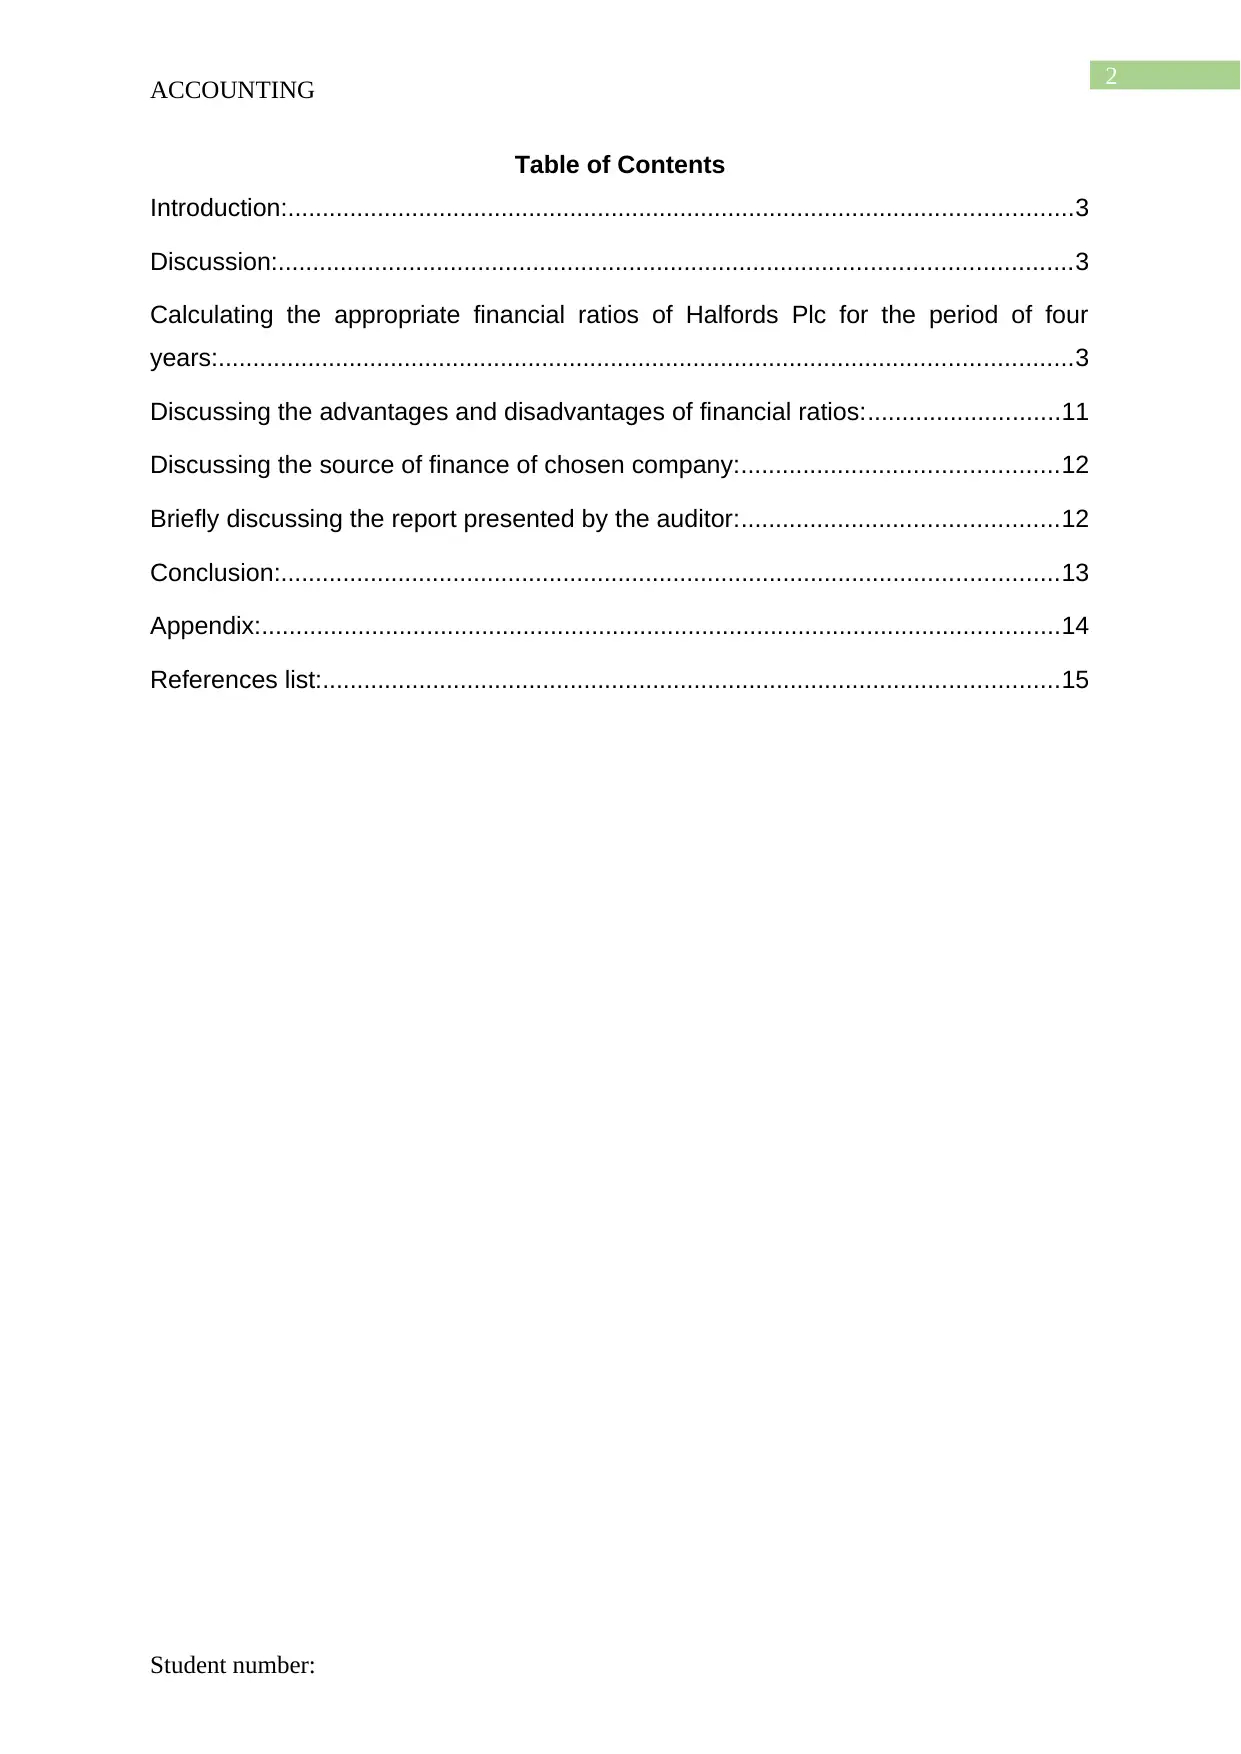
Current ratio is a measurement of the liquidity position of the company by
assessing the ability of the company to pay off their obligations using their existing
current assets (Linares et al. 2017). Current ratio of Hanford has been computed for
the four consecutive years and it is identified from the chart presented below that in
the initial years of analysis, ratio is recorded at 1.05 and 1.1 in year 2016 and 2017
and this further increased to 1.22 in year 2017 and then again declined to 1.20 in
year 2018. It is preferable to have higher values of current ratio and therefore an
increase in current ratio over the years for Hanford is desirable. The reason is that
the existing current debt payment of the company can be paid off easily when there
is adequate current assets. It also implies that the operation is generating enough
cash so that it covers the current debt obligations and there do not exist any burden
on fixed assets.
Student number:
ACCOUNTING
51 67.1 71.4 79.8
0%
10%
20%
30%
40%
50%
60%
10% 12% 13% 17%
4% 6% 7% 8%
51% 50% 51% 53%
Profitability ratios
Return on capital employed Operating profit margin Gross profit margin
Graph 1:
Liquidity ratios:
Liquidity position of Hanford Company is analysed by computing ratios such
as current ratio and acid test ratio. The measurement of the liquid ratios helps in
evaluating the ability of the company to meet their short term liabilities using their
total current assets. This implies whether the business can further raise the cash
from elsewhere. It is always favourable for the business to have adequate current
assets so that their liabilities can be paid off in shorter duration (Arkan 2016).
Current ratio is a measurement of the liquidity position of the company by
assessing the ability of the company to pay off their obligations using their existing
current assets (Linares et al. 2017). Current ratio of Hanford has been computed for
the four consecutive years and it is identified from the chart presented below that in
the initial years of analysis, ratio is recorded at 1.05 and 1.1 in year 2016 and 2017
and this further increased to 1.22 in year 2017 and then again declined to 1.20 in
year 2018. It is preferable to have higher values of current ratio and therefore an
increase in current ratio over the years for Hanford is desirable. The reason is that
the existing current debt payment of the company can be paid off easily when there
is adequate current assets. It also implies that the operation is generating enough
cash so that it covers the current debt obligations and there do not exist any burden
on fixed assets.
Student number:
⊘ This is a preview!⊘
Do you want full access?
Subscribe today to unlock all pages.
Trusted by 1+ million students worldwide
6
ACCOUNTING
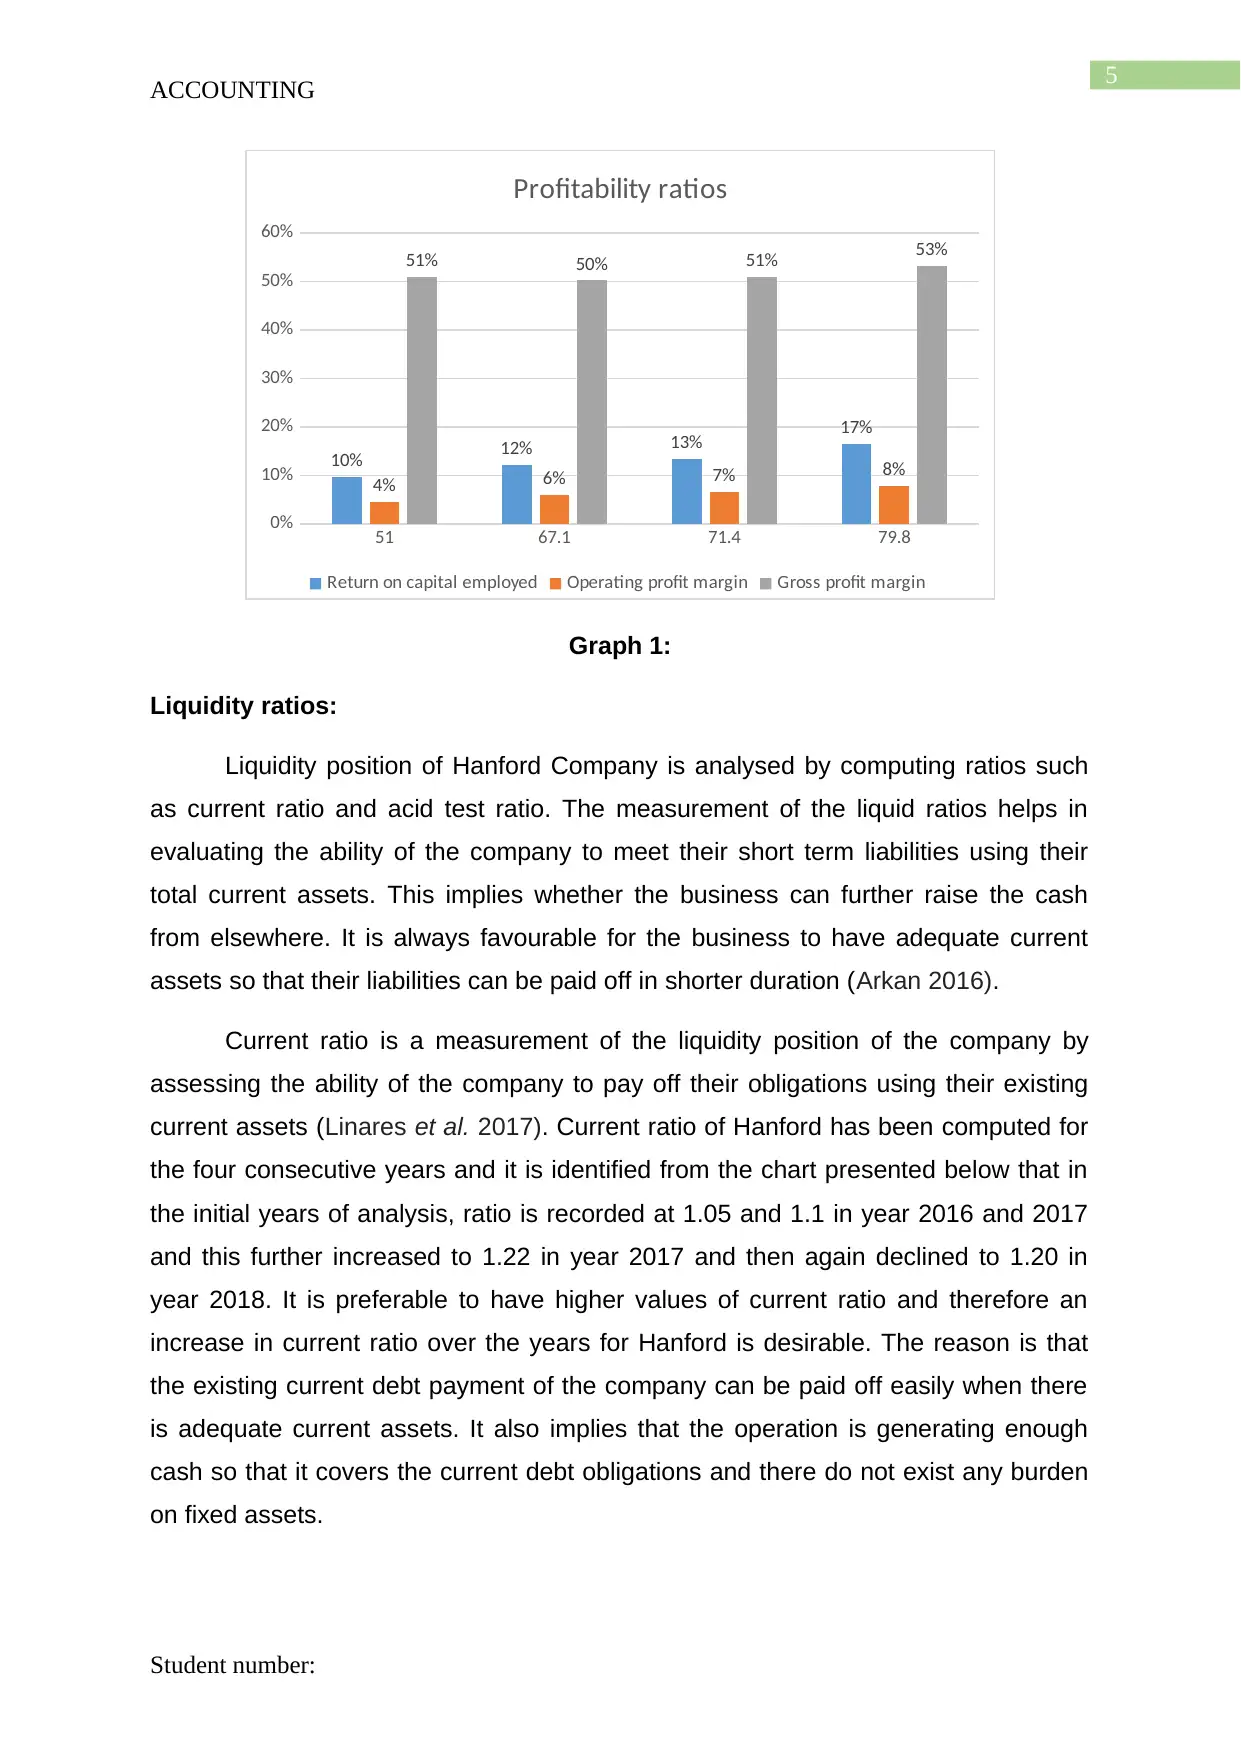
Acid test ratio assesses the company’s ability in meeting their current debt
obligation using the quick assets. It is desirable to have higher ratio as this implies
that the current debt payment of the business is less than its quick assets and there
is no need to sell of the long term assets (Franklin et al. 2018). Now, looking at the
computed figures of acid test ratio, it is observed that there has been fluctuation in
the figures as it initially decreased and then increased and decreased further. Acid
test ratio is recorded at 0.34 in year 2016 and it declined to 0.32 in year 2017 and
there was an increase in figure to 0.36 in year 2018 and then decline to 0.32 in year
2019.
2019 2018 2017 2016
0.00
0.20
0.40
0.60
0.80
1.00
1.20
1.40
1.20 1.22
1.10 1.05
0.34 0.36 0.32 0.34
Liquidity ratio
Current ratio Acid test ratio
Graph 2:
Efficiency ratios:
Efficiency ratio is known with another name known as activity ratio that
measures the ability of the company to utilize their assets to produce income. The
ability of the company to employ their resources effectively is analysed by the
computation of efficiency ratios. It is regarded as one of the important measures
assessing the long and short term performance of the company (Apostolou et al.
2018). Efficiency position of the Halford is analysed by computing ratios such as
inventory turnover ratio, debtor’s turnover and accounts payable turnover ratio.
Student number:
ACCOUNTING
Acid test ratio assesses the company’s ability in meeting their current debt
obligation using the quick assets. It is desirable to have higher ratio as this implies
that the current debt payment of the business is less than its quick assets and there
is no need to sell of the long term assets (Franklin et al. 2018). Now, looking at the
computed figures of acid test ratio, it is observed that there has been fluctuation in
the figures as it initially decreased and then increased and decreased further. Acid
test ratio is recorded at 0.34 in year 2016 and it declined to 0.32 in year 2017 and
there was an increase in figure to 0.36 in year 2018 and then decline to 0.32 in year
2019.
2019 2018 2017 2016
0.00
0.20
0.40
0.60
0.80
1.00
1.20
1.40
1.20 1.22
1.10 1.05
0.34 0.36 0.32 0.34
Liquidity ratio
Current ratio Acid test ratio
Graph 2:
Efficiency ratios:
Efficiency ratio is known with another name known as activity ratio that
measures the ability of the company to utilize their assets to produce income. The
ability of the company to employ their resources effectively is analysed by the
computation of efficiency ratios. It is regarded as one of the important measures
assessing the long and short term performance of the company (Apostolou et al.
2018). Efficiency position of the Halford is analysed by computing ratios such as
inventory turnover ratio, debtor’s turnover and accounts payable turnover ratio.
Student number:
Paraphrase This Document
Need a fresh take? Get an instant paraphrase of this document with our AI Paraphraser
7
ACCOUNTING
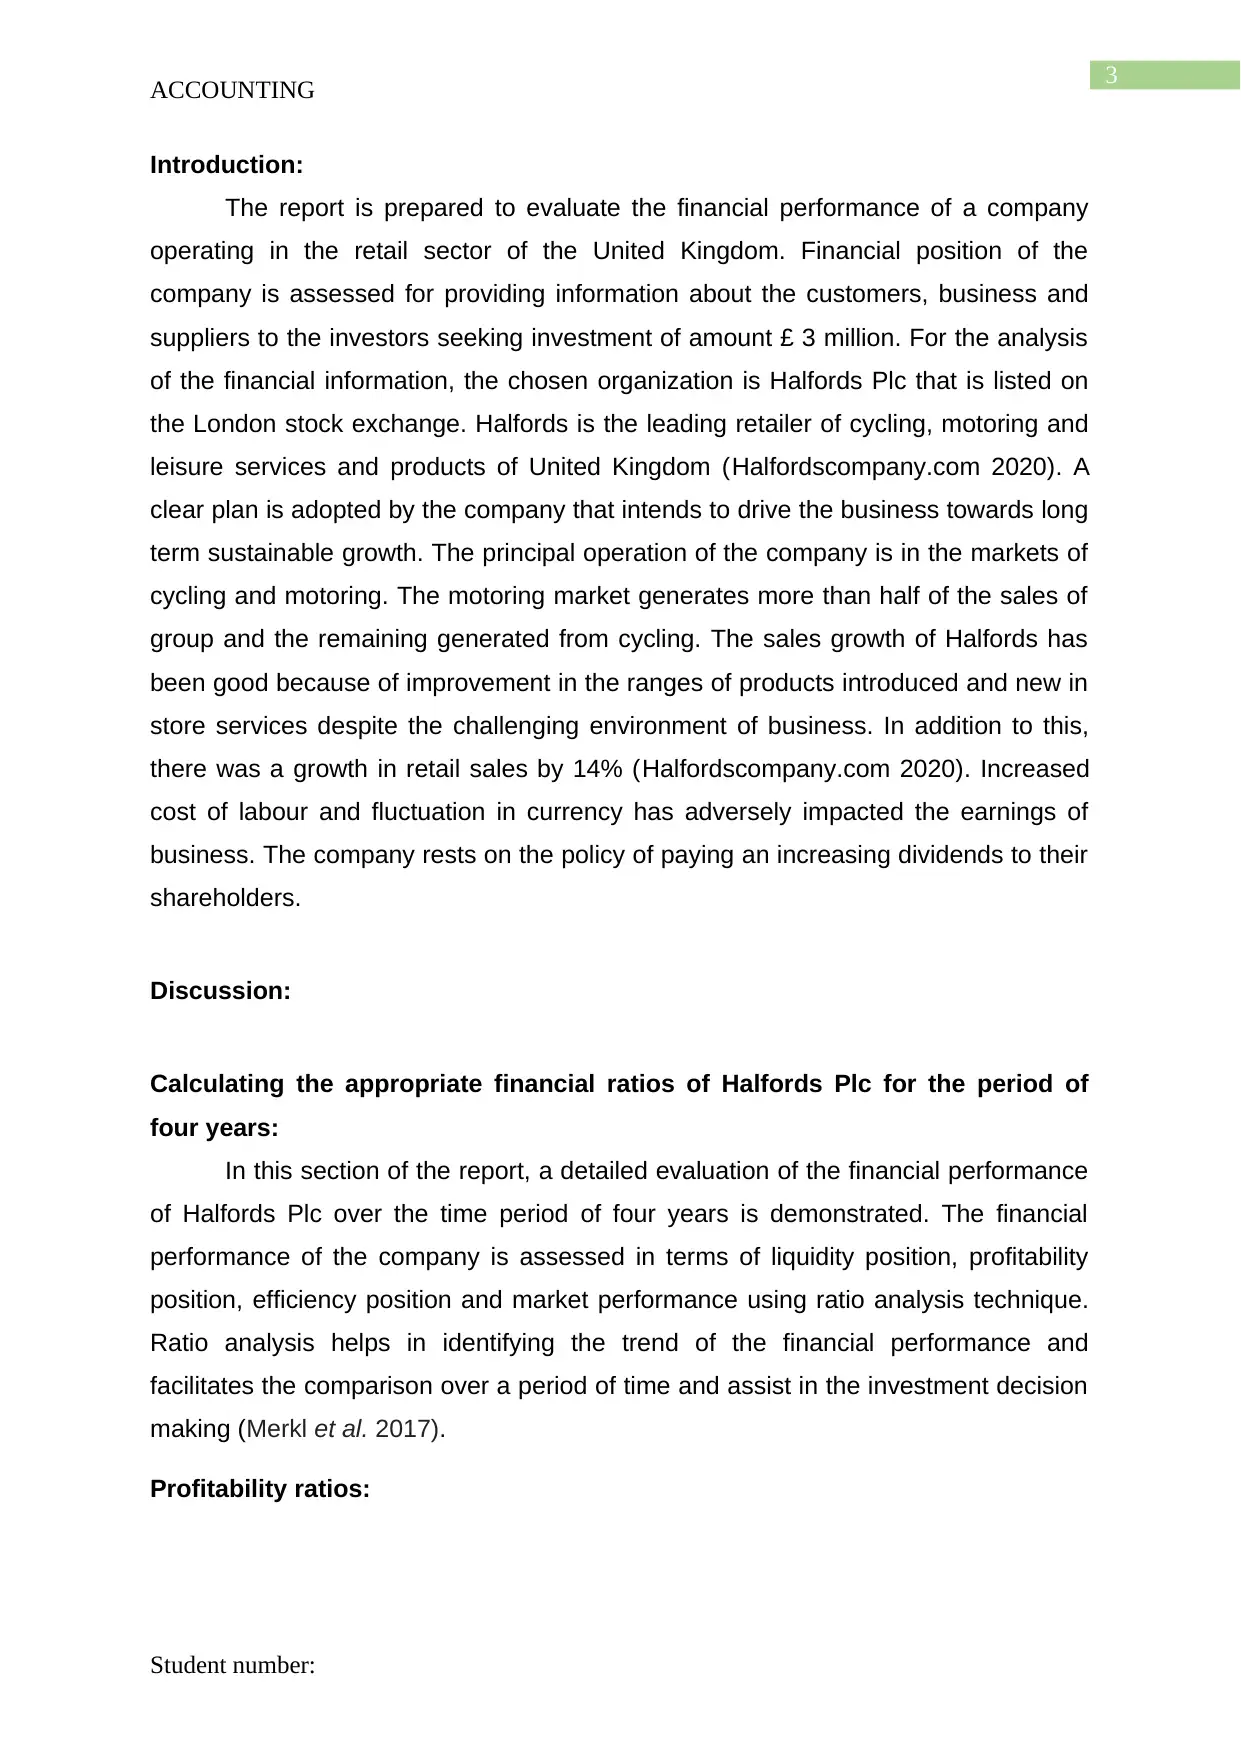
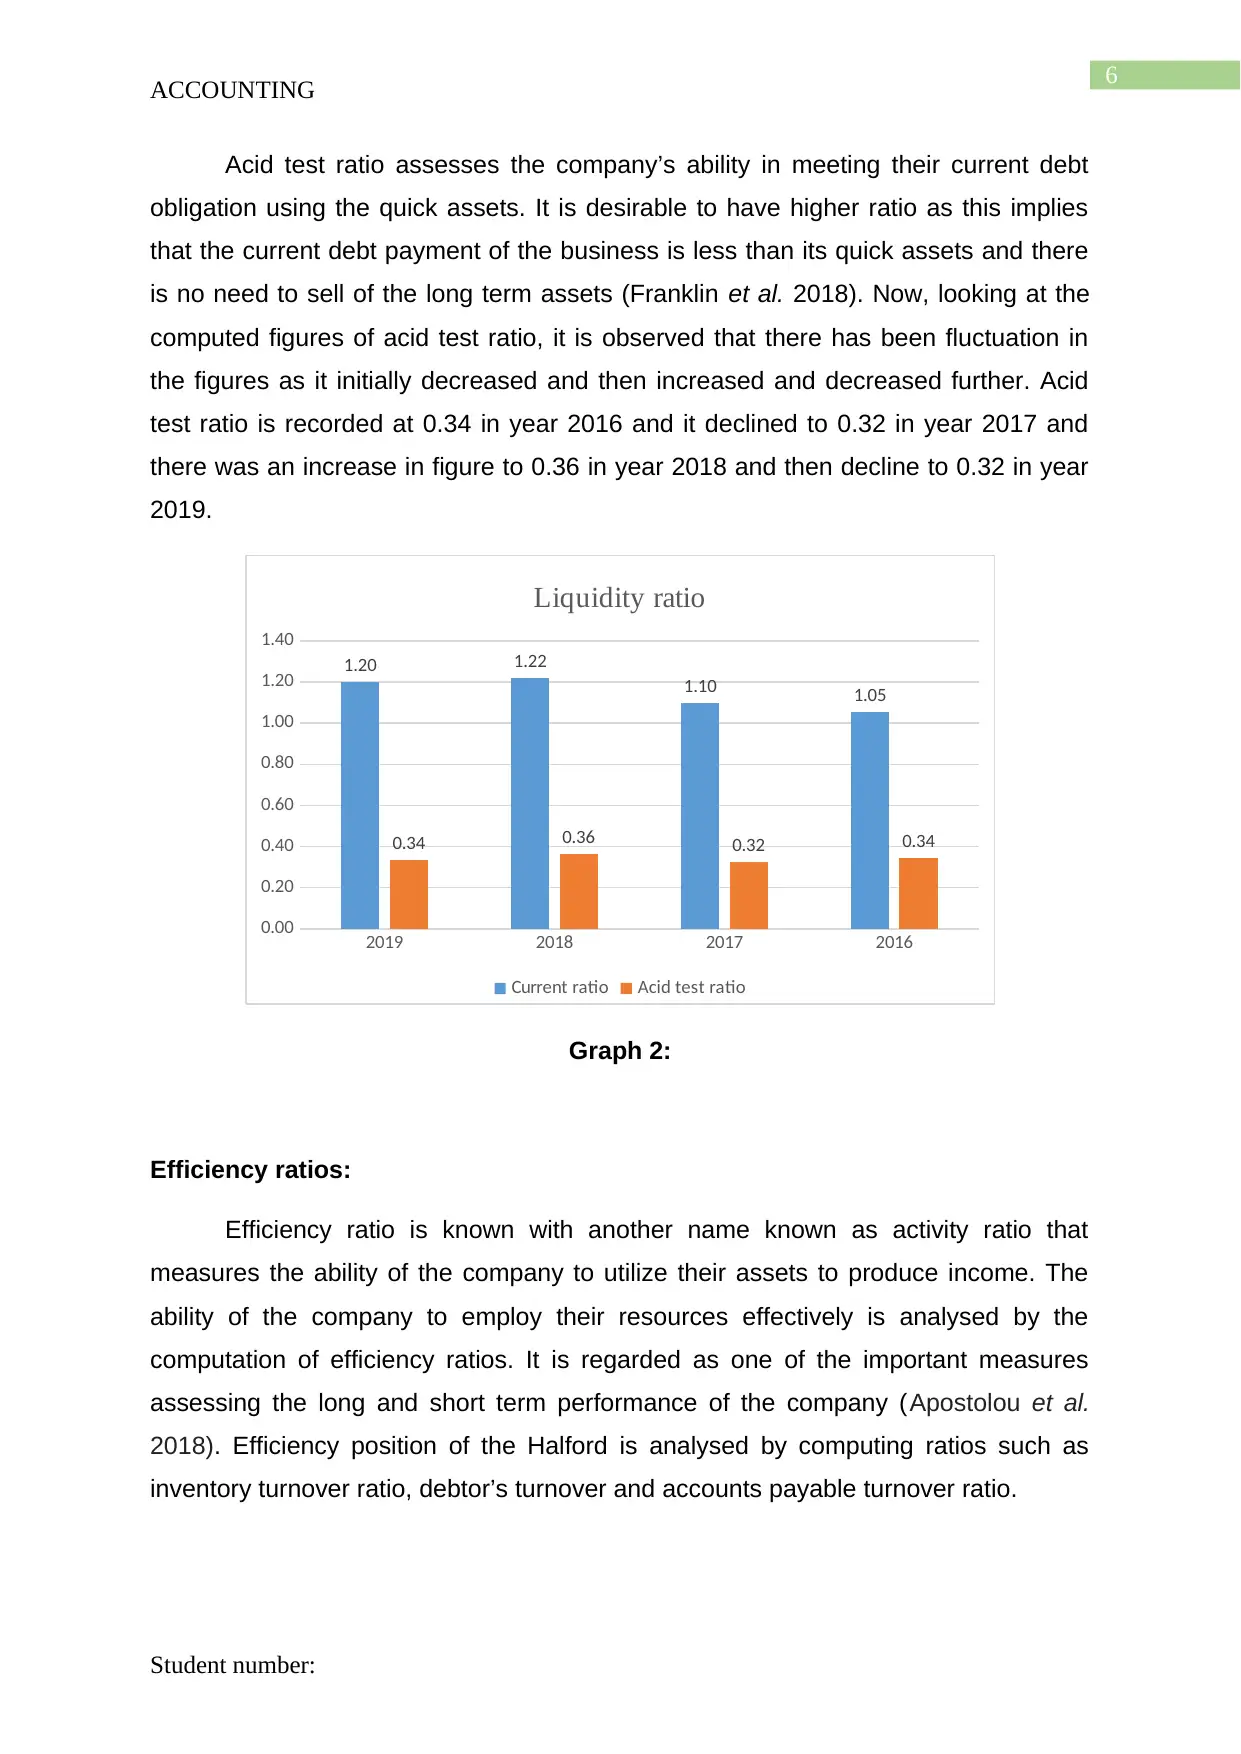
Accounts payable turnover is the measure that helps in the assessment of the
adequacy of the company to make its payment of bill on time. Higher value of
accounts payable turnover implies that the payment terms of the suppliers is not
healthy (Miles and Miles 2019). However, a higher value of this ratio is considered
desirable as it enables the company to hold cash for a longer period of time and this
can be used in the business. This ratio is computed by dividing the cost of sales by
average accounts payable. The chart presented below demonstrates the figures of
efficiency ratios as it is identified that there has been decline in the accounts payable
turnover over the year of analysis. In year 2016, the figure was recorded at 138.8
and this decreased to 132.2 in year 2017 and there was a further decline in the value
to 127 and 118.5 in year 2018 and 2019 respectively. This fall in figures cannot be
considered desirable for Hanford as this implies that the working capita cycle or the
working capital funding gap has been shrunk. It is therefore required by the
company to have a decent figure of accounts turnover payable.
Accounts receivable turnover is an efficiency measure of measuring the
efficiency of the credit policies of the company. A lower figure of settlement period
for trade receivables is considered healthy as this is implication of the fact that the
debtors are making payment on time. On other hand, when the ratio of accounts
turnover is low, it is not considered beneficial to the company as this implies that the
company is finding hard to collect its receivable or the credit is quite easily granted
(Gow et al. 2016). It is obtained by computing the revenue by average accounts
receivable. It is observed from the chart that the total number of days or settlement
period for trade receivables is declining from 20.8 in year 2016 to 19.9 and 18.4 in
year 2017 and 2018 and 2019 respectively. The fall in the number of days for
collecting receivables is considered a good sign for the company as the debtors are
making the payment faster. The time taken for receiving the money from debtors in
the recent years have reduced and this is indicative of the fact that the efficiency of
Hanford is collecting the revenue has increased.
Inventory turnover or stock turnover ratio helps in measuring the efficiency of
company in managing its level of inventory. Higher turnover of inventory implies that
the company is getting sold off on a faster basis. On other hand, lower inventory
turnover implies the overstocking and overbuilding of the company and that the
inventory is not sold off. Lower inventory turnover would have an adverse impact on
Student number:
ACCOUNTING
Accounts payable turnover is the measure that helps in the assessment of the
adequacy of the company to make its payment of bill on time. Higher value of
accounts payable turnover implies that the payment terms of the suppliers is not
healthy (Miles and Miles 2019). However, a higher value of this ratio is considered
desirable as it enables the company to hold cash for a longer period of time and this
can be used in the business. This ratio is computed by dividing the cost of sales by
average accounts payable. The chart presented below demonstrates the figures of
efficiency ratios as it is identified that there has been decline in the accounts payable
turnover over the year of analysis. In year 2016, the figure was recorded at 138.8
and this decreased to 132.2 in year 2017 and there was a further decline in the value
to 127 and 118.5 in year 2018 and 2019 respectively. This fall in figures cannot be
considered desirable for Hanford as this implies that the working capita cycle or the
working capital funding gap has been shrunk. It is therefore required by the
company to have a decent figure of accounts turnover payable.
Accounts receivable turnover is an efficiency measure of measuring the
efficiency of the credit policies of the company. A lower figure of settlement period
for trade receivables is considered healthy as this is implication of the fact that the
debtors are making payment on time. On other hand, when the ratio of accounts
turnover is low, it is not considered beneficial to the company as this implies that the
company is finding hard to collect its receivable or the credit is quite easily granted
(Gow et al. 2016). It is obtained by computing the revenue by average accounts
receivable. It is observed from the chart that the total number of days or settlement
period for trade receivables is declining from 20.8 in year 2016 to 19.9 and 18.4 in
year 2017 and 2018 and 2019 respectively. The fall in the number of days for
collecting receivables is considered a good sign for the company as the debtors are
making the payment faster. The time taken for receiving the money from debtors in
the recent years have reduced and this is indicative of the fact that the efficiency of
Hanford is collecting the revenue has increased.
Inventory turnover or stock turnover ratio helps in measuring the efficiency of
company in managing its level of inventory. Higher turnover of inventory implies that
the company is getting sold off on a faster basis. On other hand, lower inventory
turnover implies the overstocking and overbuilding of the company and that the
inventory is not sold off. Lower inventory turnover would have an adverse impact on
Student number:
8
ACCOUNTING
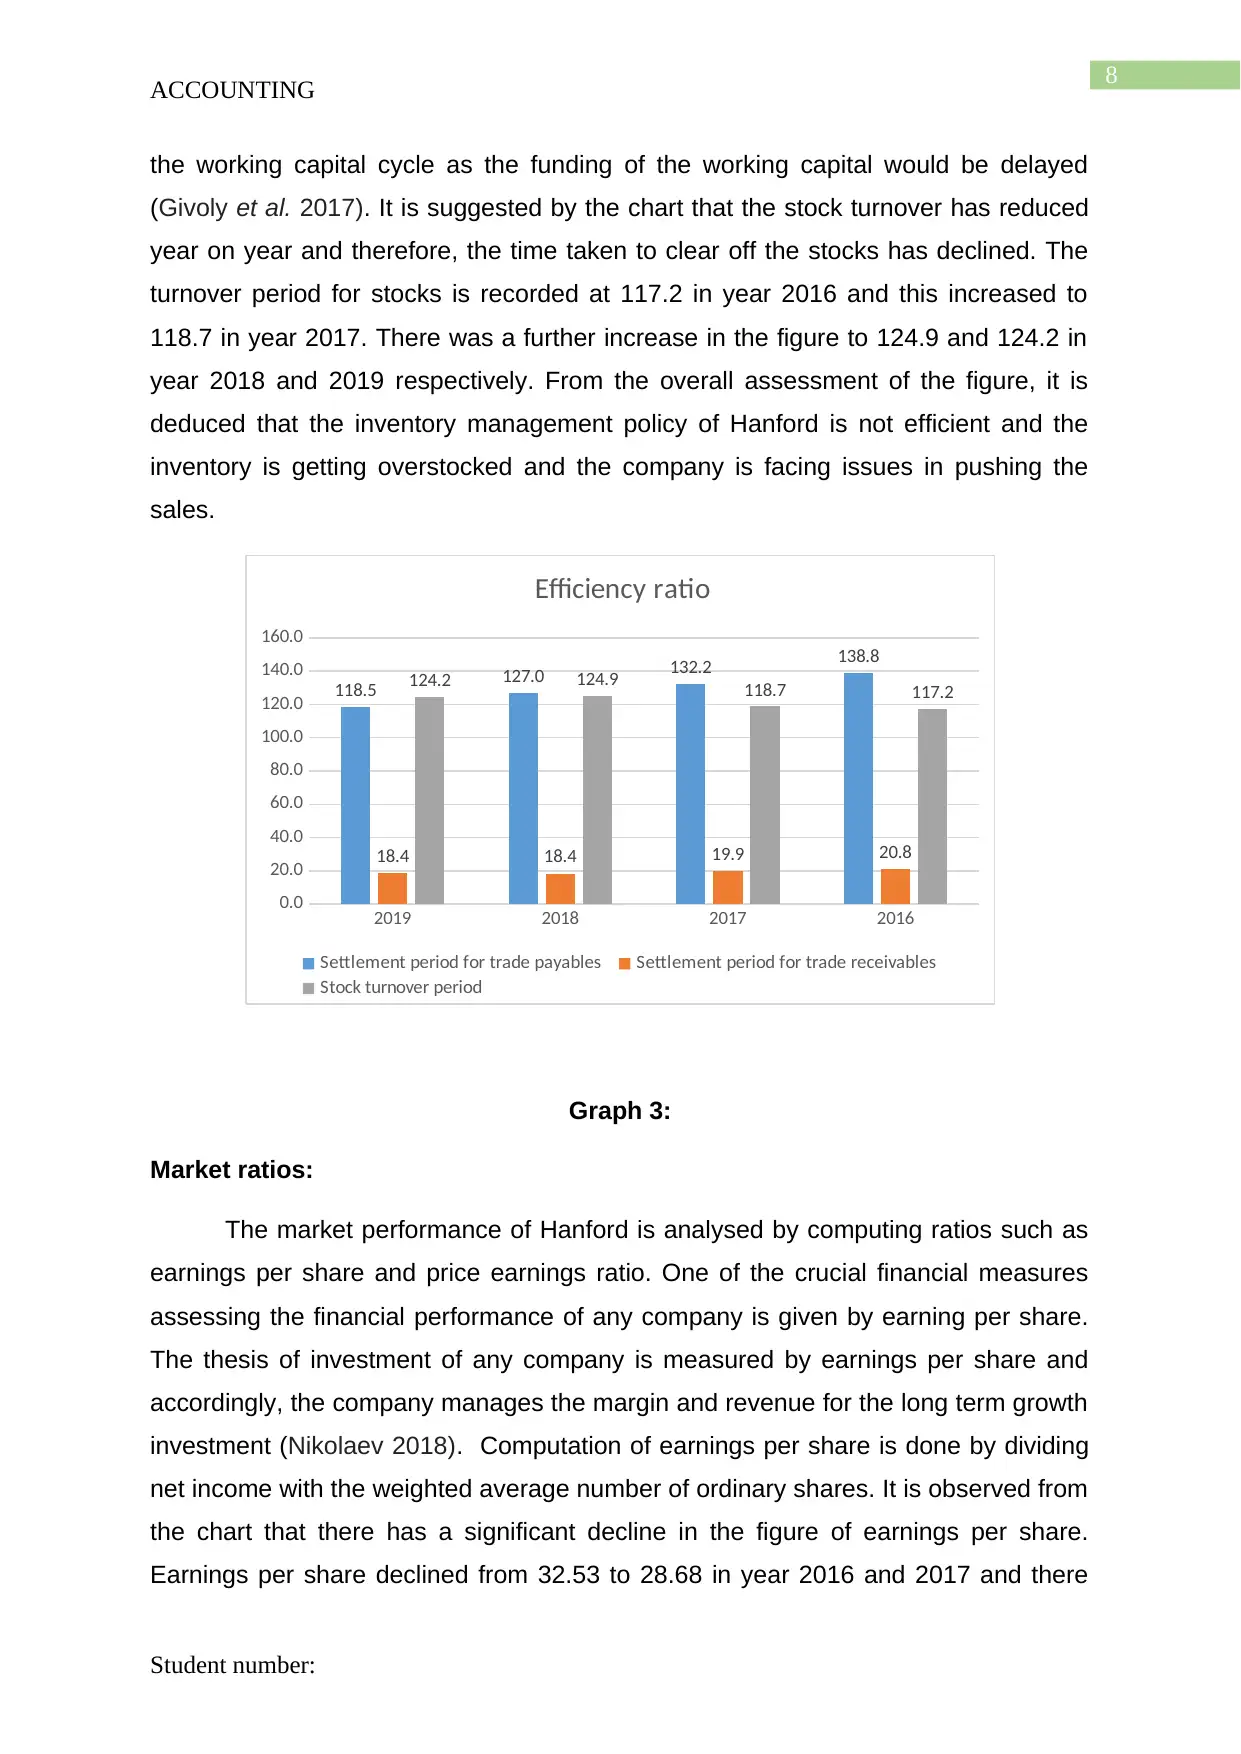
the working capital cycle as the funding of the working capital would be delayed
(Givoly et al. 2017). It is suggested by the chart that the stock turnover has reduced
year on year and therefore, the time taken to clear off the stocks has declined. The
turnover period for stocks is recorded at 117.2 in year 2016 and this increased to
118.7 in year 2017. There was a further increase in the figure to 124.9 and 124.2 in
year 2018 and 2019 respectively. From the overall assessment of the figure, it is
deduced that the inventory management policy of Hanford is not efficient and the
inventory is getting overstocked and the company is facing issues in pushing the
sales.
2019 2018 2017 2016
0.0
20.0
40.0
60.0
80.0
100.0
120.0
140.0
160.0
118.5 127.0 132.2 138.8
18.4 18.4 19.9 20.8
124.2 124.9 118.7 117.2
Efficiency ratio
Settlement period for trade payables Settlement period for trade receivables
Stock turnover period
Graph 3:
Market ratios:
The market performance of Hanford is analysed by computing ratios such as
earnings per share and price earnings ratio. One of the crucial financial measures
assessing the financial performance of any company is given by earning per share.
The thesis of investment of any company is measured by earnings per share and
accordingly, the company manages the margin and revenue for the long term growth
investment (Nikolaev 2018). Computation of earnings per share is done by dividing
net income with the weighted average number of ordinary shares. It is observed from
the chart that there has a significant decline in the figure of earnings per share.
Earnings per share declined from 32.53 to 28.68 in year 2016 and 2017 and there
Student number:
ACCOUNTING
the working capital cycle as the funding of the working capital would be delayed
(Givoly et al. 2017). It is suggested by the chart that the stock turnover has reduced
year on year and therefore, the time taken to clear off the stocks has declined. The
turnover period for stocks is recorded at 117.2 in year 2016 and this increased to
118.7 in year 2017. There was a further increase in the figure to 124.9 and 124.2 in
year 2018 and 2019 respectively. From the overall assessment of the figure, it is
deduced that the inventory management policy of Hanford is not efficient and the
inventory is getting overstocked and the company is facing issues in pushing the
sales.
2019 2018 2017 2016
0.0
20.0
40.0
60.0
80.0
100.0
120.0
140.0
160.0
118.5 127.0 132.2 138.8
18.4 18.4 19.9 20.8
124.2 124.9 118.7 117.2
Efficiency ratio
Settlement period for trade payables Settlement period for trade receivables
Stock turnover period
Graph 3:
Market ratios:
The market performance of Hanford is analysed by computing ratios such as
earnings per share and price earnings ratio. One of the crucial financial measures
assessing the financial performance of any company is given by earning per share.
The thesis of investment of any company is measured by earnings per share and
accordingly, the company manages the margin and revenue for the long term growth
investment (Nikolaev 2018). Computation of earnings per share is done by dividing
net income with the weighted average number of ordinary shares. It is observed from
the chart that there has a significant decline in the figure of earnings per share.
Earnings per share declined from 32.53 to 28.68 in year 2016 and 2017 and there
Student number:
⊘ This is a preview!⊘
Do you want full access?
Subscribe today to unlock all pages.
Trusted by 1+ million students worldwide
9
ACCOUNTING
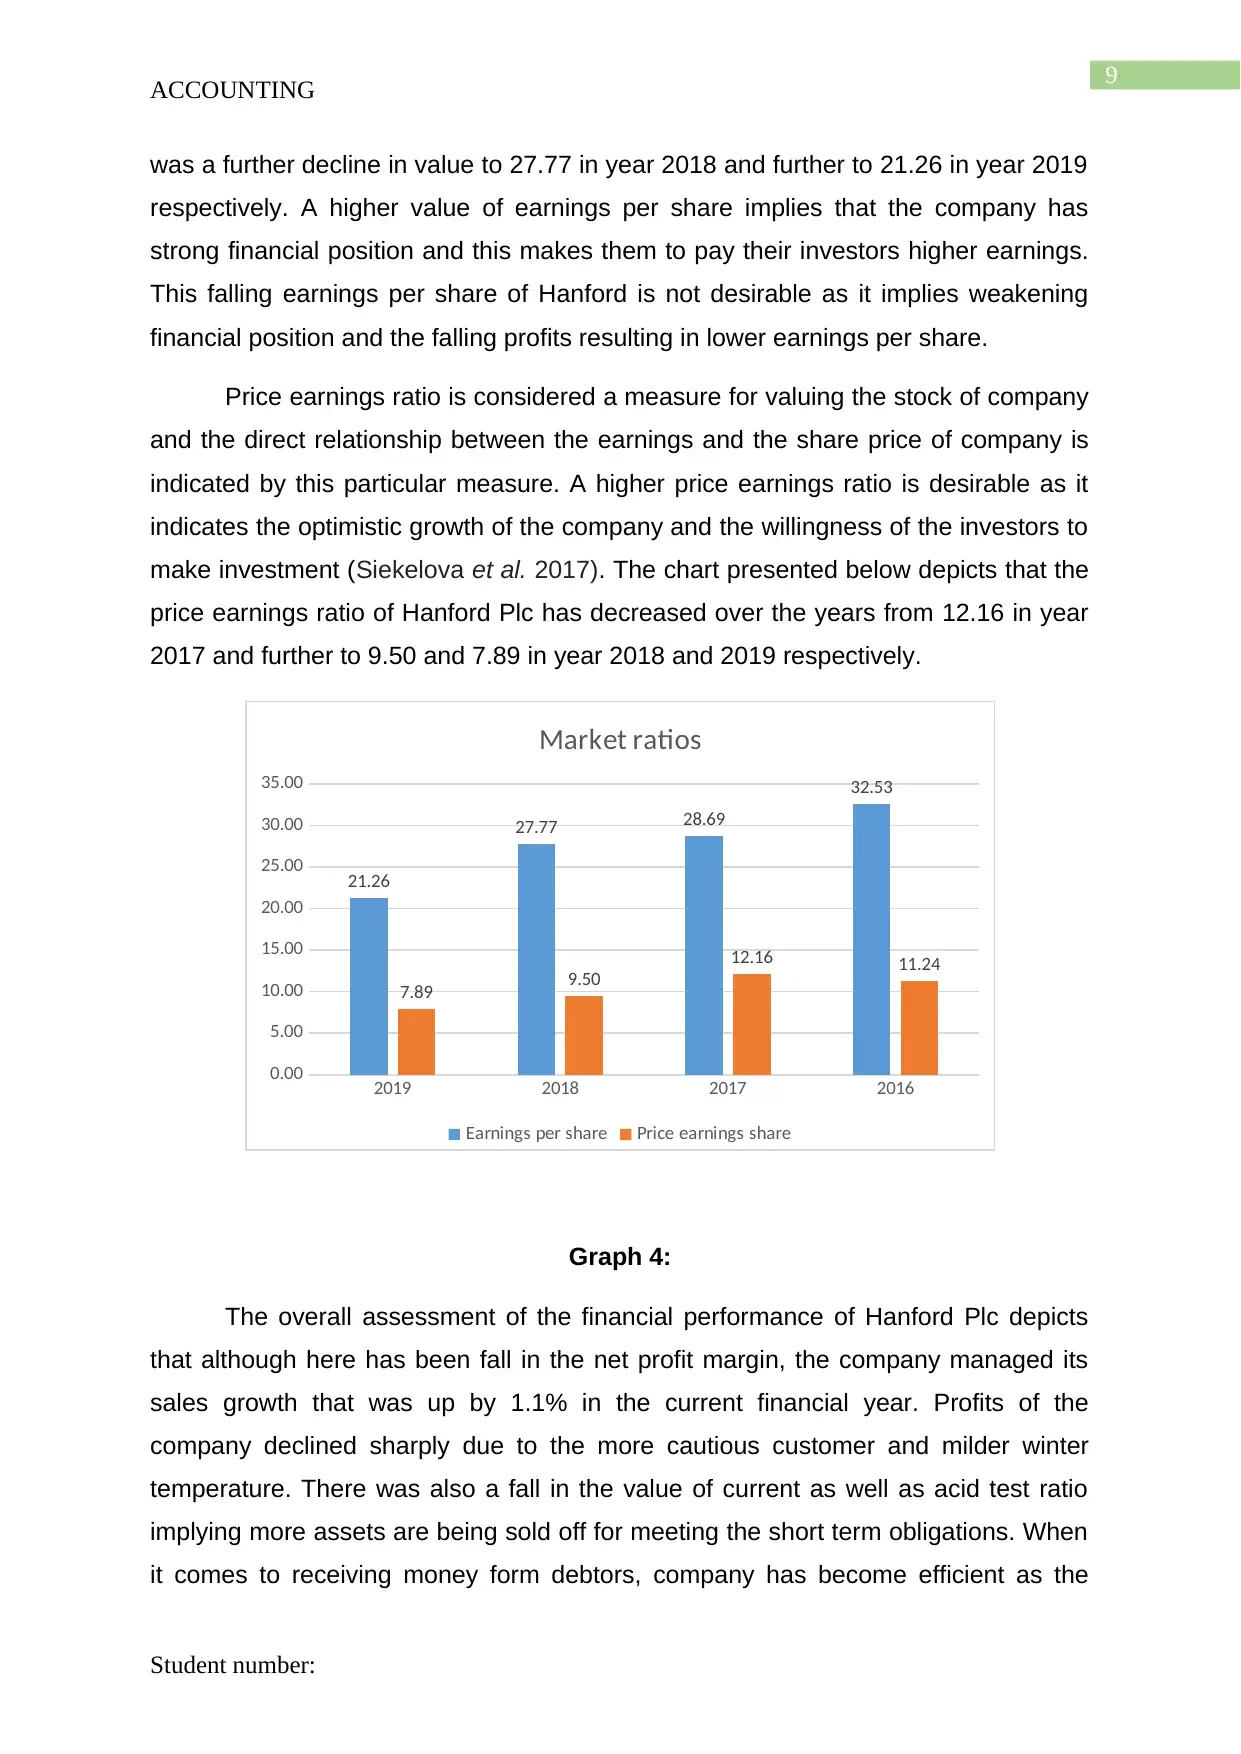
was a further decline in value to 27.77 in year 2018 and further to 21.26 in year 2019
respectively. A higher value of earnings per share implies that the company has
strong financial position and this makes them to pay their investors higher earnings.
This falling earnings per share of Hanford is not desirable as it implies weakening
financial position and the falling profits resulting in lower earnings per share.
Price earnings ratio is considered a measure for valuing the stock of company
and the direct relationship between the earnings and the share price of company is
indicated by this particular measure. A higher price earnings ratio is desirable as it
indicates the optimistic growth of the company and the willingness of the investors to
make investment (Siekelova et al. 2017). The chart presented below depicts that the
price earnings ratio of Hanford Plc has decreased over the years from 12.16 in year
2017 and further to 9.50 and 7.89 in year 2018 and 2019 respectively.
2019 2018 2017 2016
0.00
5.00
10.00
15.00
20.00
25.00
30.00
35.00
21.26
27.77 28.69
32.53
7.89 9.50
12.16 11.24
Market ratios
Earnings per share Price earnings share
Graph 4:
The overall assessment of the financial performance of Hanford Plc depicts
that although here has been fall in the net profit margin, the company managed its
sales growth that was up by 1.1% in the current financial year. Profits of the
company declined sharply due to the more cautious customer and milder winter
temperature. There was also a fall in the value of current as well as acid test ratio
implying more assets are being sold off for meeting the short term obligations. When
it comes to receiving money form debtors, company has become efficient as the
Student number:
ACCOUNTING
was a further decline in value to 27.77 in year 2018 and further to 21.26 in year 2019
respectively. A higher value of earnings per share implies that the company has
strong financial position and this makes them to pay their investors higher earnings.
This falling earnings per share of Hanford is not desirable as it implies weakening
financial position and the falling profits resulting in lower earnings per share.
Price earnings ratio is considered a measure for valuing the stock of company
and the direct relationship between the earnings and the share price of company is
indicated by this particular measure. A higher price earnings ratio is desirable as it
indicates the optimistic growth of the company and the willingness of the investors to
make investment (Siekelova et al. 2017). The chart presented below depicts that the
price earnings ratio of Hanford Plc has decreased over the years from 12.16 in year
2017 and further to 9.50 and 7.89 in year 2018 and 2019 respectively.
2019 2018 2017 2016
0.00
5.00
10.00
15.00
20.00
25.00
30.00
35.00
21.26
27.77 28.69
32.53
7.89 9.50
12.16 11.24
Market ratios
Earnings per share Price earnings share
Graph 4:
The overall assessment of the financial performance of Hanford Plc depicts
that although here has been fall in the net profit margin, the company managed its
sales growth that was up by 1.1% in the current financial year. Profits of the
company declined sharply due to the more cautious customer and milder winter
temperature. There was also a fall in the value of current as well as acid test ratio
implying more assets are being sold off for meeting the short term obligations. When
it comes to receiving money form debtors, company has become efficient as the
Student number:
Paraphrase This Document
Need a fresh take? Get an instant paraphrase of this document with our AI Paraphraser
10
ACCOUNTING
settlement period has reduced. On other hand, stock turnover has fallen implying the
overstocking. In addition to this, there has been a fall in the earnings per share along
with price earnings ratio in the current financial year. In this regard, it is
recommended to the management to take some measures to manage its inventories
effectively and develop and efficient inventory management policy (Goldmann 2017).
On other hand, investors are recommended to hold on and wait for a while before
making investment as the company’s profit are declining.
Discussing the advantages and disadvantages of financial ratios:
Advantages of financial ratios are listed below:
Financial ratios assist in comparing the performance of one company with
other by evaluating their trends over a particular time period.
Critical information on the financial performance and the profitability level of
any company can be effectively measured using financial ratios (Drake et al.
2016).
The numbers computed by way of financial ratio makes it easier for the
analysts to have a quick judgement about the financial position.
Disadvantages of financial ratios are listed below:
Comparability of the financial performance over time using financial ratios can
be impaired if the management decided to change on the assumptions time to
time.
There is no standardization in the methods of computing different ratios and
financial ratios provides the information on the history and past information
instead of future and current performance (Bebbington et al. 2017).
The numbers computed using ratio analysis might not be reliable for the
purpose of investment decision making when such values are compared with
industrial average.
Discussing the source of finance of chosen company:
The company finance itself for long term mainly by borrowing, trade and other
payables, provisions and deferred tax liability. On other hand, short term financing
includes derivative financial instruments, borrowings, current tax liabilities and trade
Student number:
11
ACCOUNTING
and other payables. It is clearly identified from the statement of financial position of
Hanford Plc that year 2019 reported a falling figure of total debt compared to
previous year.
Briefly discussing the report presented by the auditor:
The auditor’s report of Hanford Plc demonstrated the opinion of the auditors
on the financial statements generated by the company. It also included the basis on
which the opinion about the financial statements have been framed. Another content
is the presentation of the key audit matters that incorporated the assessment of the
material misstatement risk. Key audit matters is presented in a separate section that
outlines the various accounts that carries the risk of being materially misstated. The
third content is presentation of the overview of the audit scope and materiality
application. In addition to this, auditors also report on the going concern aspect of
the company opining that there do not exist any risk of material uncertainty.
Furthermore, longer term viability and principal risks disclosure is also made by the
auditor in a separate section in relation to the remuneration report of directors.
Auditors have also reported on the other financial information presented in the report
saying that no material misstatements have been identified in other information
presented in the annual report of the company. Audit report also contains disclosure
about the corporate governance and no report has been made in this regard. Lastly,
audit report also contains the responsibilities of auditors and audit work purpose and
the responsibilities they owe to company (Halfordscompany.com 2020).
Conclusion:
The report demonstrating the assessment of the financial position of Hanford
Plc have ascertained that the profitability position of the company has declined due
to the fall in overall profits in the current year. Moreover, company has not been
efficient in managing its inventory and trade payables that has impacted its efficiency
position. Liquidity position has been deteriorated in the coming years but the fall is
not significant. The overall market performance of the company has been impacted
which makes the investors pessimistic about the performance but the company is
receiving increasing funding from its shareholders. Therefore, the investors seeking
investment should hold on and wait to make investment in the company.
Student number:
⊘ This is a preview!⊘
Do you want full access?
Subscribe today to unlock all pages.
Trusted by 1+ million students worldwide
1 out of 15
Related Documents


Your All-in-One AI-Powered Toolkit for Academic Success.
+13062052269
info@desklib.com
Available 24*7 on WhatsApp / Email
![[object Object]](/_next/static/media/star-bottom.7253800d.svg)
Unlock your academic potential
Copyright © 2020–2026 A2Z Services. All Rights Reserved. Developed and managed by ZUCOL.