HALS Survey Data Analysis Using SPSS - University of Hertfordshire

Verified

Added on  2023/04/19

|11
|1758
|290
Report
AI Summary
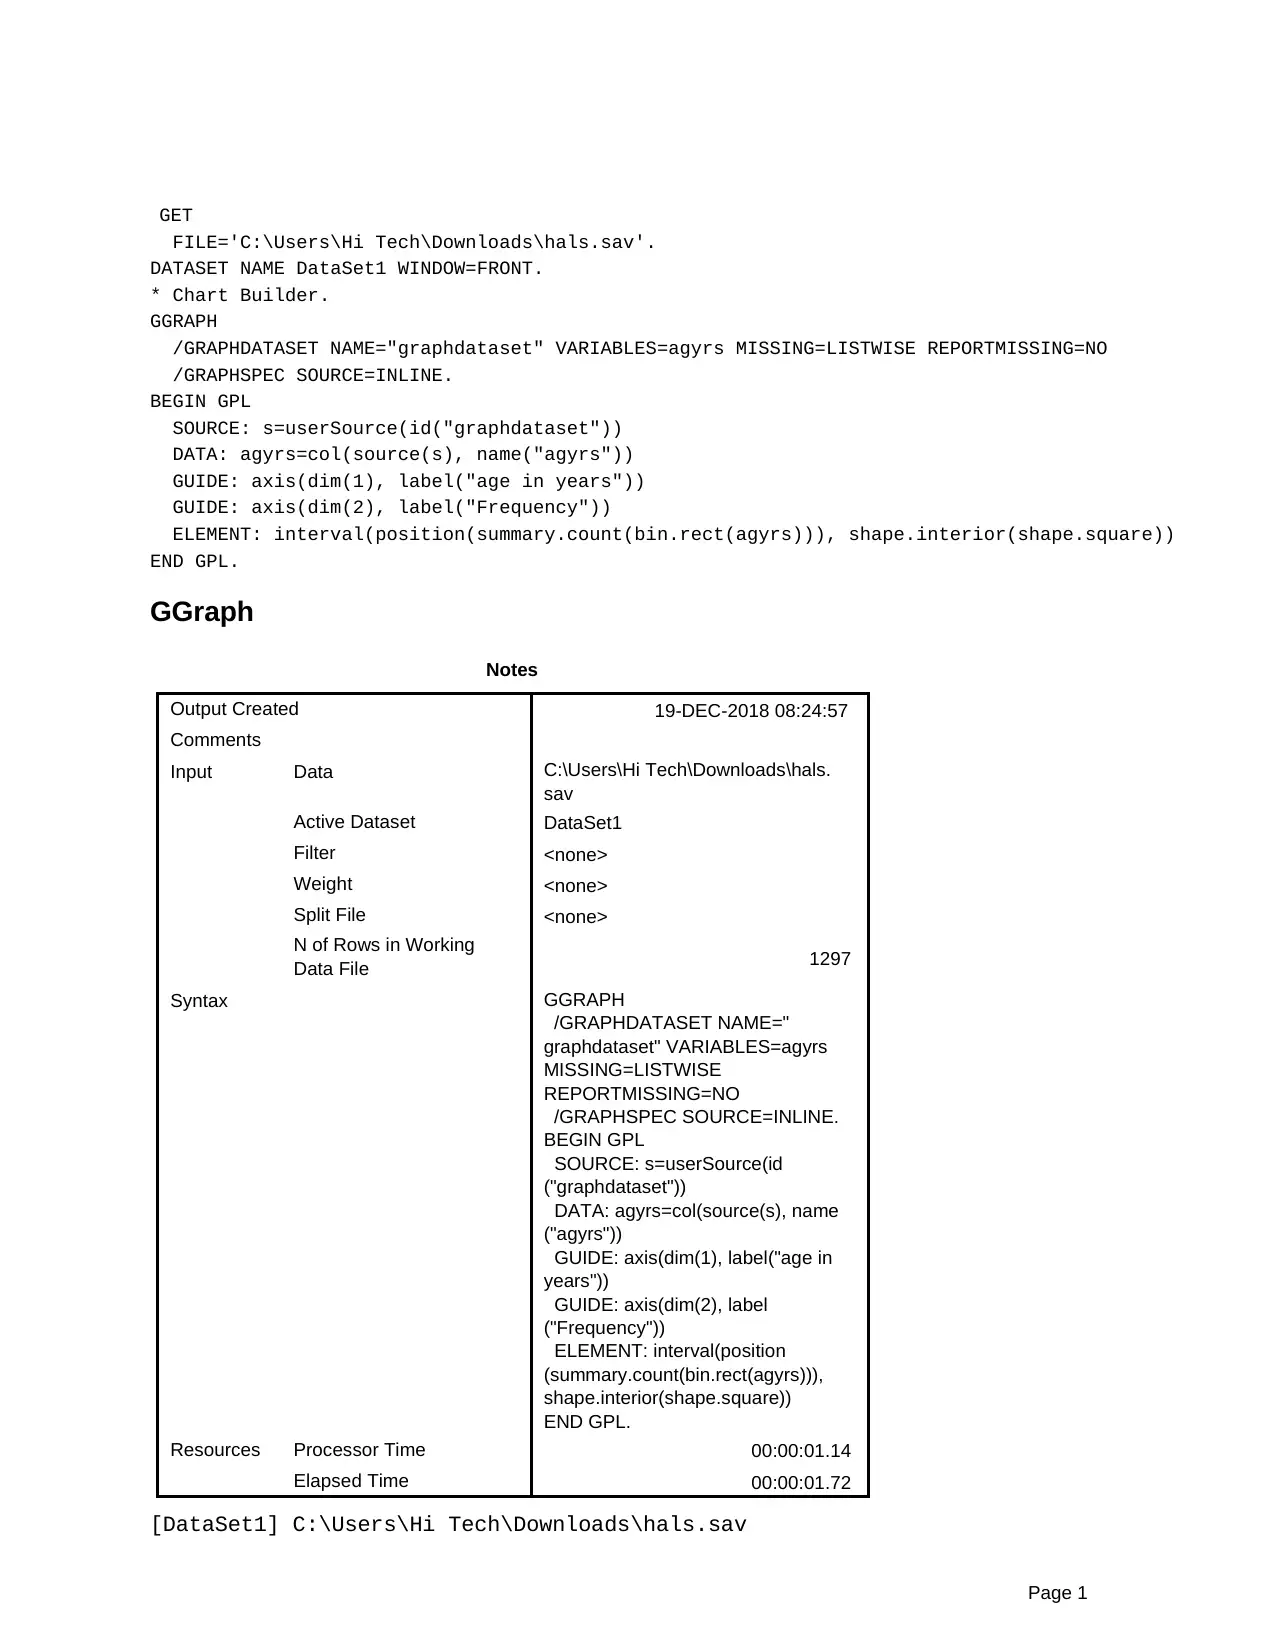
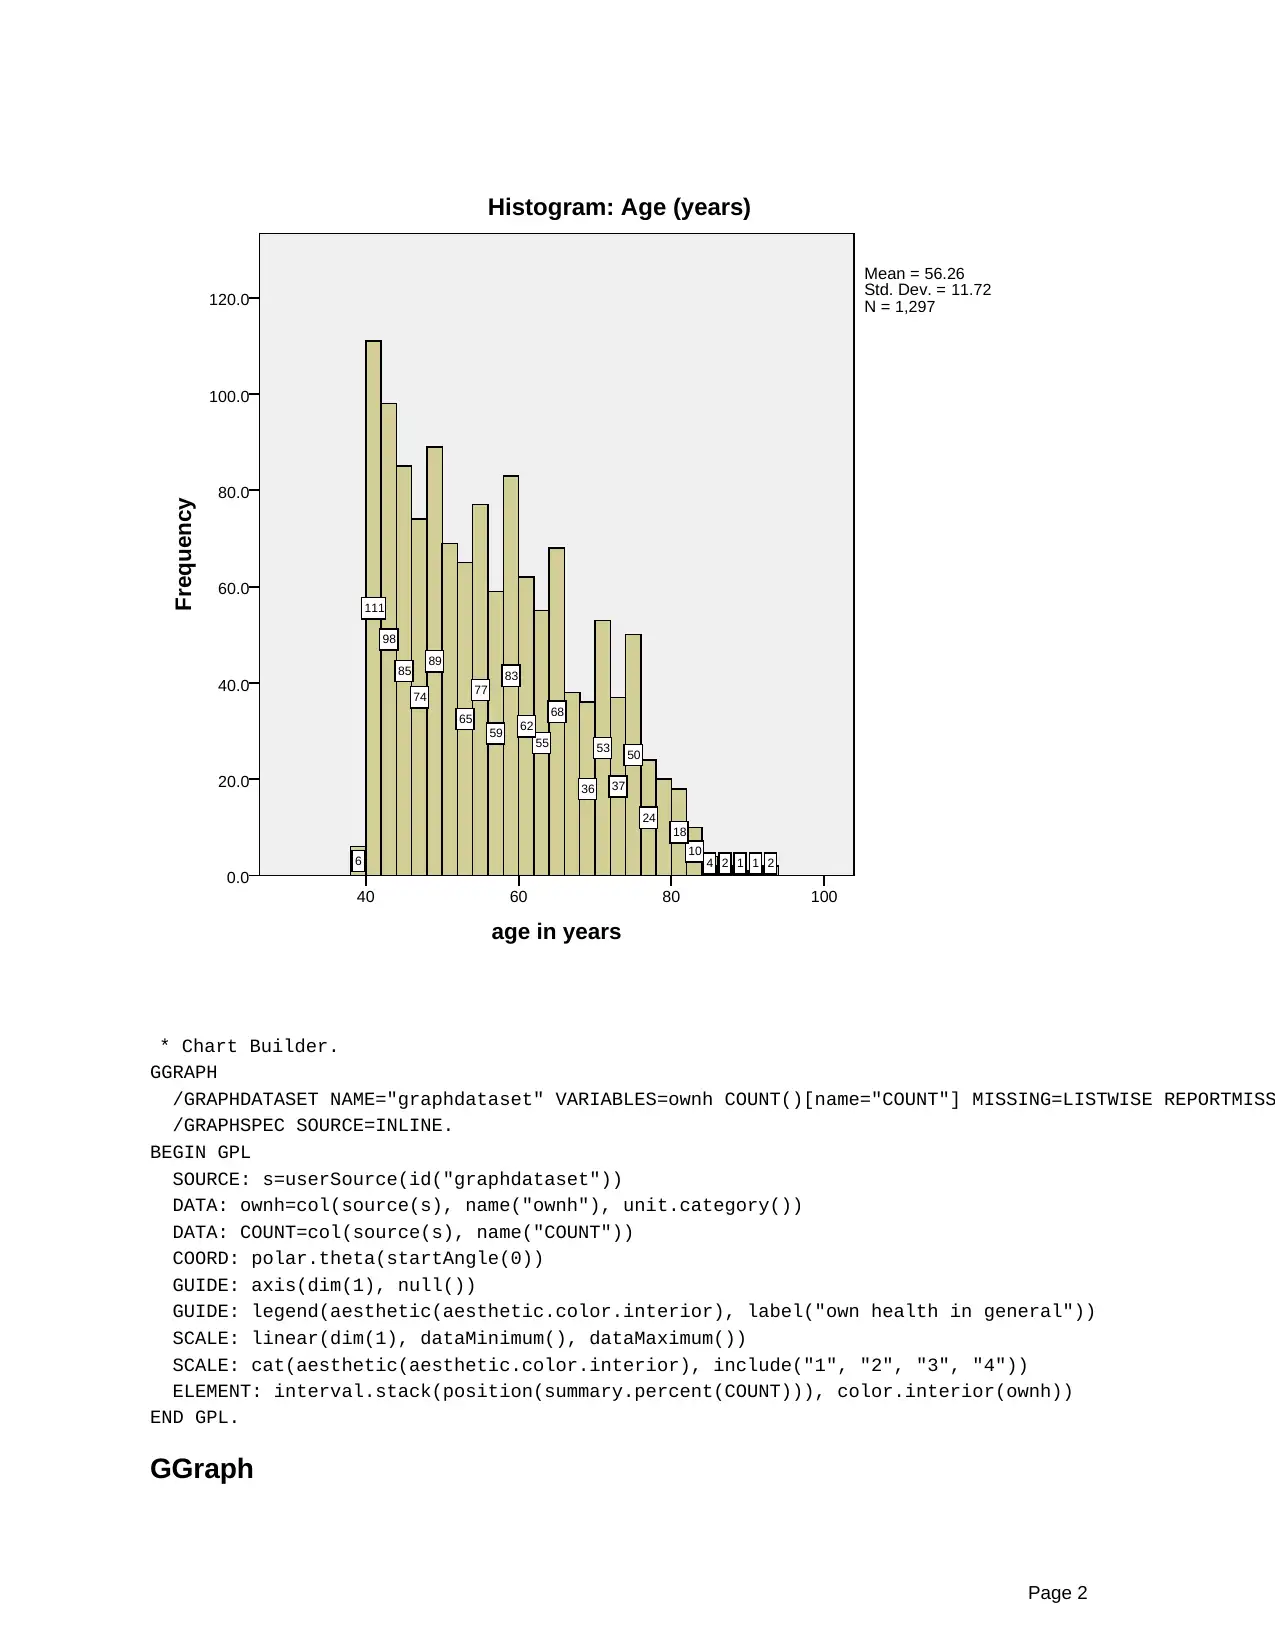
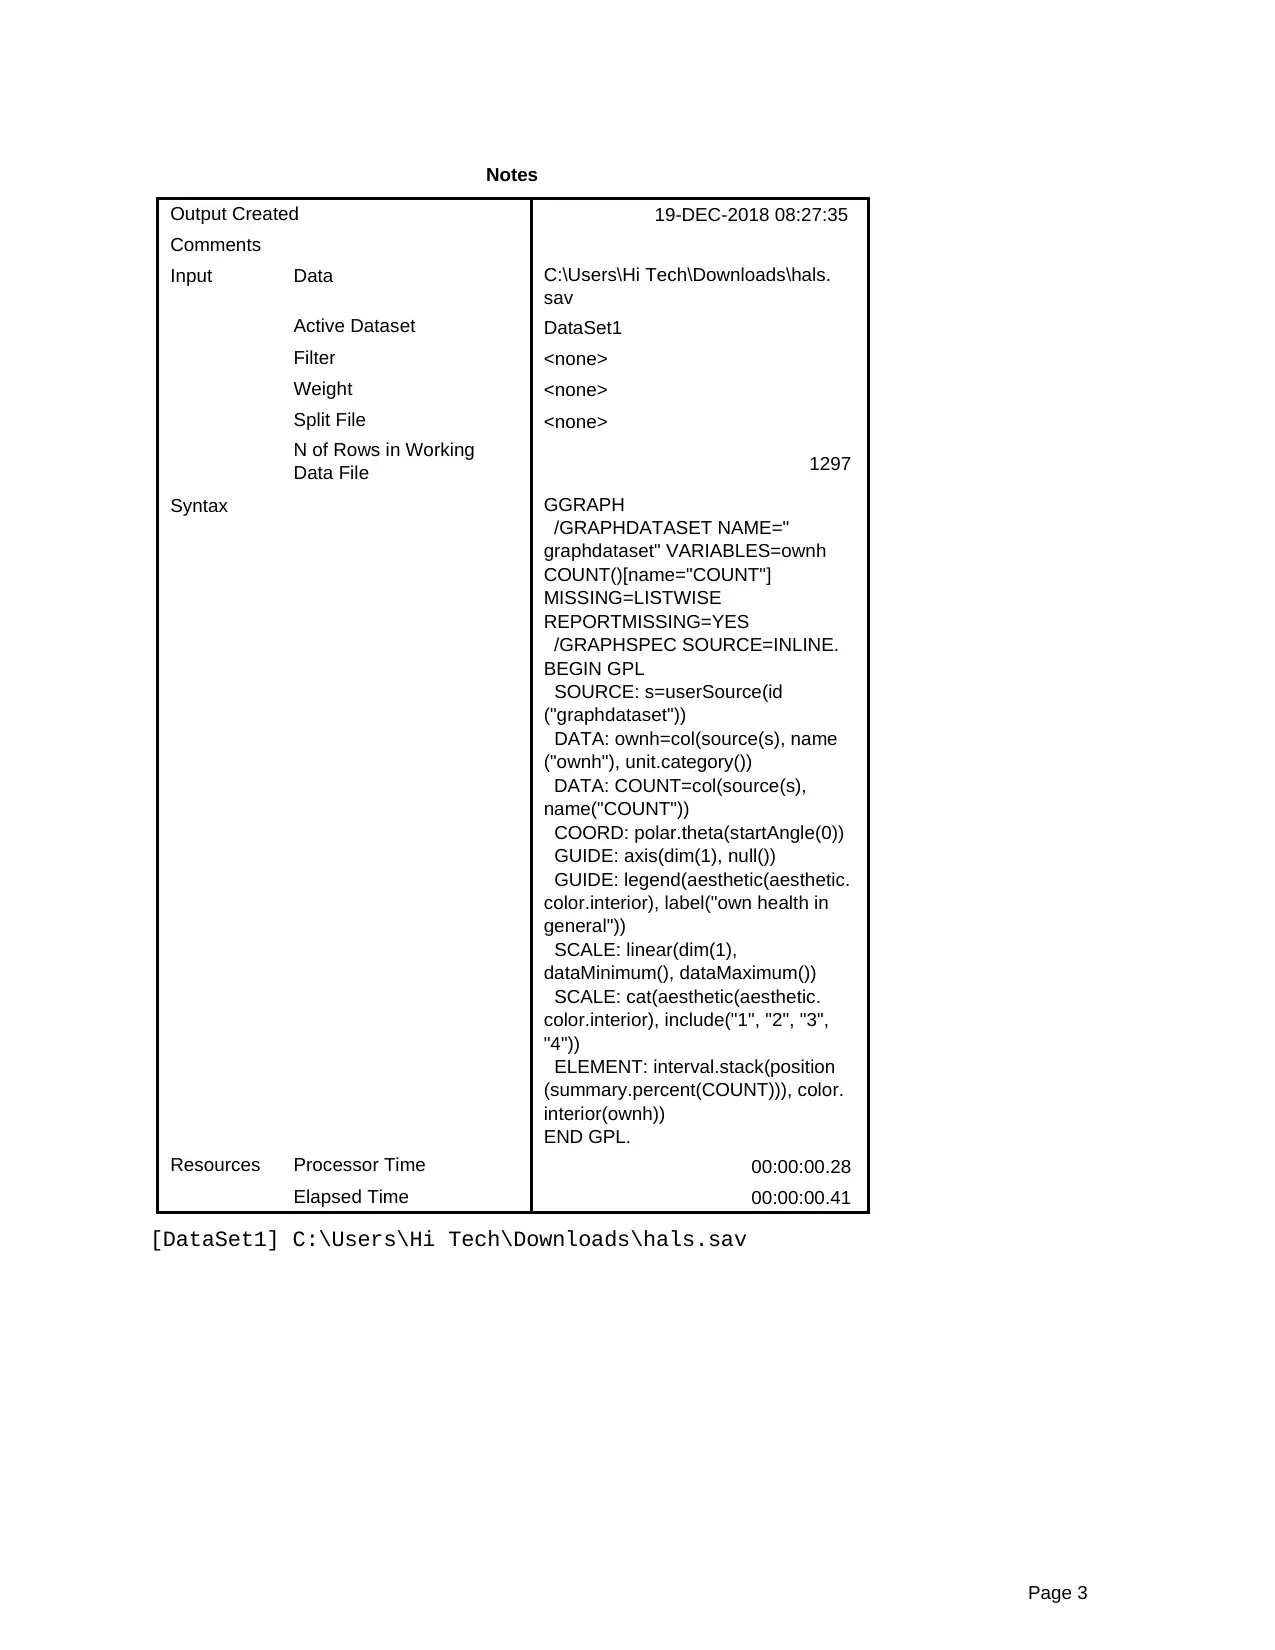
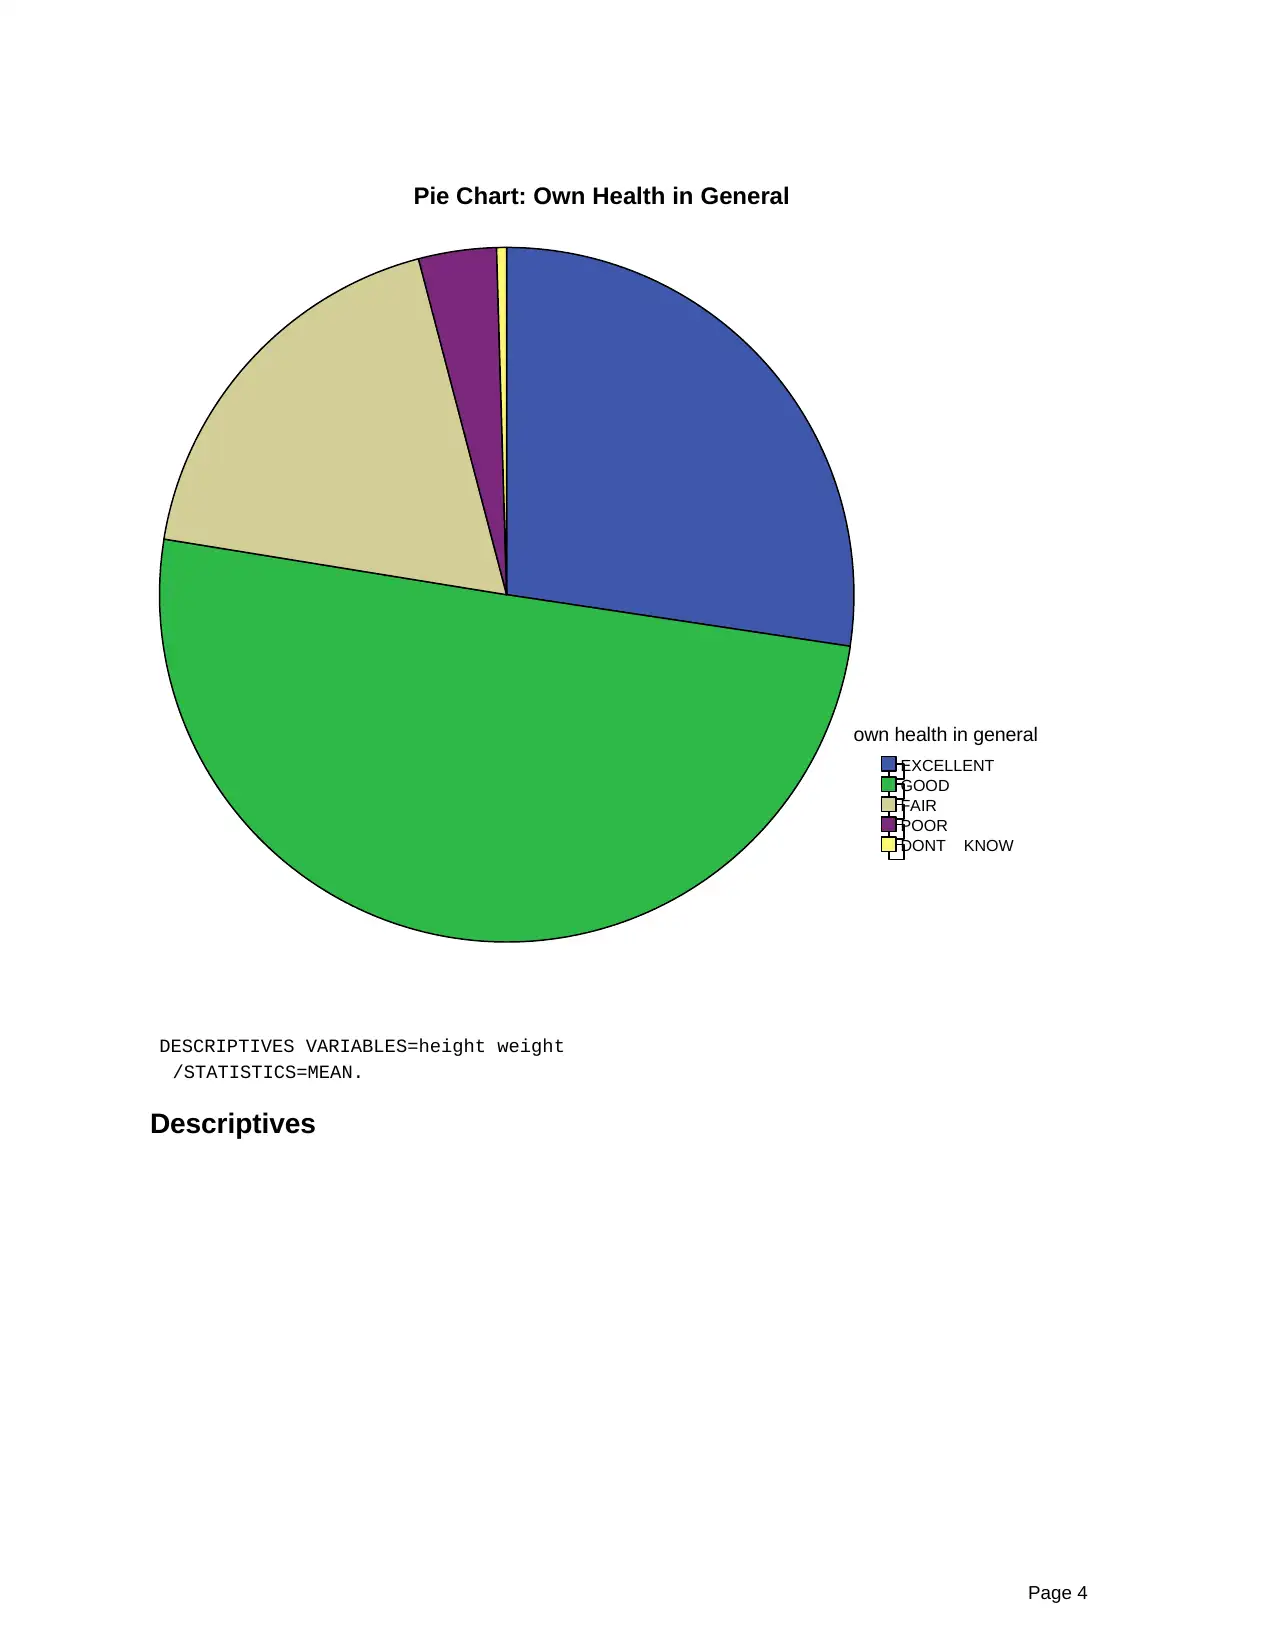
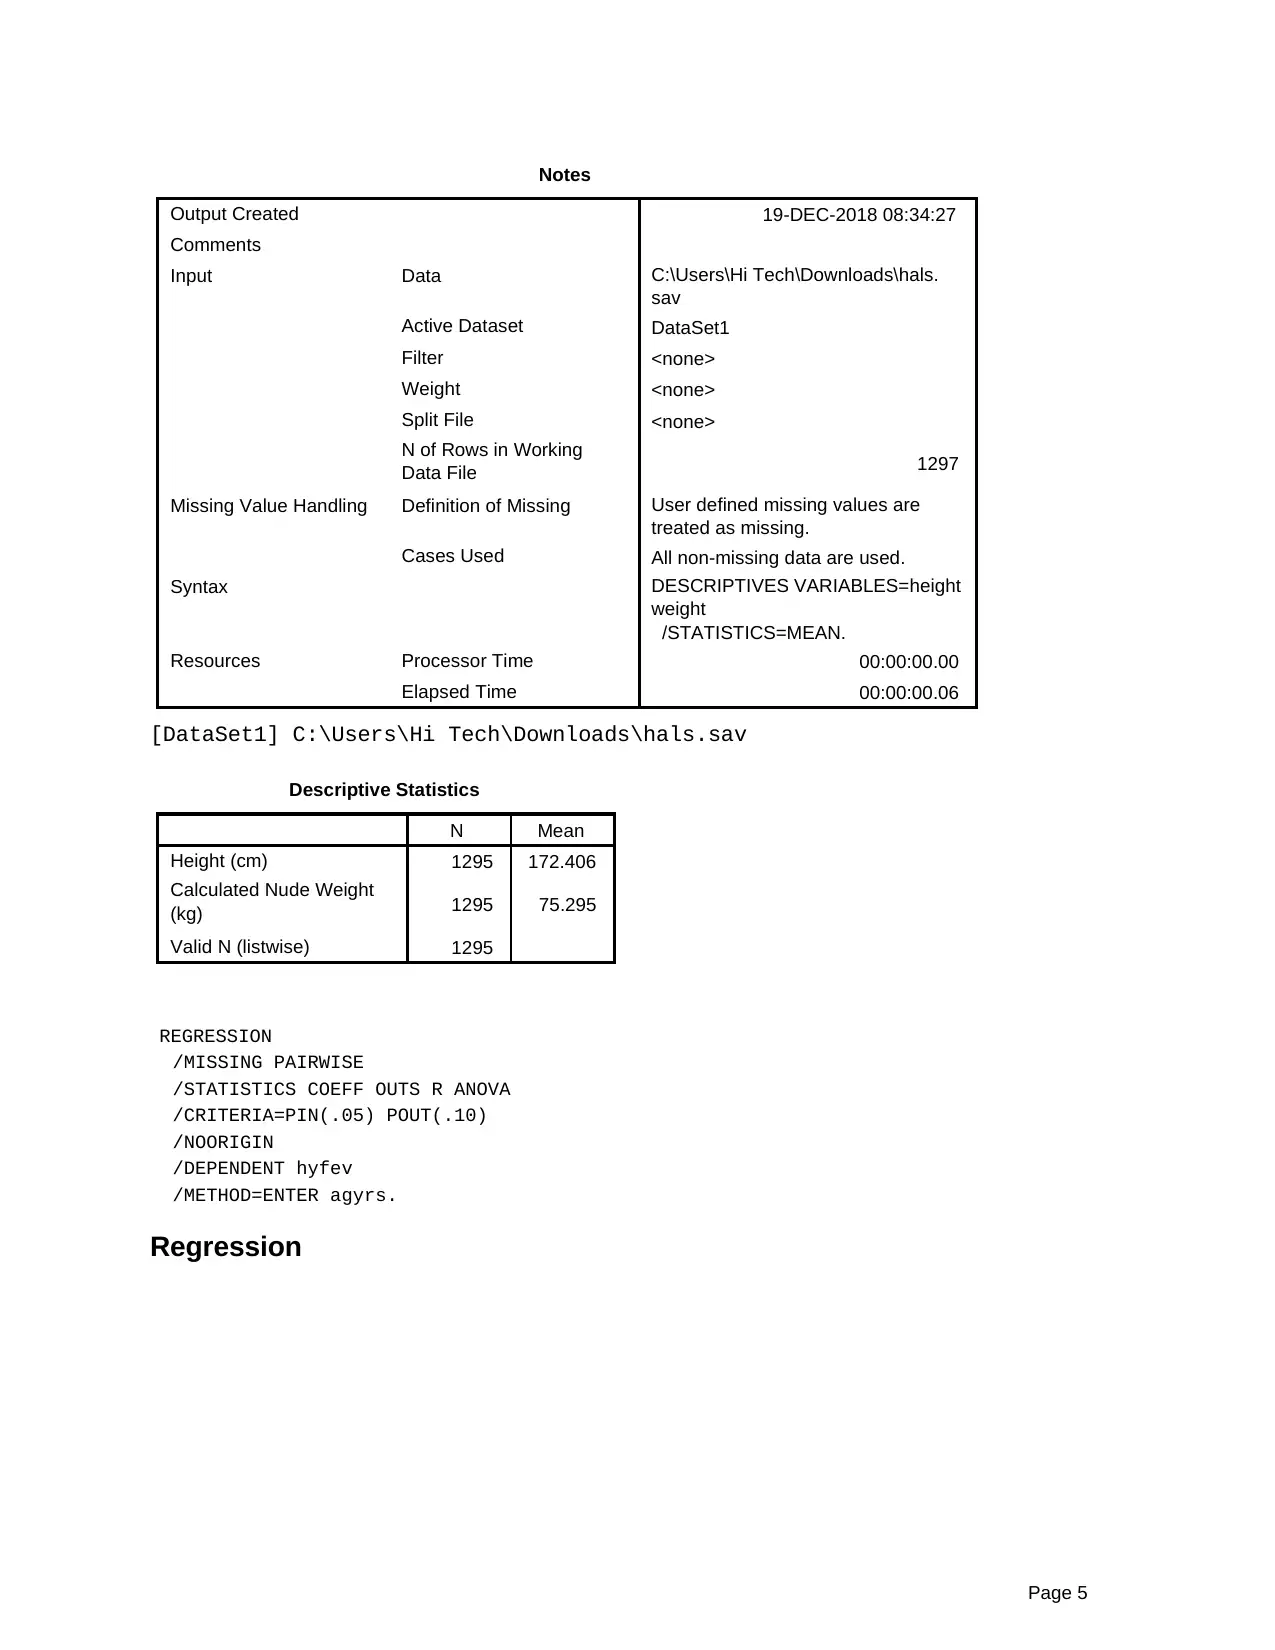
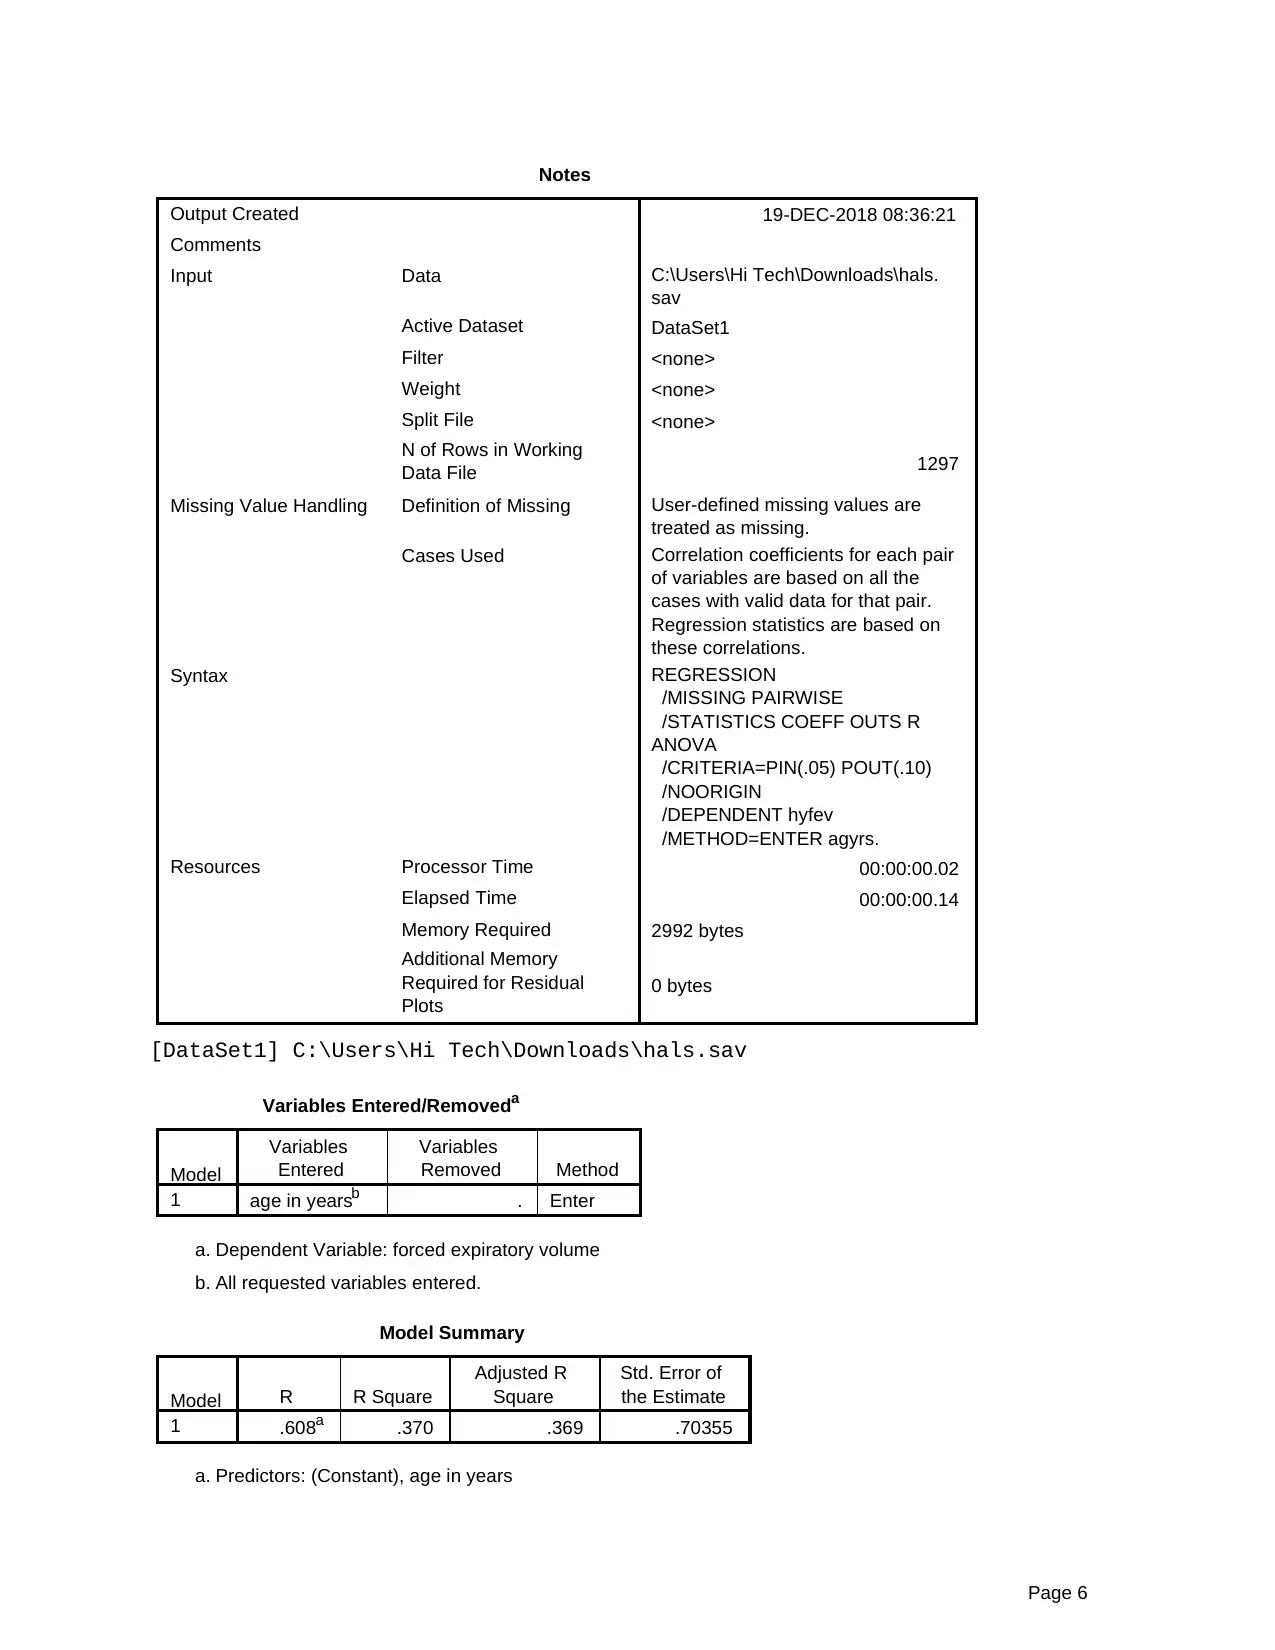
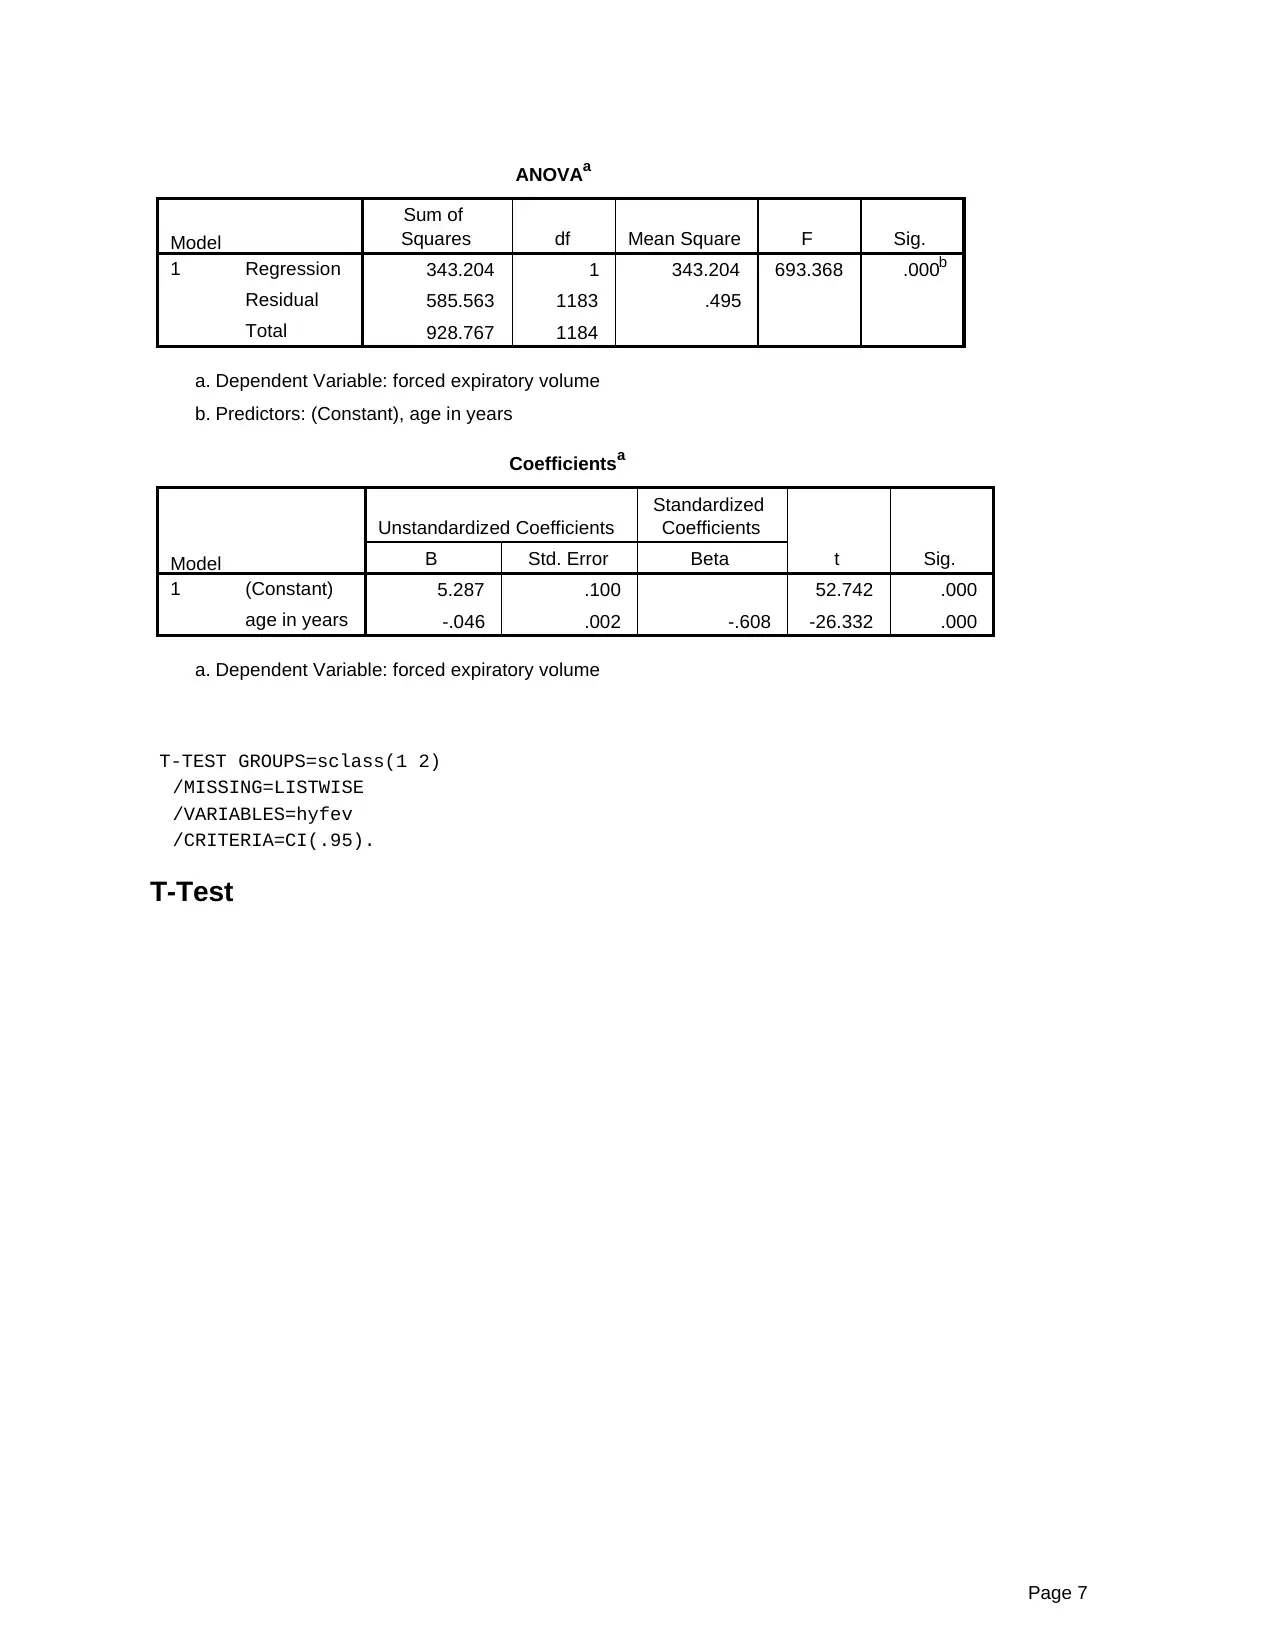
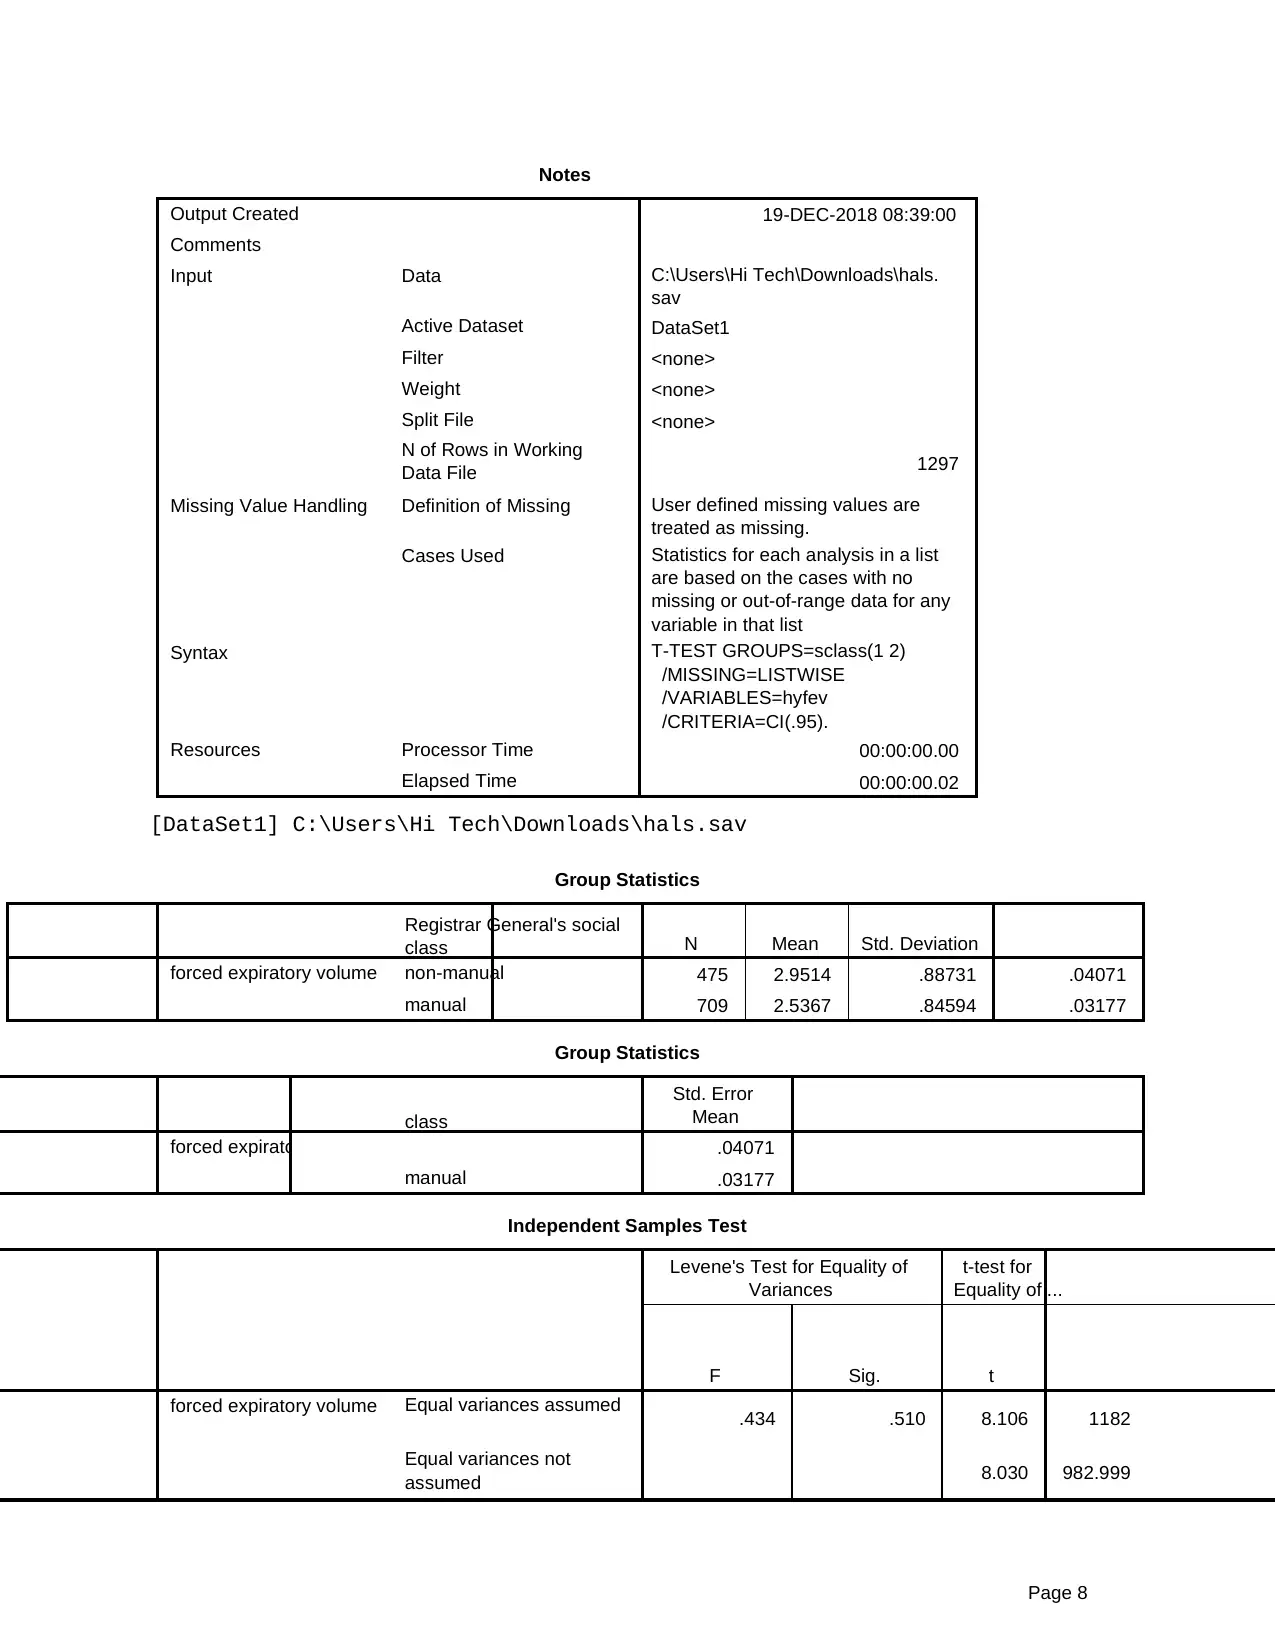
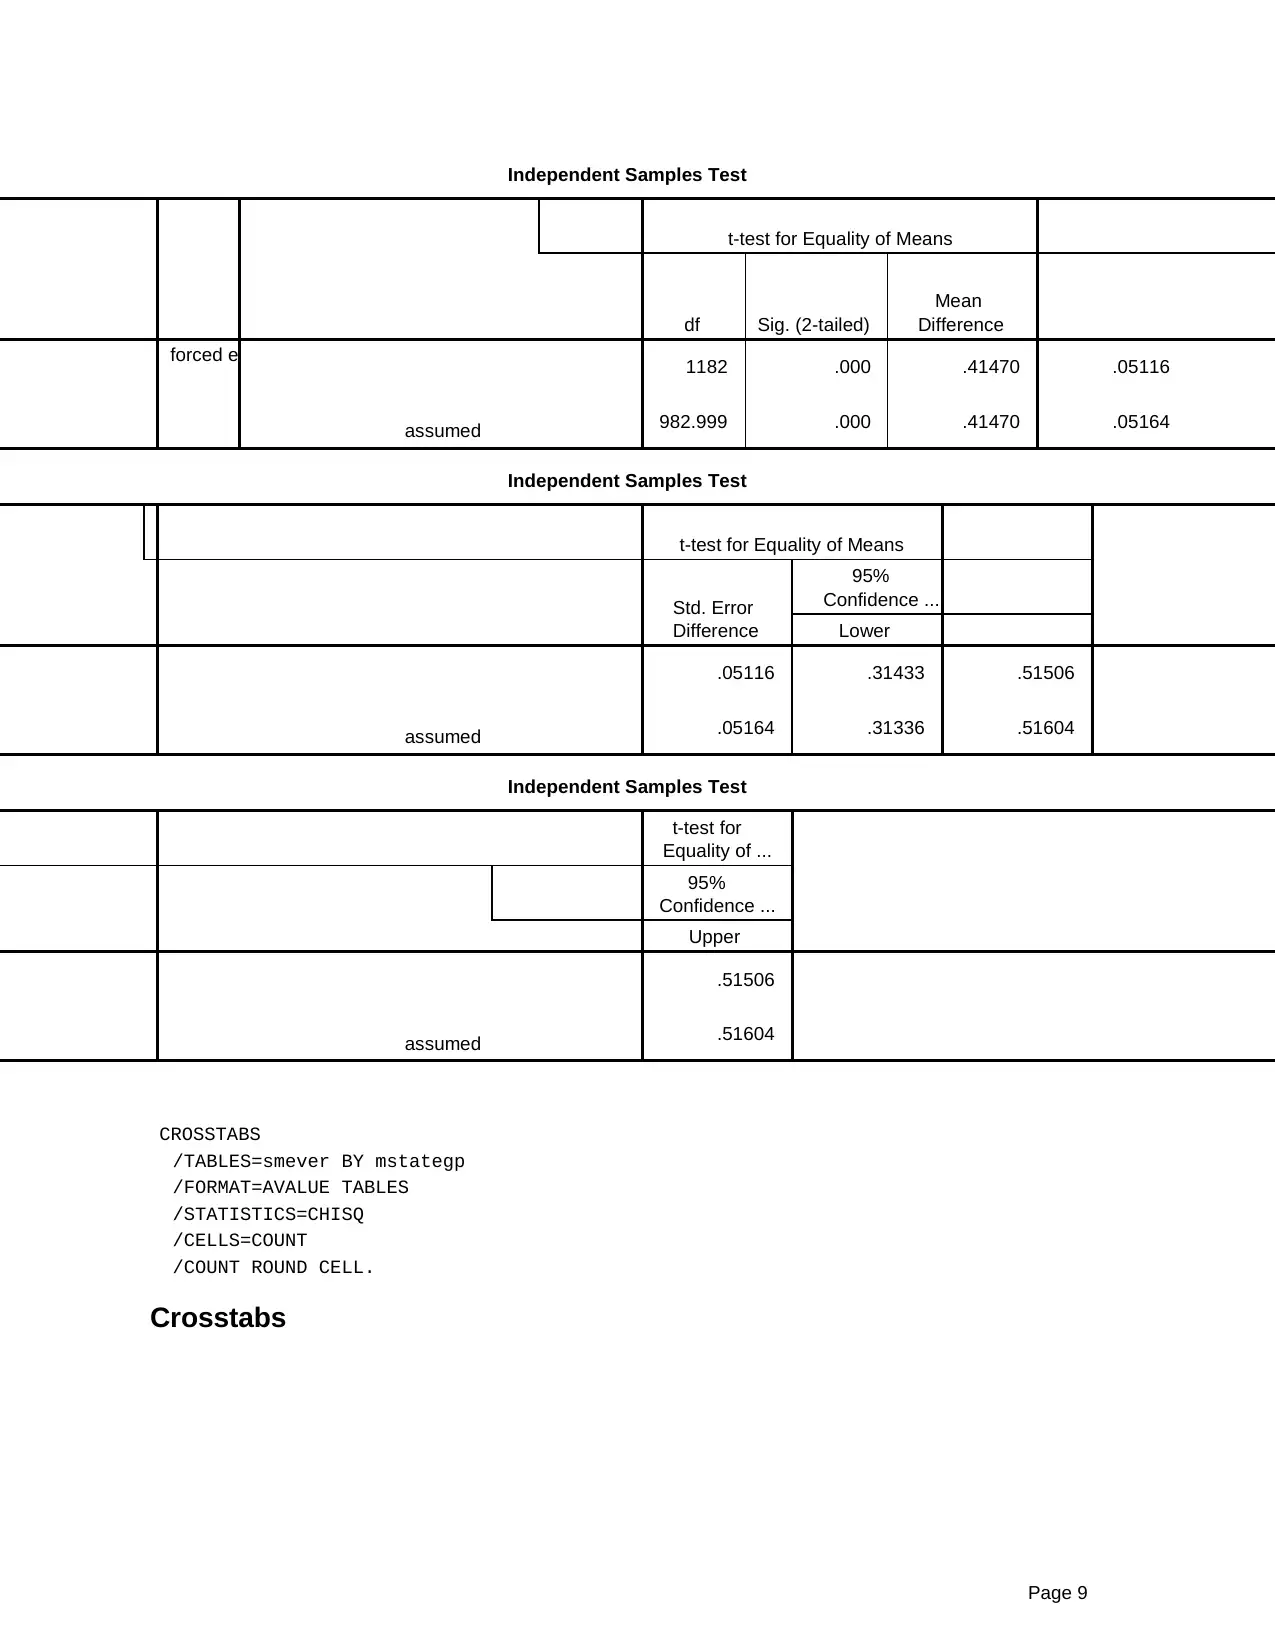
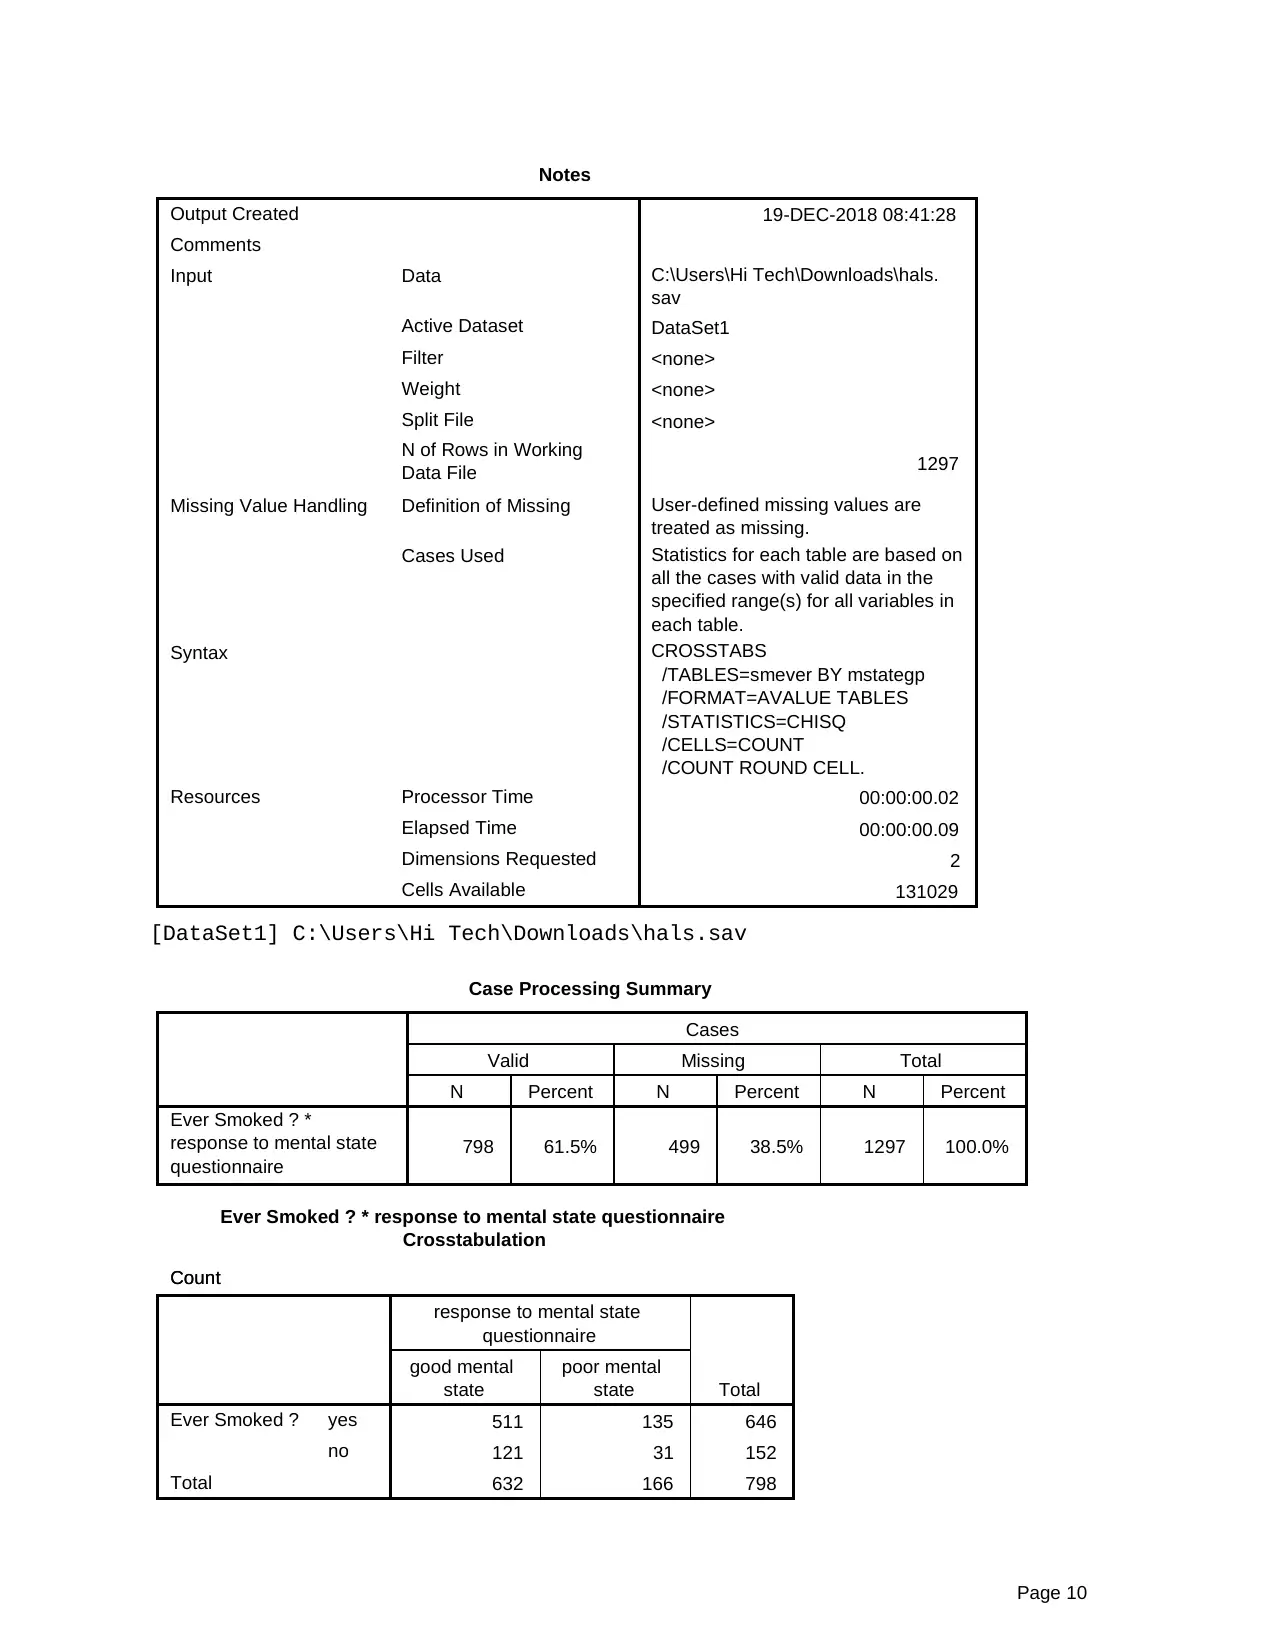
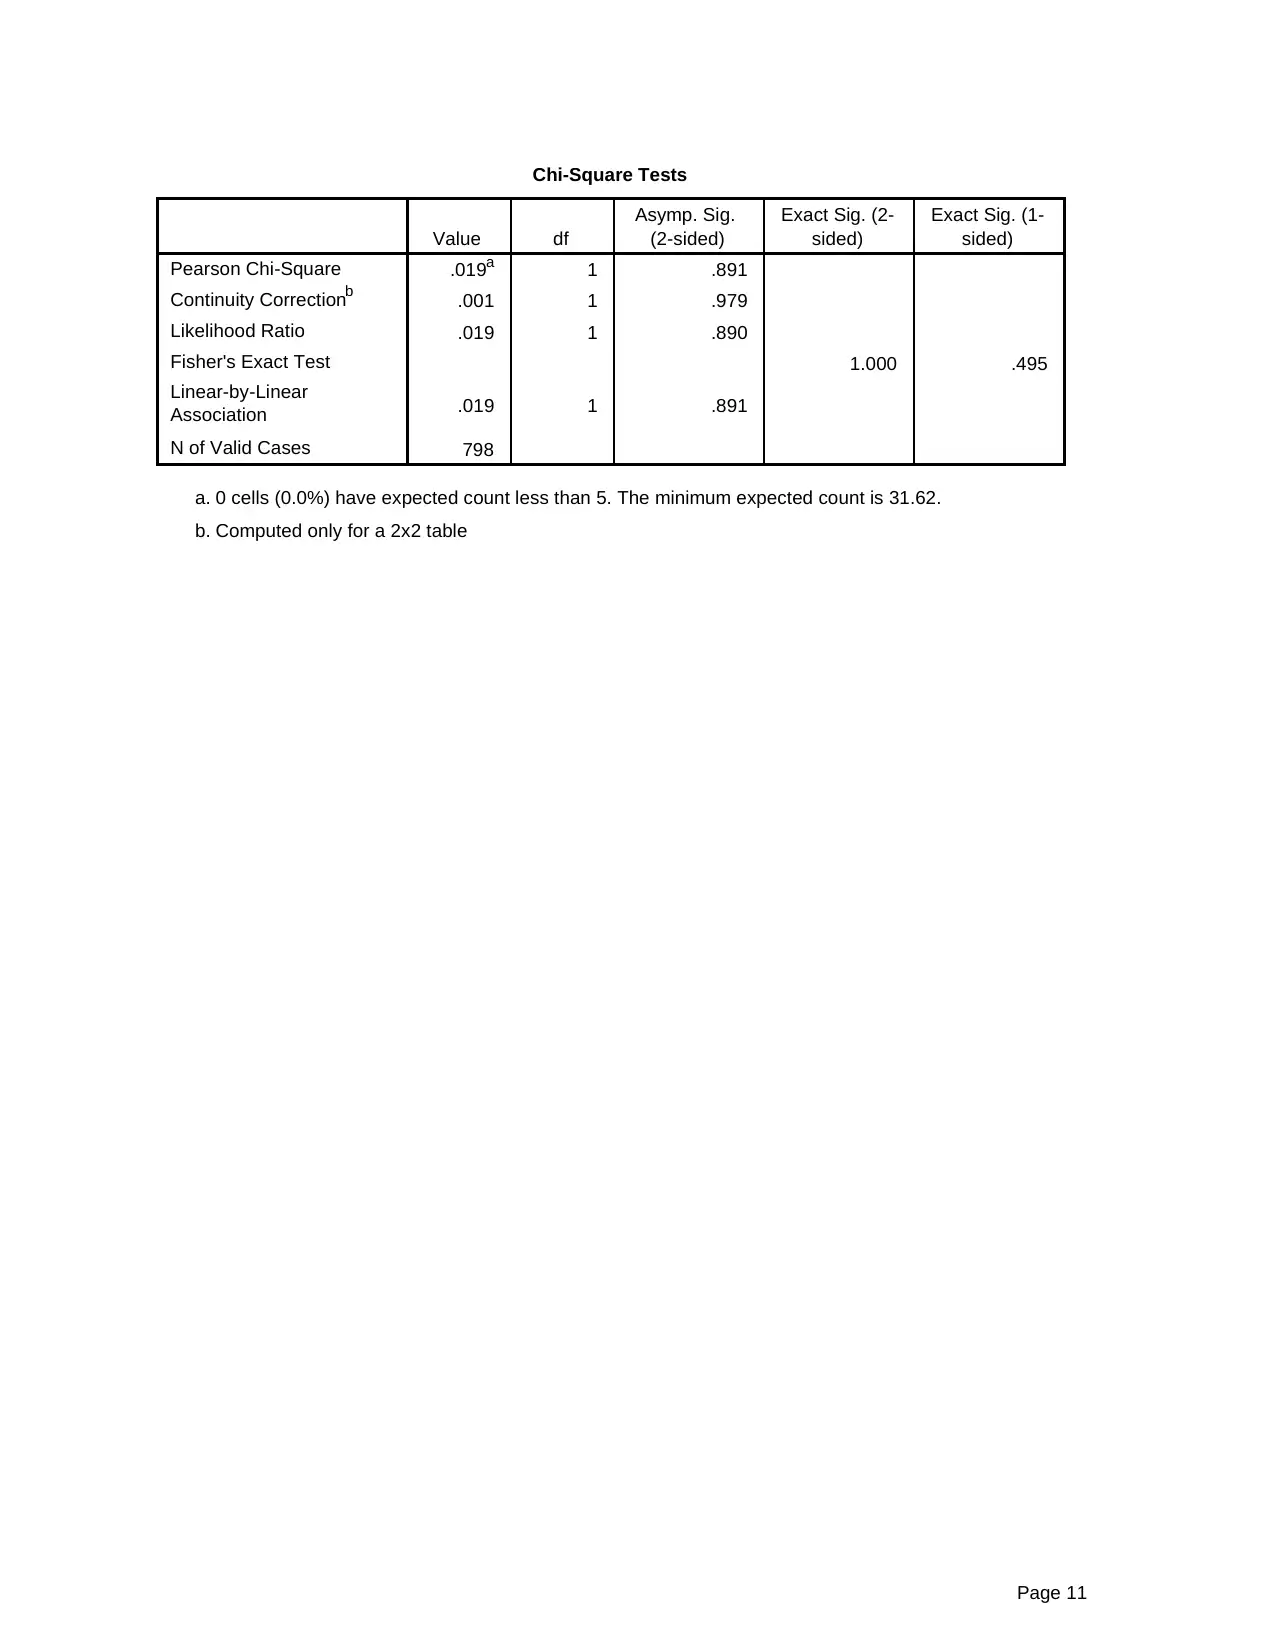
This assignment presents an analysis of quantitative data using IBM SPSS Statistics, focusing on a Health and Lifestyle (HALS) survey of male employees. The analysis includes descriptive statistics, histograms, pie charts, regression analysis, t-tests, and cross-tabulations to investigate answers to lifestyle-related questions. The report interprets the statistical outputs, examining variables such as age, health status, height, weight, and smoking habits in relation to mental state and social class. Key findings include the distribution of ages within the sample, the self-reported health status of participants, the relationship between age and forced expiratory volume, and differences in forced expiratory volume between social classes. Crosstabs are used to explore the relationship between smoking habits and mental state. The report provides a comprehensive overview of the data, using statistical methods to uncover patterns and relationships within the HALS survey.
tabler-icon-diamond-filled.svg

Contribute Materials

Your contribution can guide someone’s learning journey. Share your documents today.
Document Page
GET
FILE='C:\Users\Hi Tech\Downloads\hals.sav'.
DATASET NAME DataSet1 WINDOW=FRONT.
* Chart Builder.
GGRAPH
/GRAPHDATASET NAME="graphdataset" VARIABLES=agyrs MISSING=LISTWISE REPORTMISSING=NO
/GRAPHSPEC SOURCE=INLINE.
BEGIN GPL
SOURCE: s=userSource(id("graphdataset"))
DATA: agyrs=col(source(s), name("agyrs"))
GUIDE: axis(dim(1), label("age in years"))
GUIDE: axis(dim(2), label("Frequency"))
ELEMENT: interval(position(summary.count(bin.rect(agyrs))), shape.interior(shape.square))
END GPL.
GGraph
Notes
Output Created
Comments
Input Data
Active Dataset
Filter
Weight
Split File
N of Rows in Working
Data File
Syntax
Resources Processor Time
Elapsed Time
19-DEC-2018 08:24:57
C:\Users\Hi Tech\Downloads\hals.
sav
DataSet1
<none>
<none>
<none>
1297
GGRAPH
/GRAPHDATASET NAME="
graphdataset" VARIABLES=agyrs
MISSING=LISTWISE
REPORTMISSING=NO
/GRAPHSPEC SOURCE=INLINE.
BEGIN GPL
SOURCE: s=userSource(id
("graphdataset"))
DATA: agyrs=col(source(s), name
("agyrs"))
GUIDE: axis(dim(1), label("age in
years"))
GUIDE: axis(dim(2), label
("Frequency"))
ELEMENT: interval(position
(summary.count(bin.rect(agyrs))),
shape.interior(shape.square))
END GPL.
00:00:01.14
00:00:01.72
[DataSet1] C:\Users\Hi Tech\Downloads\hals.sav
Page 1
tabler-icon-diamond-filled.svg

Secure Best Marks with AI Grader

Need help grading? Try our AI Grader for instant feedback on your assignments.
Document Page
age in years
100806040
Frequency
120.0
100.0
80.0
60.0
40.0
20.0
0.0 21124
10
18
24
50
37
53
36
68
55
62
83
59
77
65
89
74
85
98
111
6
Mean = 56.26
Std. Dev. = 11.72
N = 1,297
Histogram: Age (years)
* Chart Builder.
GGRAPH
/GRAPHDATASET NAME="graphdataset" VARIABLES=ownh COUNT()[name="COUNT"] MISSING=LISTWISE REPORTMISS
/GRAPHSPEC SOURCE=INLINE.
BEGIN GPL
SOURCE: s=userSource(id("graphdataset"))
DATA: ownh=col(source(s), name("ownh"), unit.category())
DATA: COUNT=col(source(s), name("COUNT"))
COORD: polar.theta(startAngle(0))
GUIDE: axis(dim(1), null())
GUIDE: legend(aesthetic(aesthetic.color.interior), label("own health in general"))
SCALE: linear(dim(1), dataMinimum(), dataMaximum())
SCALE: cat(aesthetic(aesthetic.color.interior), include("1", "2", "3", "4"))
ELEMENT: interval.stack(position(summary.percent(COUNT))), color.interior(ownh))
END GPL.
GGraph
Page 2
Document Page
Notes
Output Created
Comments
Input Data
Active Dataset
Filter
Weight
Split File
N of Rows in Working
Data File
Syntax
Resources Processor Time
Elapsed Time
19-DEC-2018 08:27:35
C:\Users\Hi Tech\Downloads\hals.
sav
DataSet1
<none>
<none>
<none>
1297
GGRAPH
/GRAPHDATASET NAME="
graphdataset" VARIABLES=ownh
COUNT()[name="COUNT"]
MISSING=LISTWISE
REPORTMISSING=YES
/GRAPHSPEC SOURCE=INLINE.
BEGIN GPL
SOURCE: s=userSource(id
("graphdataset"))
DATA: ownh=col(source(s), name
("ownh"), unit.category())
DATA: COUNT=col(source(s),
name("COUNT"))
COORD: polar.theta(startAngle(0))
GUIDE: axis(dim(1), null())
GUIDE: legend(aesthetic(aesthetic.
color.interior), label("own health in
general"))
SCALE: linear(dim(1),
dataMinimum(), dataMaximum())
SCALE: cat(aesthetic(aesthetic.
color.interior), include("1", "2", "3",
"4"))
ELEMENT: interval.stack(position
(summary.percent(COUNT))), color.
interior(ownh))
END GPL.
00:00:00.28
00:00:00.41
[DataSet1] C:\Users\Hi Tech\Downloads\hals.sav
Page 3
Document Page
DONT KNOW
POOR
FAIR
GOOD
EXCELLENT
own health in general
Pie Chart: Own Health in General
DESCRIPTIVES VARIABLES=height weight
/STATISTICS=MEAN.
Descriptives
Page 4
tabler-icon-diamond-filled.svg

Secure Best Marks with AI Grader

Need help grading? Try our AI Grader for instant feedback on your assignments.
Document Page
Notes
Output Created
Comments
Input Data
Active Dataset
Filter
Weight
Split File
N of Rows in Working
Data File
Missing Value Handling Definition of Missing
Cases Used
Syntax
Resources Processor Time
Elapsed Time
19-DEC-2018 08:34:27
C:\Users\Hi Tech\Downloads\hals.
sav
DataSet1
<none>
<none>
<none>
1297
User defined missing values are
treated as missing.
All non-missing data are used.
DESCRIPTIVES VARIABLES=height
weight
/STATISTICS=MEAN.
00:00:00.00
00:00:00.06
[DataSet1] C:\Users\Hi Tech\Downloads\hals.sav
Descriptive Statistics
N Mean
Height (cm)
Calculated Nude Weight
(kg)
Valid N (listwise)
1295 172.406
1295 75.295
1295
REGRESSION
/MISSING PAIRWISE
/STATISTICS COEFF OUTS R ANOVA
/CRITERIA=PIN(.05) POUT(.10)
/NOORIGIN
/DEPENDENT hyfev
/METHOD=ENTER agyrs.
Regression
Page 5
Document Page
Notes
Output Created
Comments
Input Data
Active Dataset
Filter
Weight
Split File
N of Rows in Working
Data File
Missing Value Handling Definition of Missing
Cases Used
Syntax
Resources Processor Time
Elapsed Time
Memory Required
Additional Memory
Required for Residual
Plots
19-DEC-2018 08:36:21
C:\Users\Hi Tech\Downloads\hals.
sav
DataSet1
<none>
<none>
<none>
1297
User-defined missing values are
treated as missing.
Correlation coefficients for each pair
of variables are based on all the
cases with valid data for that pair.
Regression statistics are based on
these correlations.
REGRESSION
/MISSING PAIRWISE
/STATISTICS COEFF OUTS R
ANOVA
/CRITERIA=PIN(.05) POUT(.10)
/NOORIGIN
/DEPENDENT hyfev
/METHOD=ENTER agyrs.
00:00:00.02
00:00:00.14
2992 bytes
0 bytes
[DataSet1] C:\Users\Hi Tech\Downloads\hals.sav
Variables Entered/Removeda
Model
Variables
Entered
Variables
Removed Method
1 age in yearsb . Enter
Dependent Variable: forced expiratory volumea.
All requested variables entered.b.
Model Summary
Model R R Square
Adjusted R
Square
Std. Error of
the Estimate
1 .608a .370 .369 .70355
Predictors: (Constant), age in yearsa.
Page 6
Document Page
ANOVAa
Model
Sum of
Squares df Mean Square F Sig.
1 Regression
Residual
Total
343.204 1 343.204 693.368 .000b
585.563 1183 .495
928.767 1184
Dependent Variable: forced expiratory volumea.
Predictors: (Constant), age in yearsb.
Coefficientsa
Model
Unstandardized Coefficients
Standardized
Coefficients
t Sig.B Std. Error Beta
1 (Constant)
age in years
5.287 .100 52.742 .000
-.046 .002 -.608 -26.332 .000
Dependent Variable: forced expiratory volumea.
T-TEST GROUPS=sclass(1 2)
/MISSING=LISTWISE
/VARIABLES=hyfev
/CRITERIA=CI(.95).
T-Test
Page 7
tabler-icon-diamond-filled.svg

Paraphrase This Document

Need a fresh take? Get an instant paraphrase of this document with our AI Paraphraser
Document Page
Notes
Output Created
Comments
Input Data
Active Dataset
Filter
Weight
Split File
N of Rows in Working
Data File
Missing Value Handling Definition of Missing
Cases Used
Syntax
Resources Processor Time
Elapsed Time
19-DEC-2018 08:39:00
C:\Users\Hi Tech\Downloads\hals.
sav
DataSet1
<none>
<none>
<none>
1297
User defined missing values are
treated as missing.
Statistics for each analysis in a list
are based on the cases with no
missing or out-of-range data for any
variable in that list
T-TEST GROUPS=sclass(1 2)
/MISSING=LISTWISE
/VARIABLES=hyfev
/CRITERIA=CI(.95).
00:00:00.00
00:00:00.02
[DataSet1] C:\Users\Hi Tech\Downloads\hals.sav
Group Statistics
Registrar General's social
class N Mean Std. Deviation
forced expiratory volume non-manual
manual
475 2.9514 .88731 .04071
709 2.5367 .84594 .03177
Group Statistics
Registrar General's social
class
Std. Error
Mean
forced expiratory volume non-manual
manual
.04071
.03177
Independent Samples Test
Levene's Test for Equality of
Variances
t-test for
Equality of ...
F Sig. t
forced expiratory volume Equal variances assumed
Equal variances not
assumed
.434 .510 8.106 1182
8.030 982.999
Page 8
Document Page
Independent Samples Test
t-test for Equality of Means
df Sig. (2-tailed)
Mean
Difference
forced expiratory volume Equal variances assumed
Equal variances not
assumed
1182 .000 .41470 .05116
982.999 .000 .41470 .05164
Independent Samples Test
t-test for Equality of Means
Std. Error
Difference
95%
Confidence ...
Lower
forced expiratory volume Equal variances assumed
Equal variances not
assumed
.05116 .31433 .51506
.05164 .31336 .51604
Independent Samples Test
t-test for
Equality of ...
95%
Confidence ...
Upper
forced expiratory volume Equal variances assumed
Equal variances not
assumed
.51506
.51604
CROSSTABS
/TABLES=smever BY mstategp
/FORMAT=AVALUE TABLES
/STATISTICS=CHISQ
/CELLS=COUNT
/COUNT ROUND CELL.
Crosstabs
Page 9
Document Page
Notes
Output Created
Comments
Input Data
Active Dataset
Filter
Weight
Split File
N of Rows in Working
Data File
Missing Value Handling Definition of Missing
Cases Used
Syntax
Resources Processor Time
Elapsed Time
Dimensions Requested
Cells Available
19-DEC-2018 08:41:28
C:\Users\Hi Tech\Downloads\hals.
sav
DataSet1
<none>
<none>
<none>
1297
User-defined missing values are
treated as missing.
Statistics for each table are based on
all the cases with valid data in the
specified range(s) for all variables in
each table.
CROSSTABS
/TABLES=smever BY mstategp
/FORMAT=AVALUE TABLES
/STATISTICS=CHISQ
/CELLS=COUNT
/COUNT ROUND CELL.
00:00:00.02
00:00:00.09
2
131029
[DataSet1] C:\Users\Hi Tech\Downloads\hals.sav
Case Processing Summary
Cases
Valid Missing Total
N Percent N Percent N Percent
Ever Smoked ? *
response to mental state
questionnaire
798 61.5% 499 38.5% 1297 100.0%
Ever Smoked ? * response to mental state questionnaire
Crosstabulation
CountCountCount
response to mental state
questionnaire
Total
good mental
state
poor mental
state
Ever Smoked ? yes
no
Total
511 135 646
121 31 152
632 166 798
CountCount
Page 10
tabler-icon-diamond-filled.svg

Secure Best Marks with AI Grader

Need help grading? Try our AI Grader for instant feedback on your assignments.
Document Page
Chi-Square Tests
Value df
Asymp. Sig.
(2-sided)
Exact Sig. (2-
sided)
Exact Sig. (1-
sided)
Pearson Chi-Square
Continuity Correctionb
Likelihood Ratio
Fisher's Exact Test
Linear-by-Linear
Association
N of Valid Cases
.019a 1 .891
.001 1 .979
.019 1 .890
1.000 .495
.019 1 .891
798
0 cells (0.0%) have expected count less than 5. The minimum expected count is 31.62.a.
Computed only for a 2x2 tableb.
Page 11
chevron_up_icon
1 out of 11
circle_padding
hide_on_mobile
zoom_out_icon
logo.png

Your All-in-One AI-Powered Toolkit for Academic Success.

Available 24*7 on WhatsApp / Email

[object Object]