RMIT University: Coffee Shop Profit Maximization Analysis
VerifiedAdded on 2022/04/22
|10
|1931
|38
Report
AI Summary
This report presents a profit maximization analysis for a traditional Vietnamese coffee shop located in Hanoi. The analysis begins with an examination of demand elasticity, calculating how changes in price affect the quantity demanded. The report then delves into revenue calculations, comparing the shop's revenue at different price points with market averages. Further, the analysis explores the law of diminishing marginal returns, evaluating the impact of labor costs on production and identifying the optimal number of employees. The report also discusses market competition, specifically how the coffee shop can adjust its pricing strategy to maximize profits in both the short and long run, considering factors such as marginal cost and average total cost. The report utilizes tables and figures to illustrate key concepts and support the findings, ultimately recommending strategies to enhance profitability.
Assignment 2 - Profit Maximization Analysis
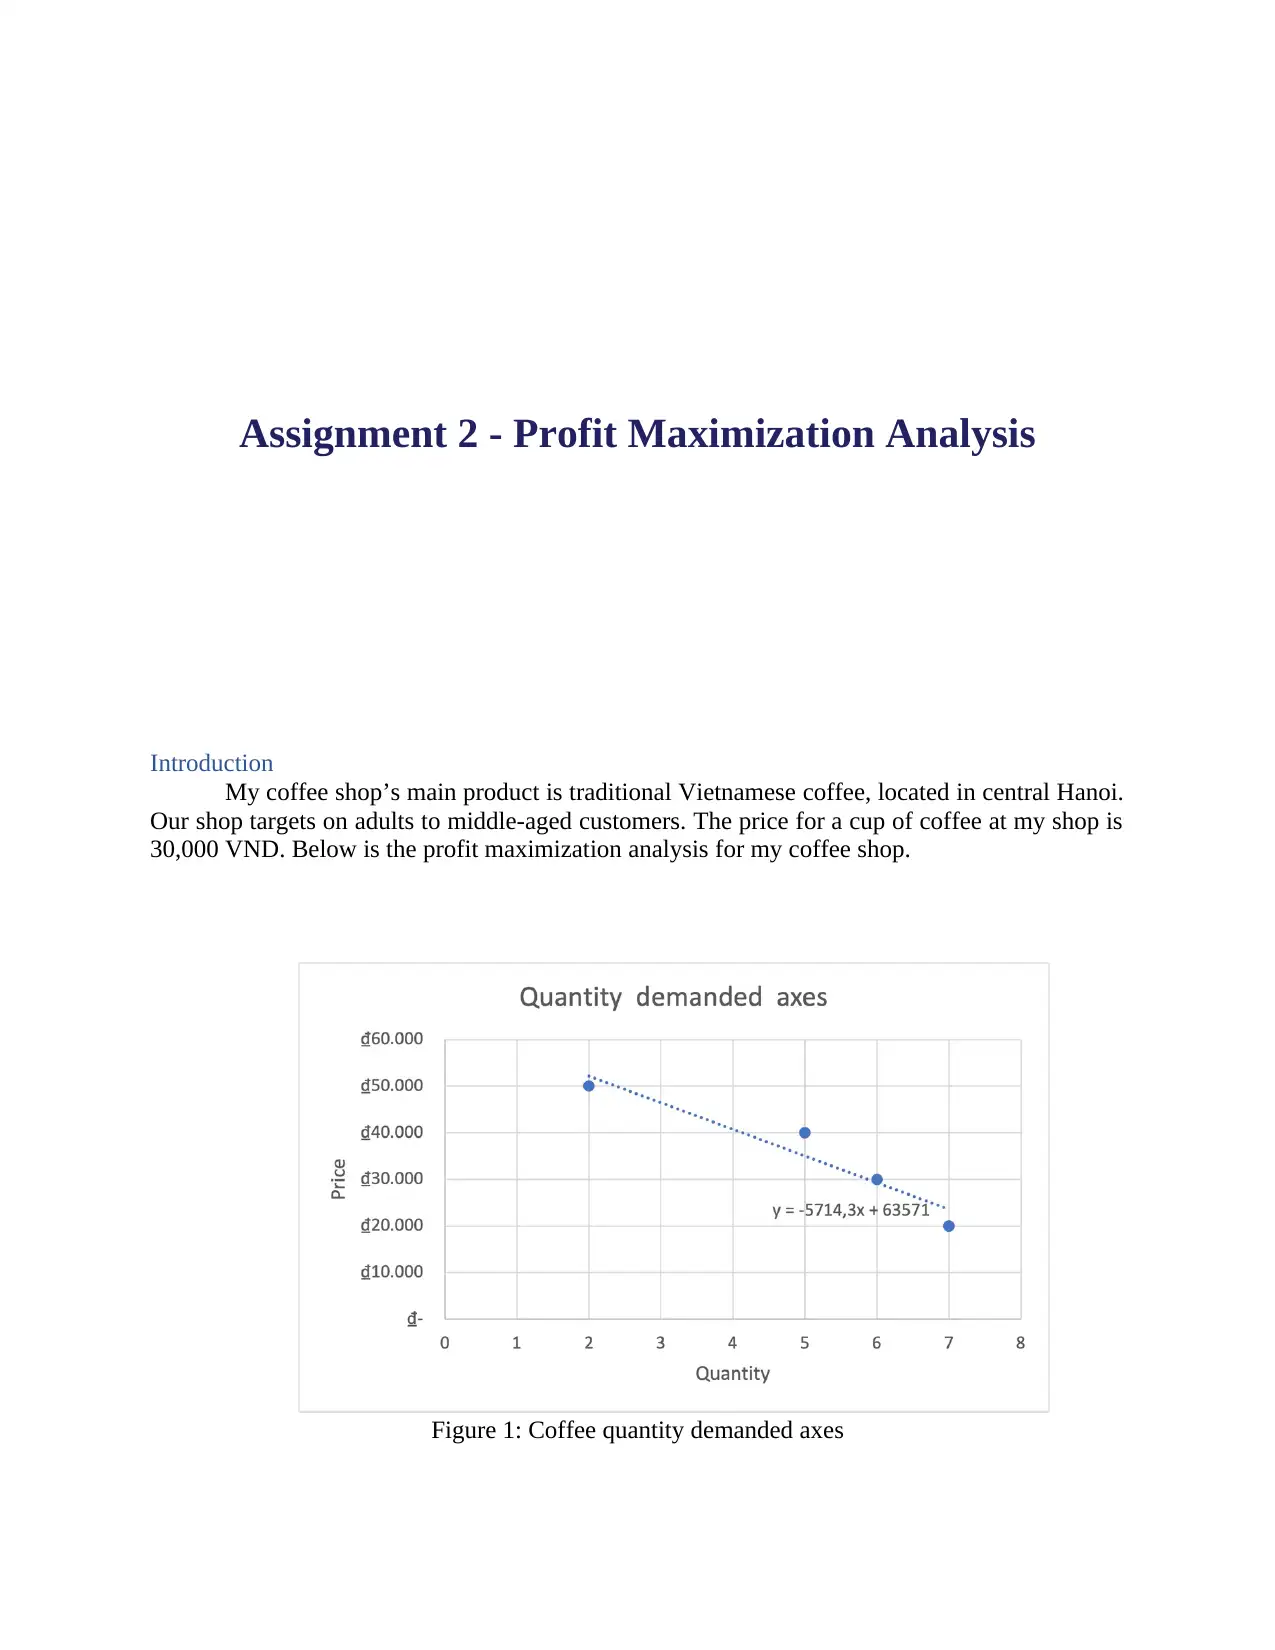
Introduction
My coffee shop’s main product is traditional Vietnamese coffee, located in central Hanoi.
Our shop targets on adults to middle-aged customers. The price for a cup of coffee at my shop is
30,000 VND. Below is the profit maximization analysis for my coffee shop.
Figure 1: Coffee quantity demanded axes
Paraphrase This Document
Need a fresh take? Get an instant paraphrase of this document with our AI Paraphraser
As an economic measure of a variable's responsiveness, elasticity is commonly used to describe
the change in a variable's demand as a function of changes to other variables, such as price
(Hayes A, 2021). The demand curve, on the other hand, is a graphical measure of the
relationship between the cost of a product or service and the quantity demanded over a given
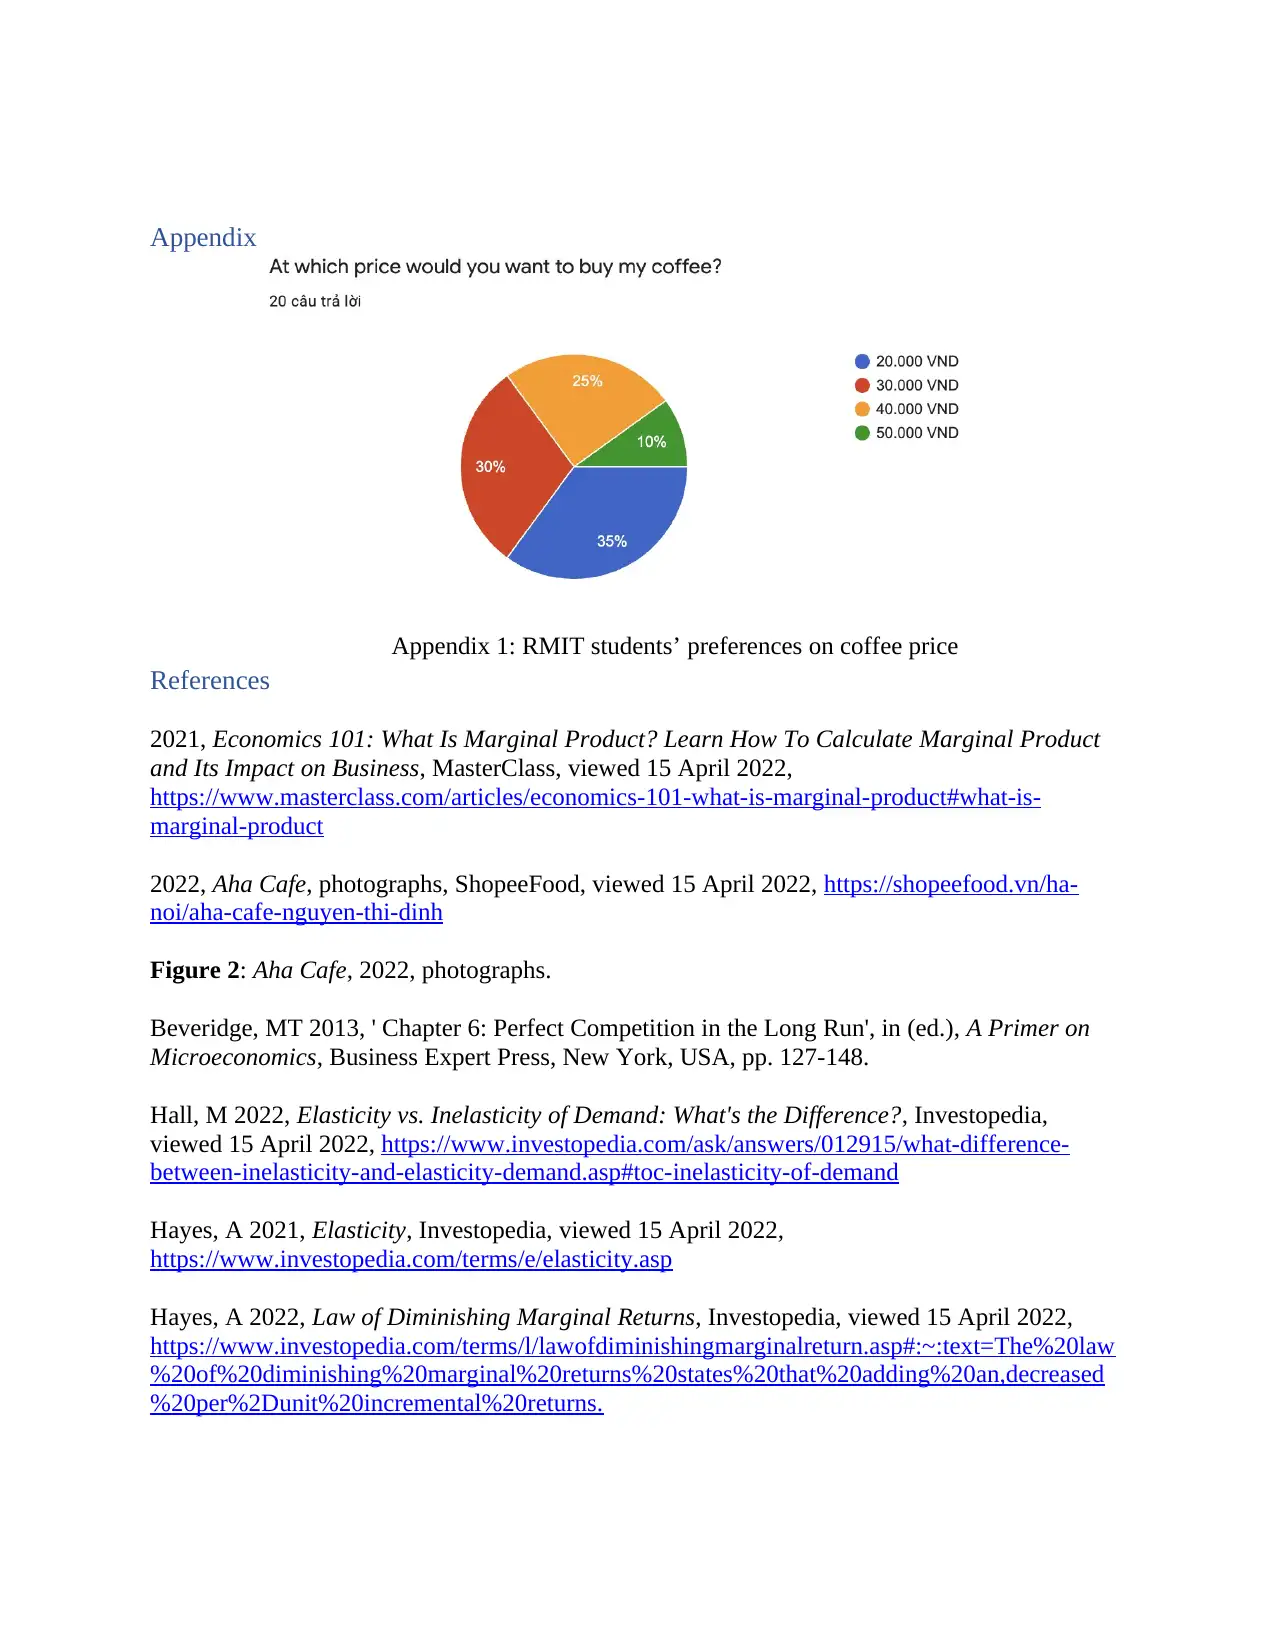
time period. (Kenton W, 2021). According to the survey, a quantity of demand and price table is
made
Price ( VND ) Quantity
20,000 VND (P0) 7 (Q0)
30,000 VND (P1) 6 (Q1)
40,000 VND (P2) 5 (Q2)
50,000 VND (P3) 2 (Q3)
εP 1 = % ∆ Q
% ∆ P = ∆ Qd
∆ Pd * P 0+ P 1
Q0+ Q1 = 6−7
30000−20000 * 20000+30000
7 +6 = -0,38 = |0,38|
εP2 = % ∆ Q
% ∆ P = ∆ Qd
∆ Pd * P 1+ P 2
Q1+Q 2= 5−6
40000−30000 * 30000+40000
5+6 = -0,63 = |0,63|
εP3 = % ∆ Q
% ∆ P = ∆ Qd
∆ Pd * P 2+ P 3
Q2+Q 3 = 2−5
50000−40000 * 40000+50000
2+5 = -3,85 = |3,85|
As can be seen, all of the elasticity quotients are negative which demonstrates that it follows the
Law of Demand. The demand elasticity of a good or service is calculated by subtracting the
percentage change in the quantity demanded from the percentage change in the price.. When the
demand elasticity quotient is larger than or equal to one, it is assumed that the demand is
elasticity. (Hall M, 2022). Based on the above calculation, the demand curve for a coffee goes
inelastic from 20,000 to 40,000 VND (Elasticity quotient<1). By contrast, when the coffee
price rises from 40,000 to 50,000 VND, the demand becomes elastic (Elasticity quotient >1).
According to with elasticity quotient, for every one percent increase in the price of a cup of
coffee, the quantity demanded decreases by one percent.
the change in a variable's demand as a function of changes to other variables, such as price
(Hayes A, 2021). The demand curve, on the other hand, is a graphical measure of the
relationship between the cost of a product or service and the quantity demanded over a given
time period. (Kenton W, 2021). According to the survey, a quantity of demand and price table is
made
Price ( VND ) Quantity
20,000 VND (P0) 7 (Q0)
30,000 VND (P1) 6 (Q1)
40,000 VND (P2) 5 (Q2)
50,000 VND (P3) 2 (Q3)
εP 1 = % ∆ Q
% ∆ P = ∆ Qd
∆ Pd * P 0+ P 1
Q0+ Q1 = 6−7
30000−20000 * 20000+30000
7 +6 = -0,38 = |0,38|
εP2 = % ∆ Q
% ∆ P = ∆ Qd
∆ Pd * P 1+ P 2
Q1+Q 2= 5−6
40000−30000 * 30000+40000
5+6 = -0,63 = |0,63|
εP3 = % ∆ Q
% ∆ P = ∆ Qd
∆ Pd * P 2+ P 3
Q2+Q 3 = 2−5
50000−40000 * 40000+50000
2+5 = -3,85 = |3,85|
As can be seen, all of the elasticity quotients are negative which demonstrates that it follows the
Law of Demand. The demand elasticity of a good or service is calculated by subtracting the
percentage change in the quantity demanded from the percentage change in the price.. When the
demand elasticity quotient is larger than or equal to one, it is assumed that the demand is
elasticity. (Hall M, 2022). Based on the above calculation, the demand curve for a coffee goes
inelastic from 20,000 to 40,000 VND (Elasticity quotient<1). By contrast, when the coffee
price rises from 40,000 to 50,000 VND, the demand becomes elastic (Elasticity quotient >1).
According to with elasticity quotient, for every one percent increase in the price of a cup of
coffee, the quantity demanded decreases by one percent.
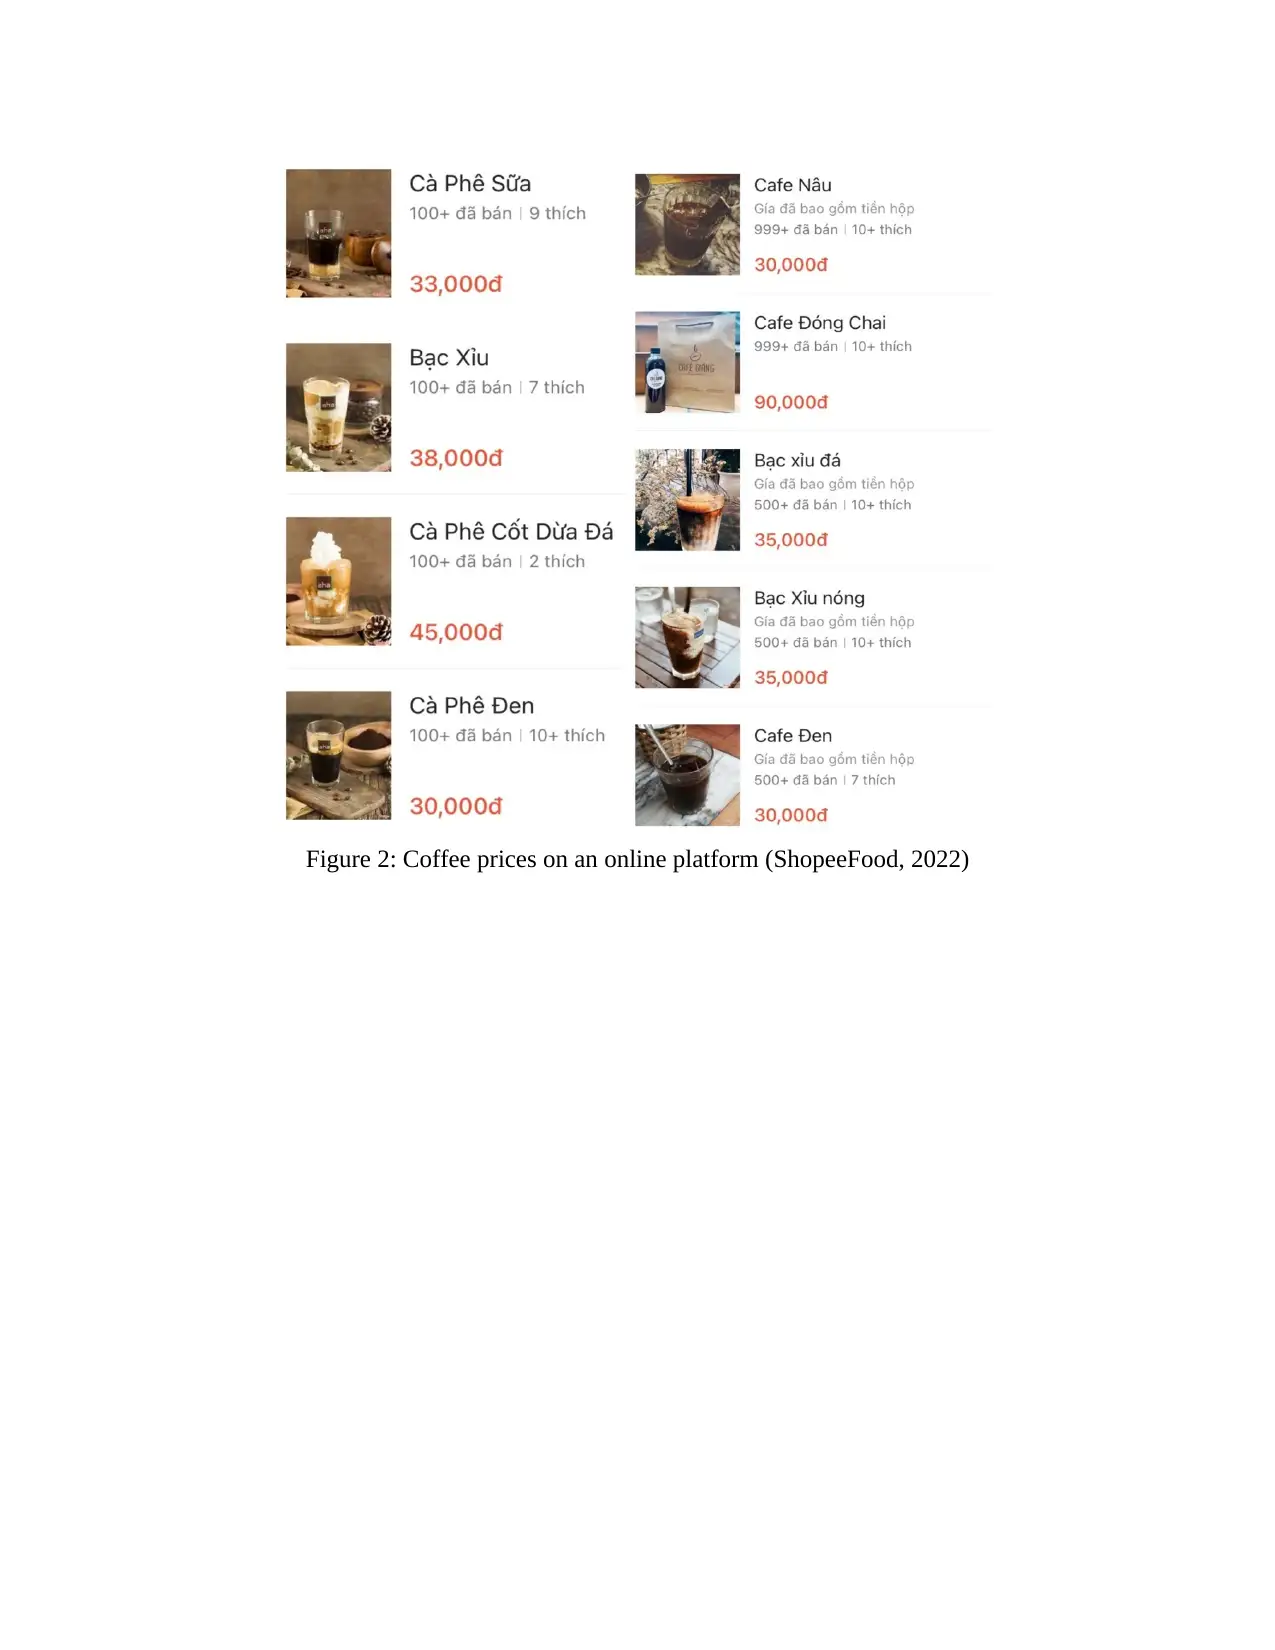
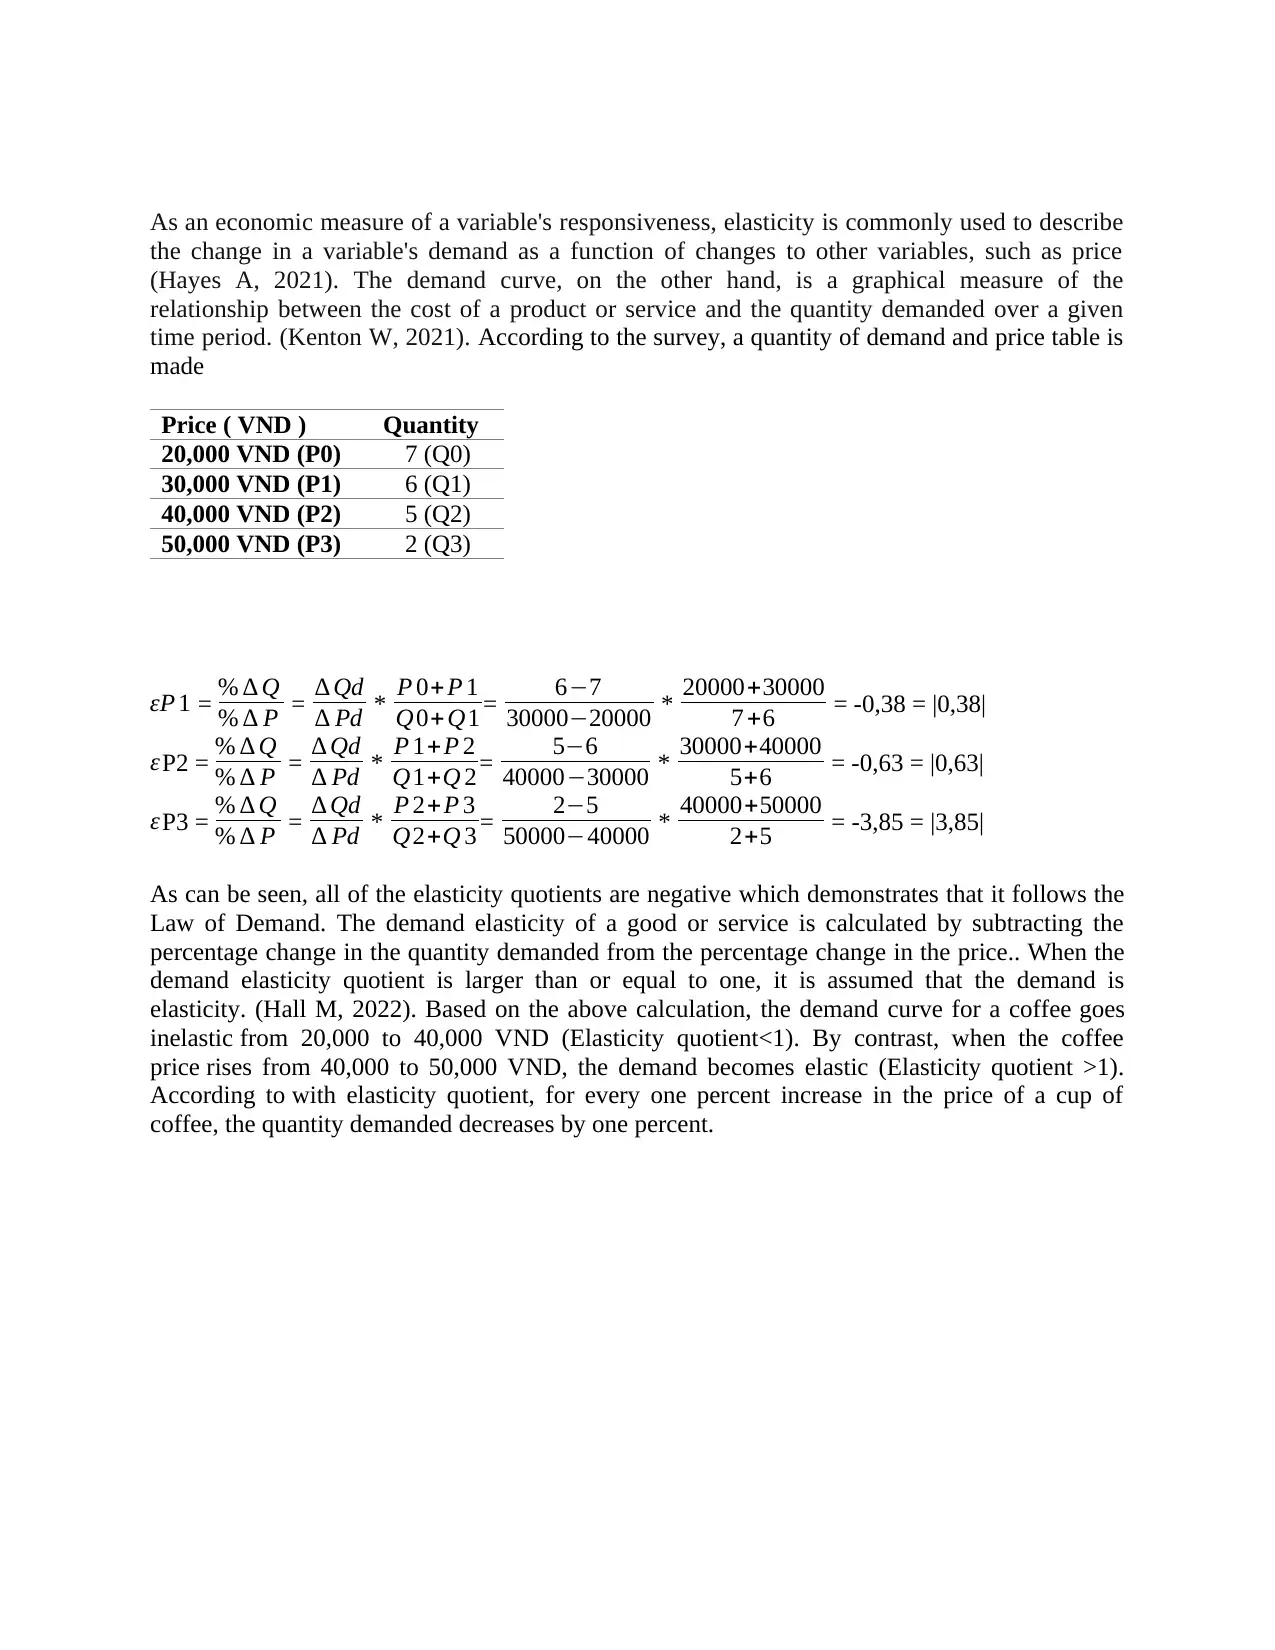
Figure 2: Coffee prices on an online platform (ShopeeFood, 2022)
⊘ This is a preview!⊘
Do you want full access?
Subscribe today to unlock all pages.
Trusted by 1+ million students worldwide
Figure 3: Coffee prices in a coffee shop in Ha Noi (HighlandsCoffee n.d.)
To calculate the total revenue (TR), the formula is: TR = Q x P
Therefore, the calculation for TR can be demonstrated from the quantity of demand and price
table:
TR0 = P0 x Q0 = 20,000 x 7 = 140,000
TR1 = P1 x Q1 = 30,000 x 6 = 180,000
TR2 = P2 x Q2 = 40,000 x 5 = 200,000
TR3 = P3 x Q3 = 50,000 x 2 = 100,000
Figures 2 and 3 portray the average cost of 35.000 VND for a cup of coffee, which is the
most similar to the survey price of 30,000 (P1). To determine the average market price for
coffee, the TR they have with the same quantity of P1 is:
TR market = 35,000 x Q1 = 35,000 x 6 = 210,000
If my coffee is sold at 30.000 VND for a cup, the TR will be 180,000 VND, which is 30,000
VND lower than the average market price. To maximize the profit and ensure the quantity
demanded, I would increase the price to 35,000 VND for a coffee.
In the figure below, we can see how pricing elasticity varies along the curve in relation to TR:
Paraphrase This Document
Need a fresh take? Get an instant paraphrase of this document with our AI Paraphraser
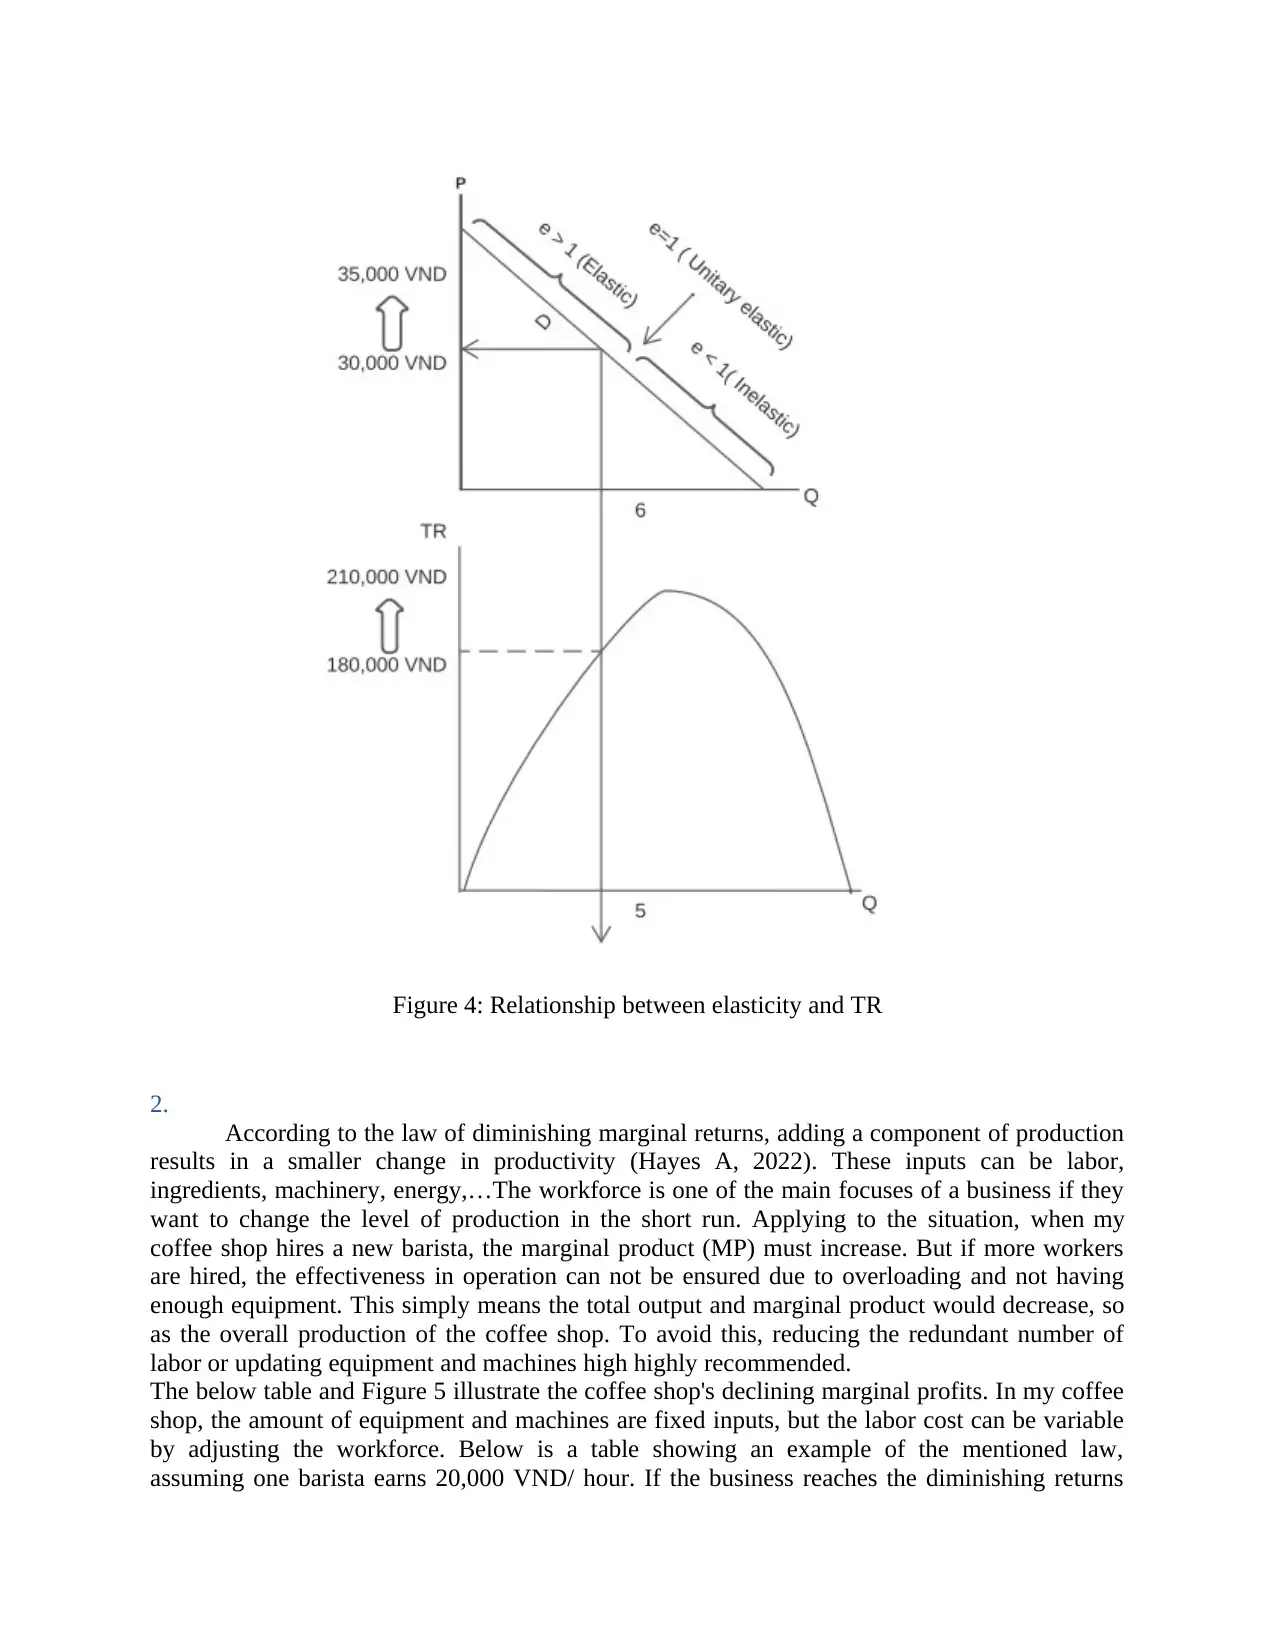
Figure 4: Relationship between elasticity and TR
2.
According to the law of diminishing marginal returns, adding a component of production
results in a smaller change in productivity (Hayes A, 2022). These inputs can be labor,
ingredients, machinery, energy,…The workforce is one of the main focuses of a business if they
want to change the level of production in the short run. Applying to the situation, when my
coffee shop hires a new barista, the marginal product (MP) must increase. But if more workers
are hired, the effectiveness in operation can not be ensured due to overloading and not having
enough equipment. This simply means the total output and marginal product would decrease, so
as the overall production of the coffee shop. To avoid this, reducing the redundant number of
labor or updating equipment and machines high highly recommended.
The below table and Figure 5 illustrate the coffee shop's declining marginal profits. In my coffee
shop, the amount of equipment and machines are fixed inputs, but the labor cost can be variable
by adjusting the workforce. Below is a table showing an example of the mentioned law,
assuming one barista earns 20,000 VND/ hour. If the business reaches the diminishing returns
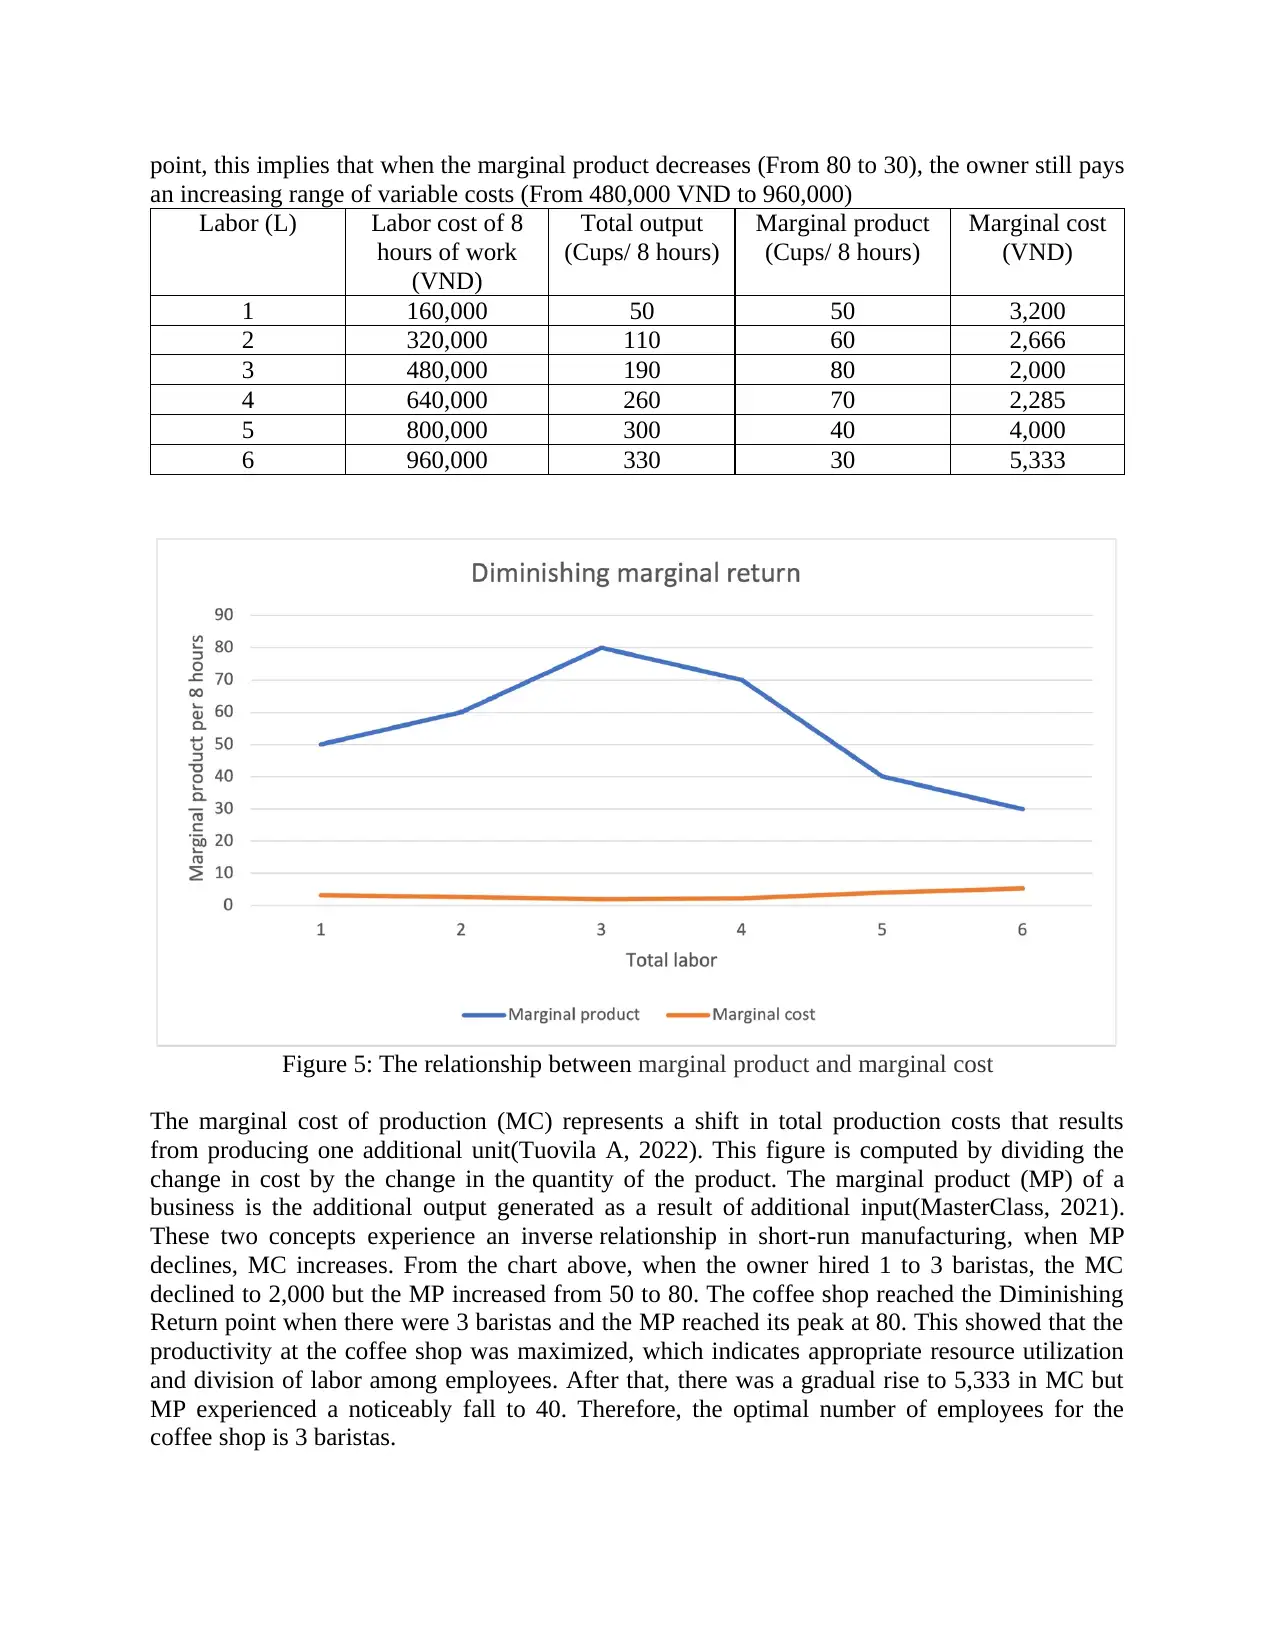
point, this implies that when the marginal product decreases (From 80 to 30), the owner still pays
an increasing range of variable costs (From 480,000 VND to 960,000)
Labor (L) Labor cost of 8
hours of work
(VND)
Total output
(Cups/ 8 hours)
Marginal product
(Cups/ 8 hours)
Marginal cost
(VND)
1 160,000 50 50 3,200
2 320,000 110 60 2,666
3 480,000 190 80 2,000
4 640,000 260 70 2,285
5 800,000 300 40 4,000
6 960,000 330 30 5,333
Figure 5: The relationship between marginal product and marginal cost
The marginal cost of production (MC) represents a shift in total production costs that results
from producing one additional unit(Tuovila A, 2022). This figure is computed by dividing the
change in cost by the change in the quantity of the product. The marginal product (MP) of a
business is the additional output generated as a result of additional input(MasterClass, 2021).
These two concepts experience an inverse relationship in short-run manufacturing, when MP
declines, MC increases. From the chart above, when the owner hired 1 to 3 baristas, the MC
declined to 2,000 but the MP increased from 50 to 80. The coffee shop reached the Diminishing
Return point when there were 3 baristas and the MP reached its peak at 80. This showed that the
productivity at the coffee shop was maximized, which indicates appropriate resource utilization
and division of labor among employees. After that, there was a gradual rise to 5,333 in MC but
MP experienced a noticeably fall to 40. Therefore, the optimal number of employees for the
coffee shop is 3 baristas.
⊘ This is a preview!⊘
Do you want full access?
Subscribe today to unlock all pages.
Trusted by 1+ million students worldwide
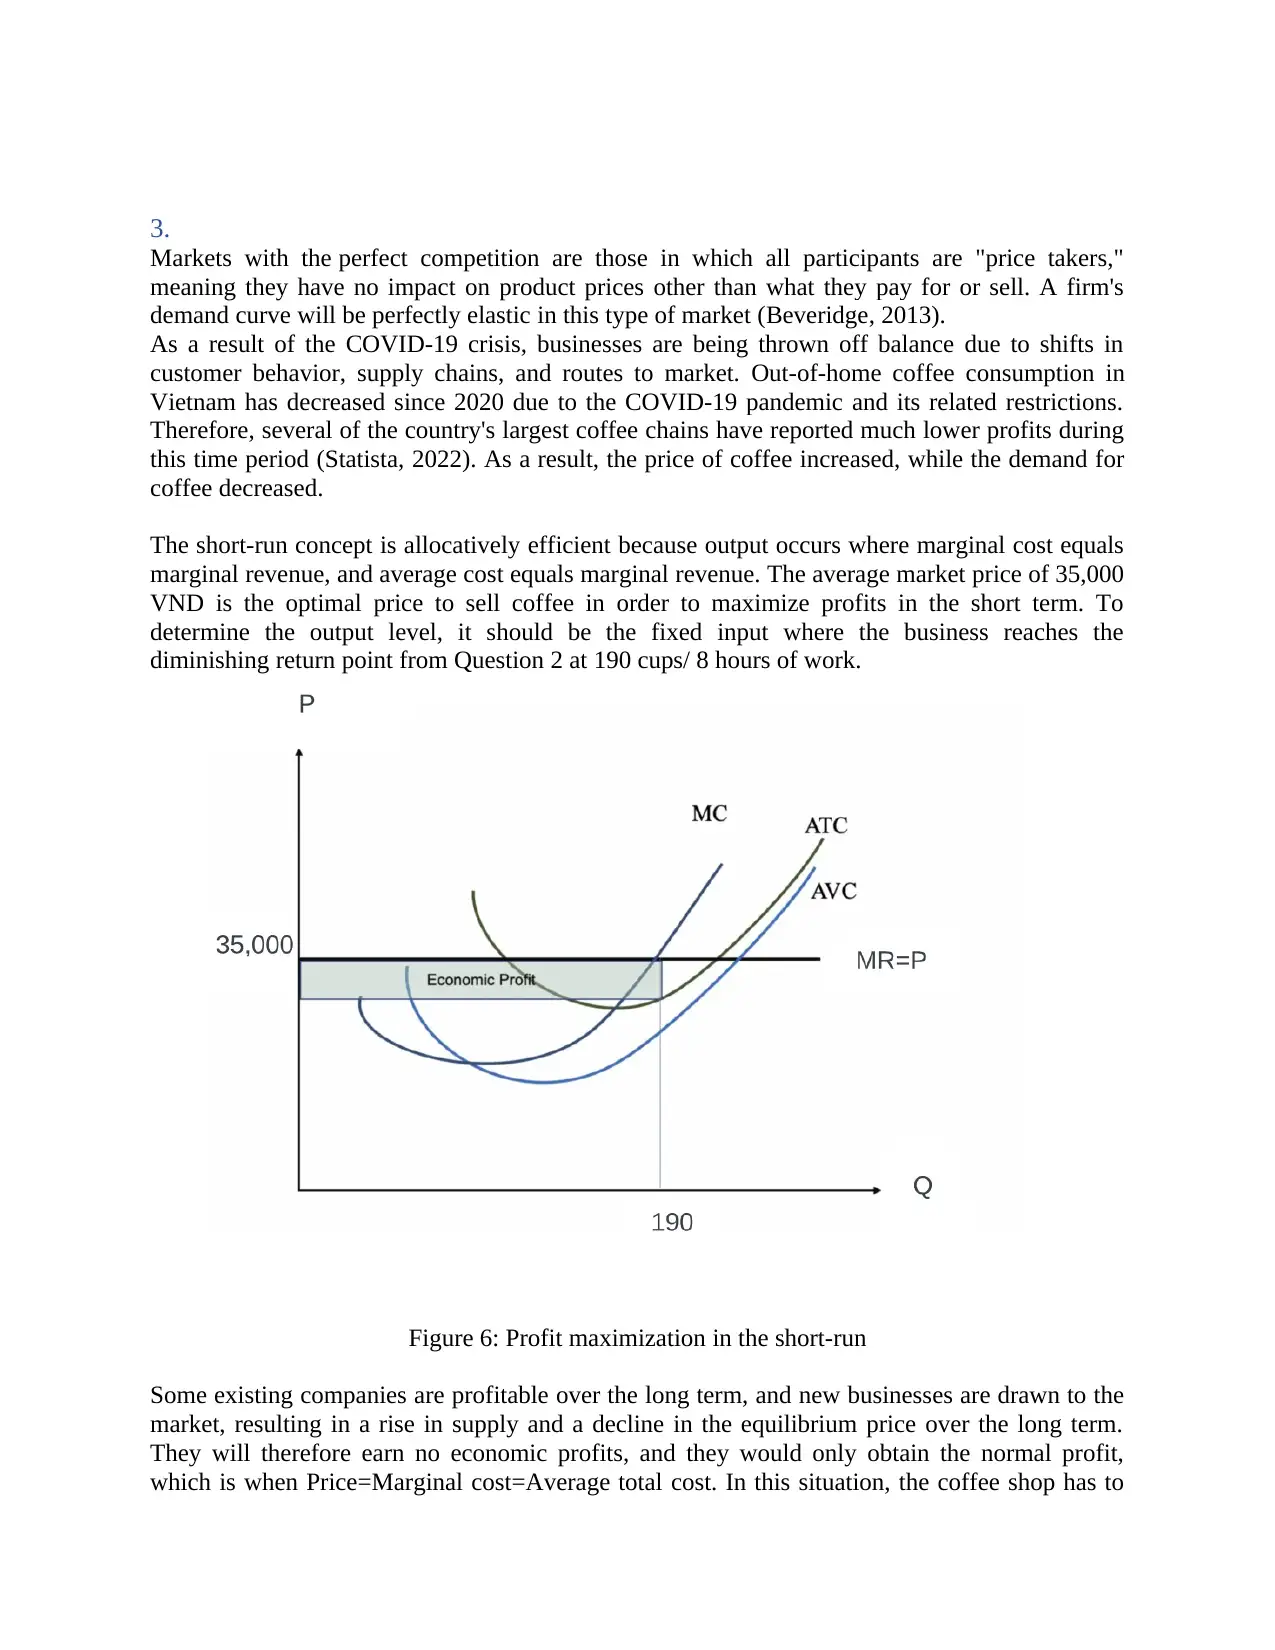
3.
Markets with the perfect competition are those in which all participants are "price takers,"
meaning they have no impact on product prices other than what they pay for or sell. A firm's
demand curve will be perfectly elastic in this type of market (Beveridge, 2013).
As a result of the COVID-19 crisis, businesses are being thrown off balance due to shifts in
customer behavior, supply chains, and routes to market. Out-of-home coffee consumption in
Vietnam has decreased since 2020 due to the COVID-19 pandemic and its related restrictions.
Therefore, several of the country's largest coffee chains have reported much lower profits during
this time period (Statista, 2022). As a result, the price of coffee increased, while the demand for
coffee decreased.
The short-run concept is allocatively efficient because output occurs where marginal cost equals
marginal revenue, and average cost equals marginal revenue. The average market price of 35,000
VND is the optimal price to sell coffee in order to maximize profits in the short term. To
determine the output level, it should be the fixed input where the business reaches the
diminishing return point from Question 2 at 190 cups/ 8 hours of work.
Figure 6: Profit maximization in the short-run
Some existing companies are profitable over the long term, and new businesses are drawn to the
market, resulting in a rise in supply and a decline in the equilibrium price over the long term.
They will therefore earn no economic profits, and they would only obtain the normal profit,
which is when Price=Marginal cost=Average total cost. In this situation, the coffee shop has to
Paraphrase This Document
Need a fresh take? Get an instant paraphrase of this document with our AI Paraphraser
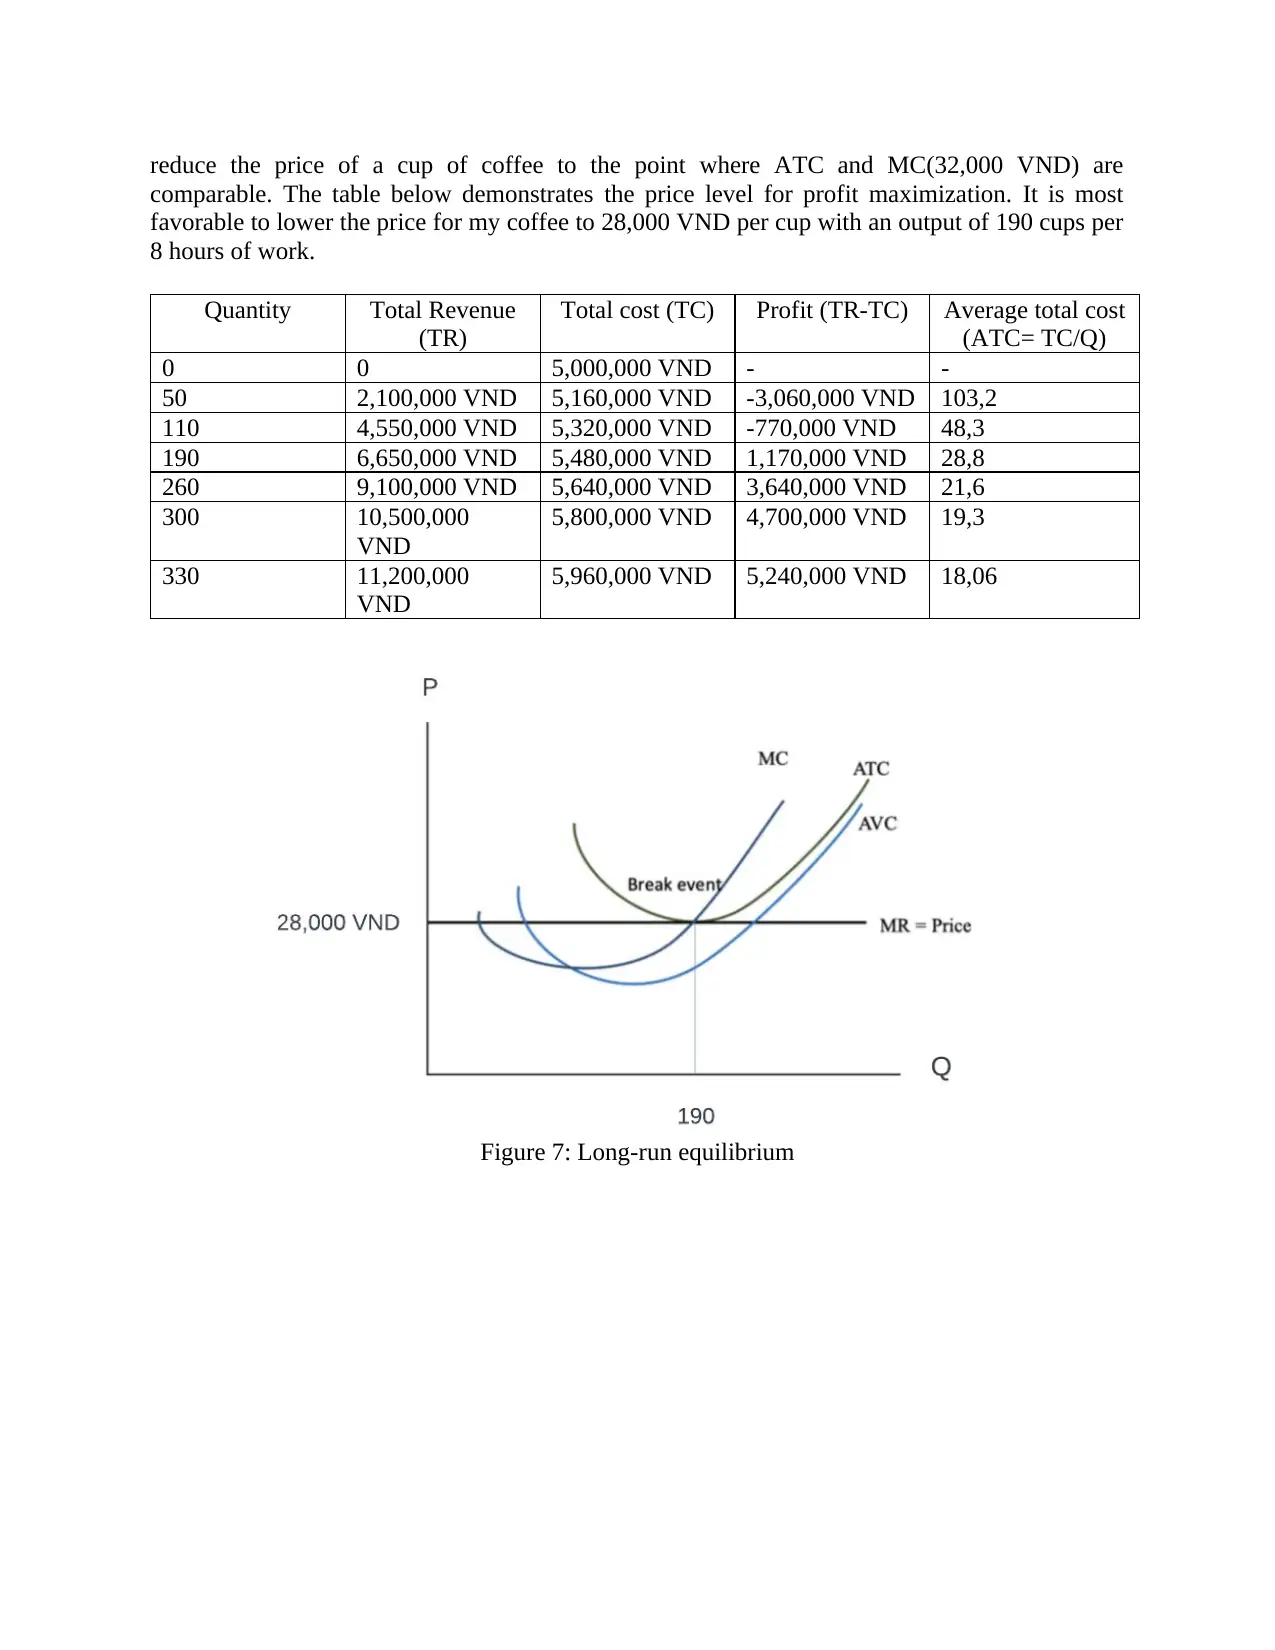
reduce the price of a cup of coffee to the point where ATC and MC(32,000 VND) are
comparable. The table below demonstrates the price level for profit maximization. It is most
favorable to lower the price for my coffee to 28,000 VND per cup with an output of 190 cups per
8 hours of work.
Quantity Total Revenue
(TR)
Total cost (TC) Profit (TR-TC) Average total cost
(ATC= TC/Q)
0 0 5,000,000 VND - -
50 2,100,000 VND 5,160,000 VND -3,060,000 VND 103,2
110 4,550,000 VND 5,320,000 VND -770,000 VND 48,3
190 6,650,000 VND 5,480,000 VND 1,170,000 VND 28,8
260 9,100,000 VND 5,640,000 VND 3,640,000 VND 21,6
300 10,500,000
VND
5,800,000 VND 4,700,000 VND 19,3
330 11,200,000
VND
5,960,000 VND 5,240,000 VND 18,06
Figure 7: Long-run equilibrium
Appendix
Appendix 1: RMIT students’ preferences on coffee price
References
2021, Economics 101: What Is Marginal Product? Learn How To Calculate Marginal Product
and Its Impact on Business, MasterClass, viewed 15 April 2022,
https://www.masterclass.com/articles/economics-101-what-is-marginal-product#what-is-
marginal-product
2022, Aha Cafe, photographs, ShopeeFood, viewed 15 April 2022, https://shopeefood.vn/ha-
noi/aha-cafe-nguyen-thi-dinh
Figure 2: Aha Cafe, 2022, photographs.
Beveridge, MT 2013, ' Chapter 6: Perfect Competition in the Long Run', in (ed.), A Primer on
Microeconomics, Business Expert Press, New York, USA, pp. 127-148.
Hall, M 2022, Elasticity vs. Inelasticity of Demand: What's the Difference?, Investopedia,
viewed 15 April 2022, https://www.investopedia.com/ask/answers/012915/what-difference-
between-inelasticity-and-elasticity-demand.asp#toc-inelasticity-of-demand
Hayes, A 2021, Elasticity, Investopedia, viewed 15 April 2022,
https://www.investopedia.com/terms/e/elasticity.asp
Hayes, A 2022, Law of Diminishing Marginal Returns, Investopedia, viewed 15 April 2022,
https://www.investopedia.com/terms/l/lawofdiminishingmarginalreturn.asp#:~:text=The%20law
%20of%20diminishing%20marginal%20returns%20states%20that%20adding%20an,decreased
%20per%2Dunit%20incremental%20returns.
⊘ This is a preview!⊘
Do you want full access?
Subscribe today to unlock all pages.
Trusted by 1+ million students worldwide
Kenton, W 2021, Demand Curve, Investopedia, viewed 15 April 2022,
https://www.investopedia.com/terms/d/demand-curve.asp
Nguyen, NM 2022, Coffee market in Vietnam - statistics & facts, Statista, Statista database,
https://www.statista.com/topics/7590/coffee-market-in-vietnam/#dossierKeyfigures
Tuovila, A 2022, Marginal Cost of Production, Investopedia, viewed 15 April 2022,
https://www.investopedia.com/terms/m/marginalcostofproduction.asp
n.d, THỰC ĐƠN GIAO HÀNG, illustrations, HighlandsCoffee, viewed 15 April 2022,
https://www.highlandscoffee.com.vn/vn/thuc-don.html
Figure 3 : THỰC ĐƠN GIAO HÀNG by , illustrations.
1 out of 10
Your All-in-One AI-Powered Toolkit for Academic Success.
+13062052269
info@desklib.com
Available 24*7 on WhatsApp / Email
![[object Object]](/_next/static/media/star-bottom.7253800d.svg)
Unlock your academic potential
Copyright © 2020–2026 A2Z Services. All Rights Reserved. Developed and managed by ZUCOL.