Hardness Testing Lab Report QHT1
VerifiedAdded on 2019/09/19
|3
|651
|123
Practical Assignment
AI Summary
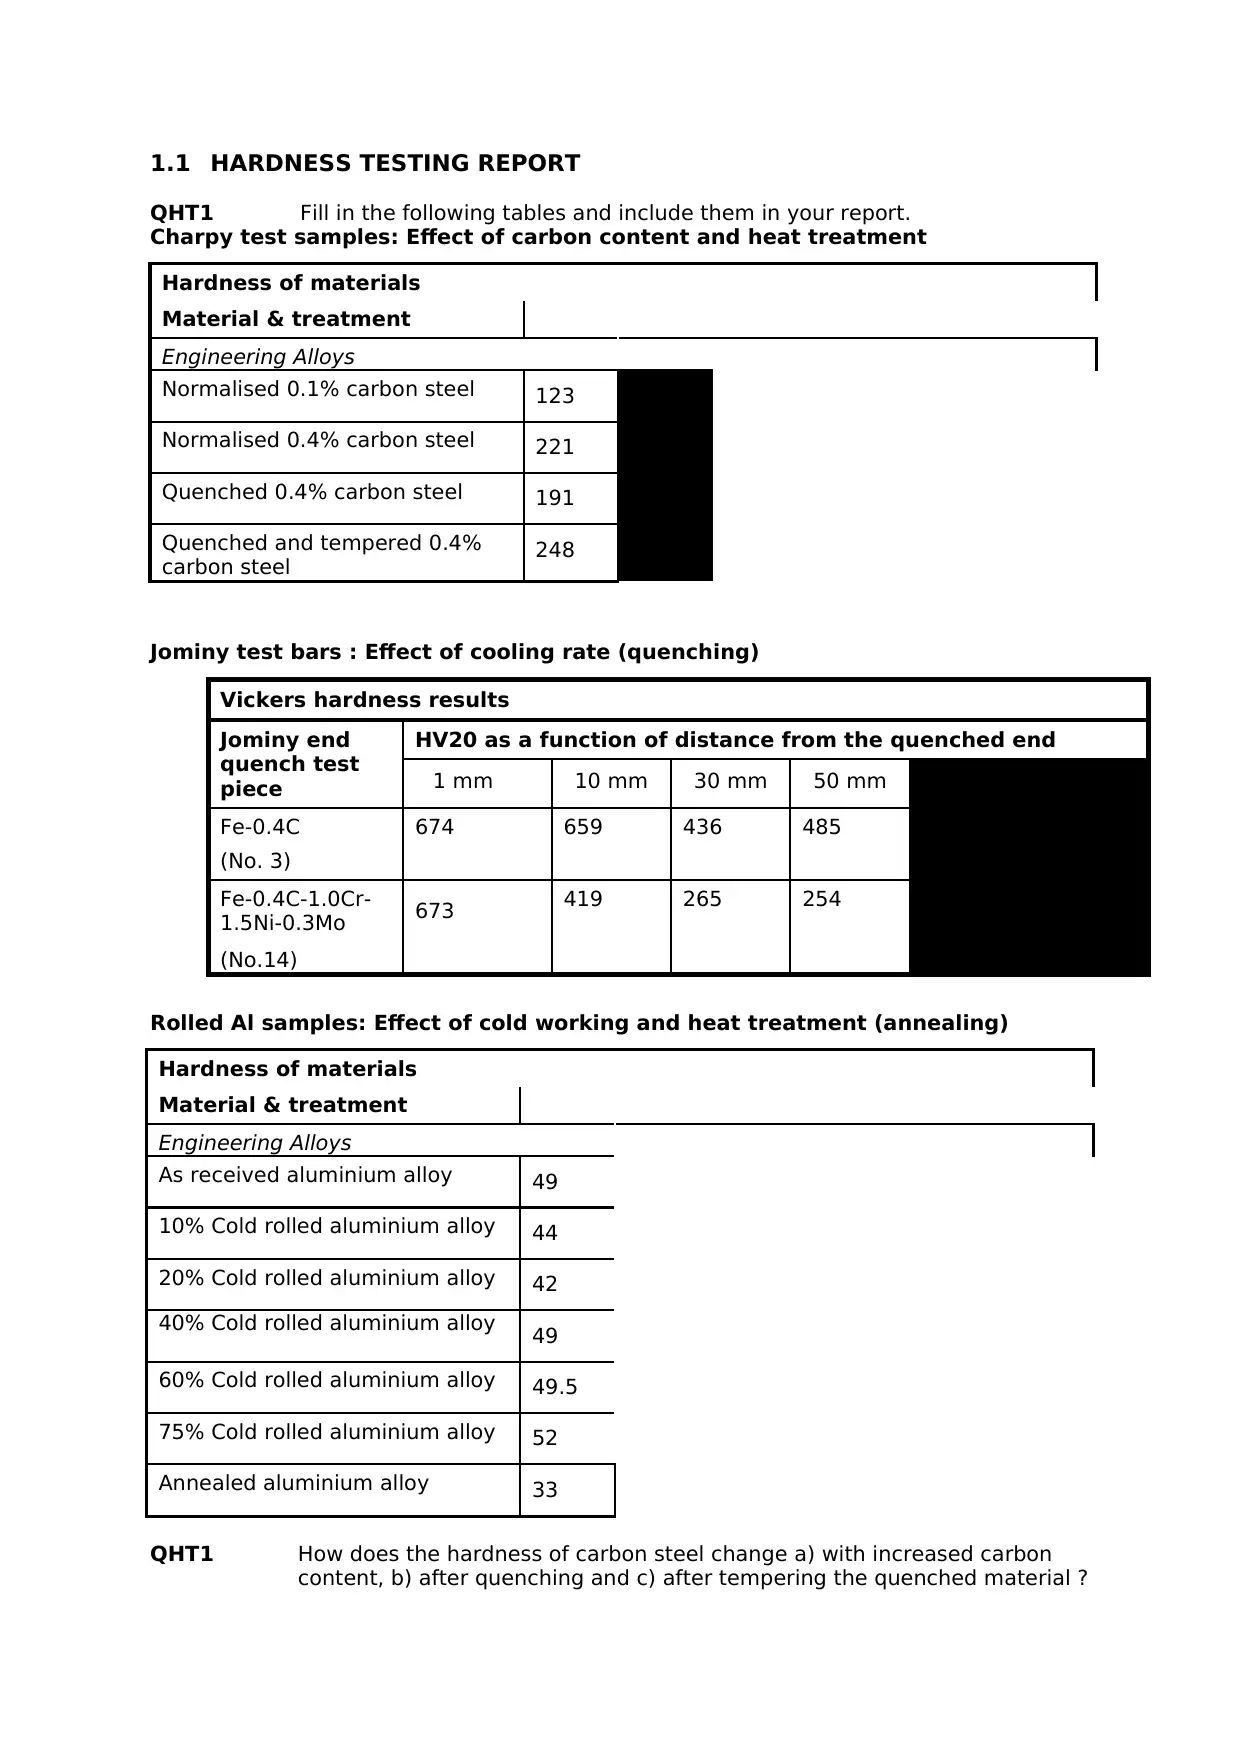
This practical assignment focuses on hardness testing of various materials using the Vickers method. It includes testing of Charpy test samples, Jominy bars, and rolled aluminum sheets, examining the effects of carbon content, heat treatment, cooling rate, cold working, and annealing on material hardness. The assignment requires students to record data, plot graphs, and analyze the results to understand material properties and behavior. The report includes tables of results, plots of hardness versus distance, and analysis of the effects of different treatments on material hardness and flow stress.

HARDNESS TESTING
Hardness is a measure of the ability of a material to resist local plastic deformation under
the action of a concentrated force. It is measured by pressing an indenter into the
surface of the test material, under a constant force for a fixed length of time.
For the Vickers hardness test the indenter takes the form of a pyramidal diamond. The
size of the indentation is a measure of the hardness of the material. For a given indenter
force, the smaller the indentation the harder the test material.
Hardness is normally defined as the indenter force divided by the area of contact
between the indenter and the indented surface of the test material, that is, the surface
area which supports the indenter force. Hardness has units of stress (pressure). For
historical reasons it is normally recorded in units of kgf.mm-2. The flow stress of the
material (σf) can be estimated from the hardness of the material using equation 2.
Whilst this is a rough estimate, hardness testing does provide an essentially non-
destructive, cheap and quick estimate of a material’s flow stress.
You will hardness test the materials you produced in the rolling and heat
treatment labs, namely the Jominy bar, the Charpy test pieces and the rolled Al
sheet.
Your demonstrator will show the operation of the indentation machine. Complete the
sets of tables of results (overleaf) in your groups (of 3 students) by individual use of a
Vickers hardness machine, and the appropriate indenting force. The demonstrators will
be able to help you with the interpretation of your results. You must ensure you have
a complete set of results before leaving the laboratory.
Paraphrase This Document
Need a fresh take? Get an instant paraphrase of this document with our AI Paraphraser

1.1 HARDNESS TESTING REPORT
QHT1 Fill in the following tables and include them in your report.
Charpy test samples: Effect of carbon content and heat treatment
Hardness of materials
Material & treatment
Engineering Alloys
Normalised 0.1% carbon steel 123
Normalised 0.4% carbon steel 221
Quenched 0.4% carbon steel 191
Quenched and tempered 0.4%
carbon steel 248
Jominy test bars : Effect of cooling rate (quenching)
Vickers hardness results
Jominy end
quench test
piece
HV20 as a function of distance from the quenched end
1 mm 10 mm 30 mm 50 mm
Fe-0.4C
(No. 3)
674 659 436 485
Fe-0.4C-1.0Cr-
1.5Ni-0.3Mo
(No.14)
673 419 265 254
Rolled Al samples: Effect of cold working and heat treatment (annealing)
Hardness of materials
Material & treatment
Engineering Alloys
As received aluminium alloy 49
10% Cold rolled aluminium alloy 44
20% Cold rolled aluminium alloy 42
40% Cold rolled aluminium alloy 49
60% Cold rolled aluminium alloy 49.5
75% Cold rolled aluminium alloy 52
Annealed aluminium alloy 33
QHT1 How does the hardness of carbon steel change a) with increased carbon
content, b) after quenching and c) after tempering the quenched material ?

QHT2 Plot the results of the Jominy tests as curves of Vickers hardness number
(in kgf mm-2) versus distance from the quenched end. Comment on the
hardenability of the two types of steel and relate this to their compositions.
QHT3 What is the effect of a) cold working and b) annealing on the hardness of
an Al alloy?
QHT4 Reformulate the data for the average hardnesses against rolling reduction,
in terms of the true flow stress (f) and the true rolling strain (see
Equations 2 and 8). Plot the flow stress against the true rolling strain (on
logarithmic axes) and thus determine the work hardening exponent, n,
making use of equation 1.
⊘ This is a preview!⊘
Do you want full access?
Subscribe today to unlock all pages.

Trusted by 1+ million students worldwide
1 out of 3

Your All-in-One AI-Powered Toolkit for Academic Success.
+13062052269
info@desklib.com
Available 24*7 on WhatsApp / Email
Unlock your academic potential
Copyright © 2020–2025 A2Z Services. All Rights Reserved. Developed and managed by ZUCOL.