Business Analytics and Statistics Research Report of Harvest Kitchen
VerifiedAdded on 2020/03/16
|15
|2836
|130
Report
AI Summary
This report provides a comprehensive business analytics and statistical analysis of Harvest Kitchen, a startup organic product delivery firm. The analysis utilizes descriptive statistics, including histograms and box plots, to examine net profit, total sales, and cost of goods. ANOVA tests are employed to investigate the impact of payment methods, product location, and seasonality on sales and gross profits. The findings reveal significant differences in payment methods, with cash being the most prevalent, and product location influencing sales performance, with the left side of the shop generating the highest sales. The report also explores the relationship between rainfall and profits, demonstrating a strong positive correlation. Based on these insights, the report offers actionable recommendations for Harvest Kitchen to improve its financial performance, including optimizing product placement, leveraging seasonal trends, and focusing on high-profit months. The analysis concludes that implementing these strategies can enhance the business's financial health and ensure its long-term success.

Business Analytics and Statistics Research Report of Harvest Kitchen
By
Name
Student’s Number
Instructor’s Name
By
Name
Student’s Number
Instructor’s Name
Paraphrase This Document
Need a fresh take? Get an instant paraphrase of this document with our AI Paraphraser
2
Table of Contents
Introduction....................................................................................................................................................3
Problem Definition.........................................................................................................................................3
Descriptive Statistics......................................................................................................................................3
Statistical Analysis and Results.....................................................................................................................5
Conclusions and Recommendations..............................................................................................................9
References......................................................................................................................................................9
List of figures...............................................................................................................................................10
3
Introduction
Good harvest is a firm based in Sunshine Coast which offers delivery services for their organic
products. The company is still in a startup phase being that this is its second year in business.
This means that they have to sell their goods at higher prices compared to the other business who
have been in the game for longer. The other challenges faced by the business is low average sales
and low revenue and low workforce. These, according to the Huffington post, are challenges
faced by every other start up business out there (Nwobu 2016). This analysis seeks to determine
the performance of the company and its products, and provide recommendations that could give
the business a way forward.
Problem Definition
The challenges faced by the business represents a significant financial burden to the company.
Being a new business, this could not only lead to extreme financial challenges, but to the closure
of the business as a whole. The cost of goods must remain high so as to generate some profit, but
not so high that it scares off the customers. Finding the perfect balance between generating
profits and retaining customers is one of the toughest challenges faced by new businesses
(Nwobu 2016). According to Ganesan (2016), bringing the sales department to order could be
the biggest breakthrough of a startup, since this will help generate a steady revenue, which can
be used to run and manage the other aspects and departments of the business. To solve the
current shortcomings in the business and ensure its success in this startup unfriendly
environment, effective strategies must be put in place.
Descriptive Statistics
Two datasets are used in the analysis, the first dataset contains data for the food shop for product
mix while the other dataset contains data for the food shop sales summary. The former comprises
⊘ This is a preview!⊘
Do you want full access?
Subscribe today to unlock all pages.
Trusted by 1+ million students worldwide
4
of ten variables with 1034 observations each, while the latter is made up of eighteen variables,
each with 366 observations. These variables are both quantitative and categorical.
I changed the Product Class category from Ordinal to Nominal and Product Category from
Ordinal to Nominal. This is because both Product Class and Product Category are categorical
variables not based on merit or order (Bagdonavicius & Nikulin, 2011).
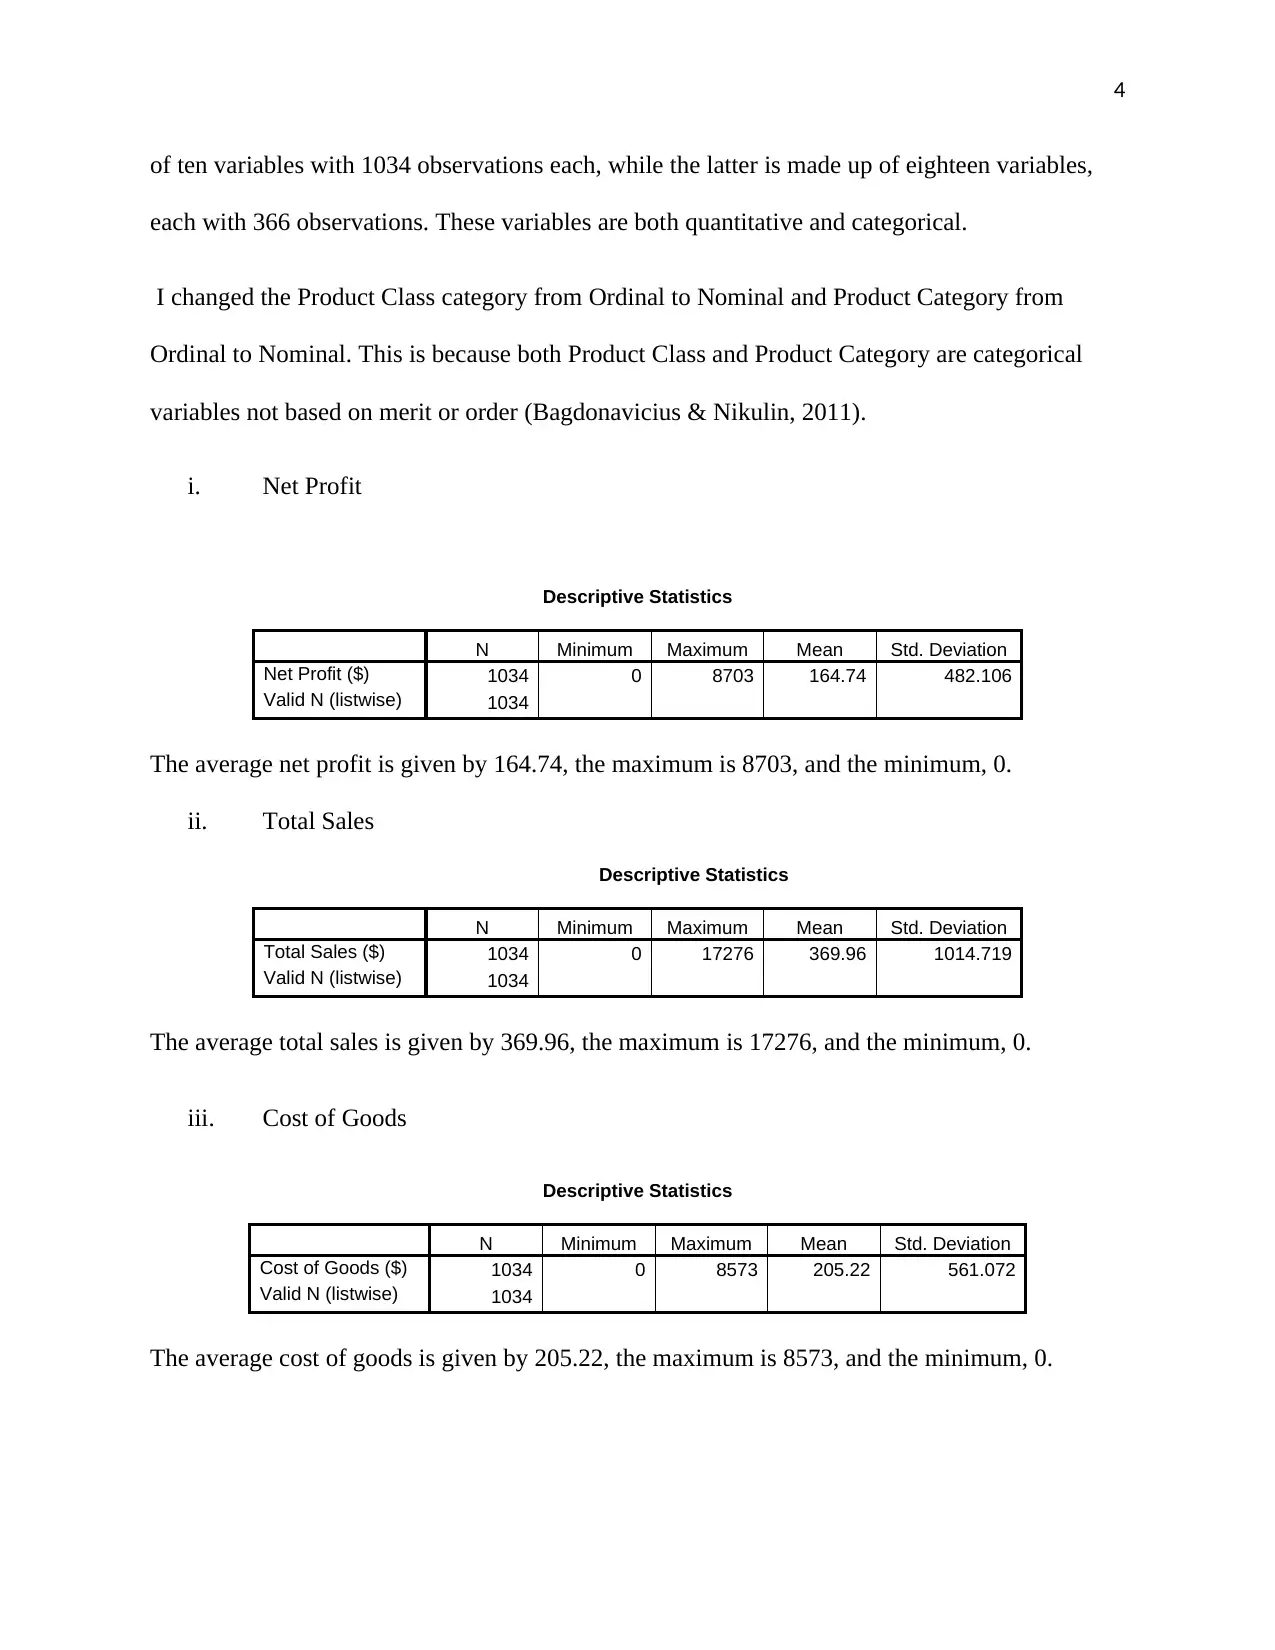
i. Net Profit
Descriptive Statistics
N Minimum Maximum Mean Std. Deviation
Net Profit ($) 1034 0 8703 164.74 482.106
Valid N (listwise) 1034
The average net profit is given by 164.74, the maximum is 8703, and the minimum, 0.
ii. Total Sales
Descriptive Statistics
N Minimum Maximum Mean Std. Deviation
Total Sales ($) 1034 0 17276 369.96 1014.719
Valid N (listwise) 1034
The average total sales is given by 369.96, the maximum is 17276, and the minimum, 0.
iii. Cost of Goods
Descriptive Statistics
N Minimum Maximum Mean Std. Deviation
Cost of Goods ($) 1034 0 8573 205.22 561.072
Valid N (listwise) 1034
The average cost of goods is given by 205.22, the maximum is 8573, and the minimum, 0.
of ten variables with 1034 observations each, while the latter is made up of eighteen variables,
each with 366 observations. These variables are both quantitative and categorical.
I changed the Product Class category from Ordinal to Nominal and Product Category from
Ordinal to Nominal. This is because both Product Class and Product Category are categorical
variables not based on merit or order (Bagdonavicius & Nikulin, 2011).
i. Net Profit
Descriptive Statistics
N Minimum Maximum Mean Std. Deviation
Net Profit ($) 1034 0 8703 164.74 482.106
Valid N (listwise) 1034
The average net profit is given by 164.74, the maximum is 8703, and the minimum, 0.
ii. Total Sales
Descriptive Statistics
N Minimum Maximum Mean Std. Deviation
Total Sales ($) 1034 0 17276 369.96 1014.719
Valid N (listwise) 1034
The average total sales is given by 369.96, the maximum is 17276, and the minimum, 0.
iii. Cost of Goods
Descriptive Statistics
N Minimum Maximum Mean Std. Deviation
Cost of Goods ($) 1034 0 8573 205.22 561.072
Valid N (listwise) 1034
The average cost of goods is given by 205.22, the maximum is 8573, and the minimum, 0.
Paraphrase This Document
Need a fresh take? Get an instant paraphrase of this document with our AI Paraphraser
5
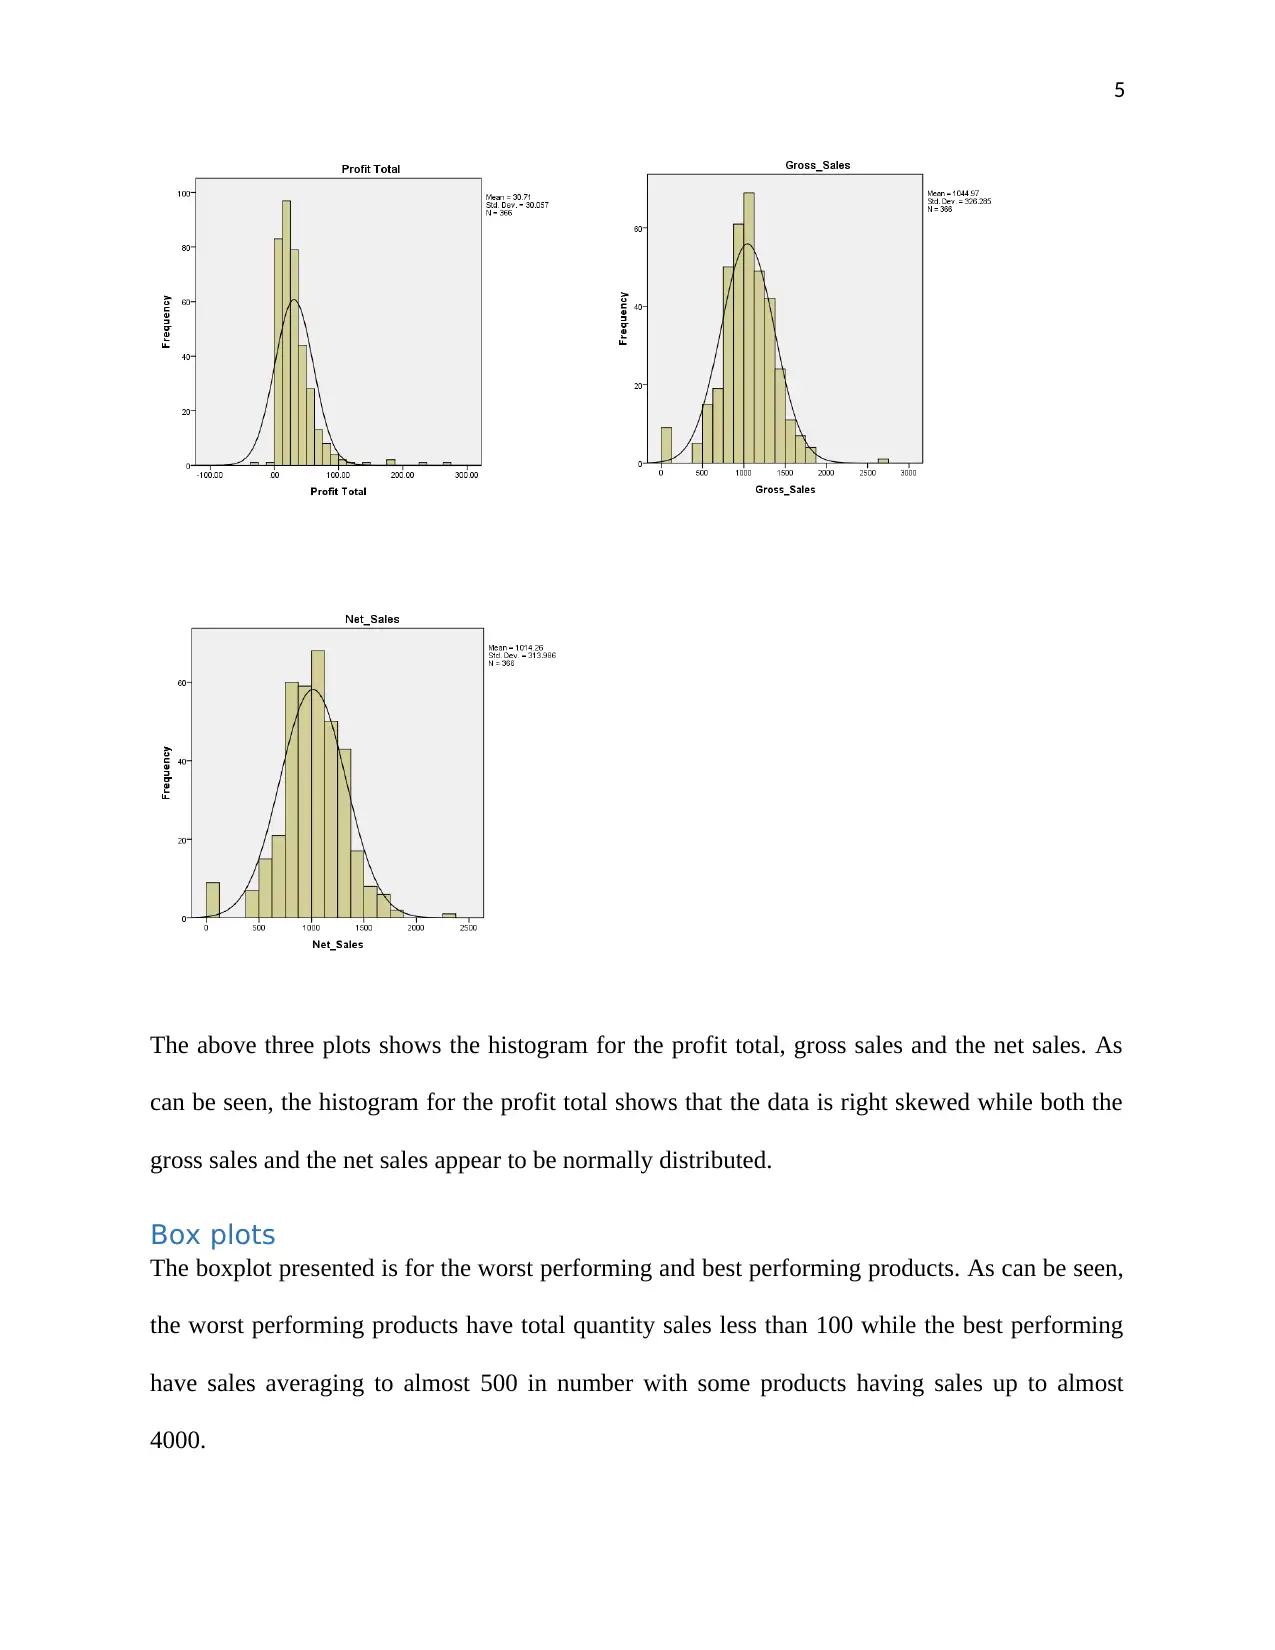
The above three plots shows the histogram for the profit total, gross sales and the net sales. As
can be seen, the histogram for the profit total shows that the data is right skewed while both the
gross sales and the net sales appear to be normally distributed.
Box plots
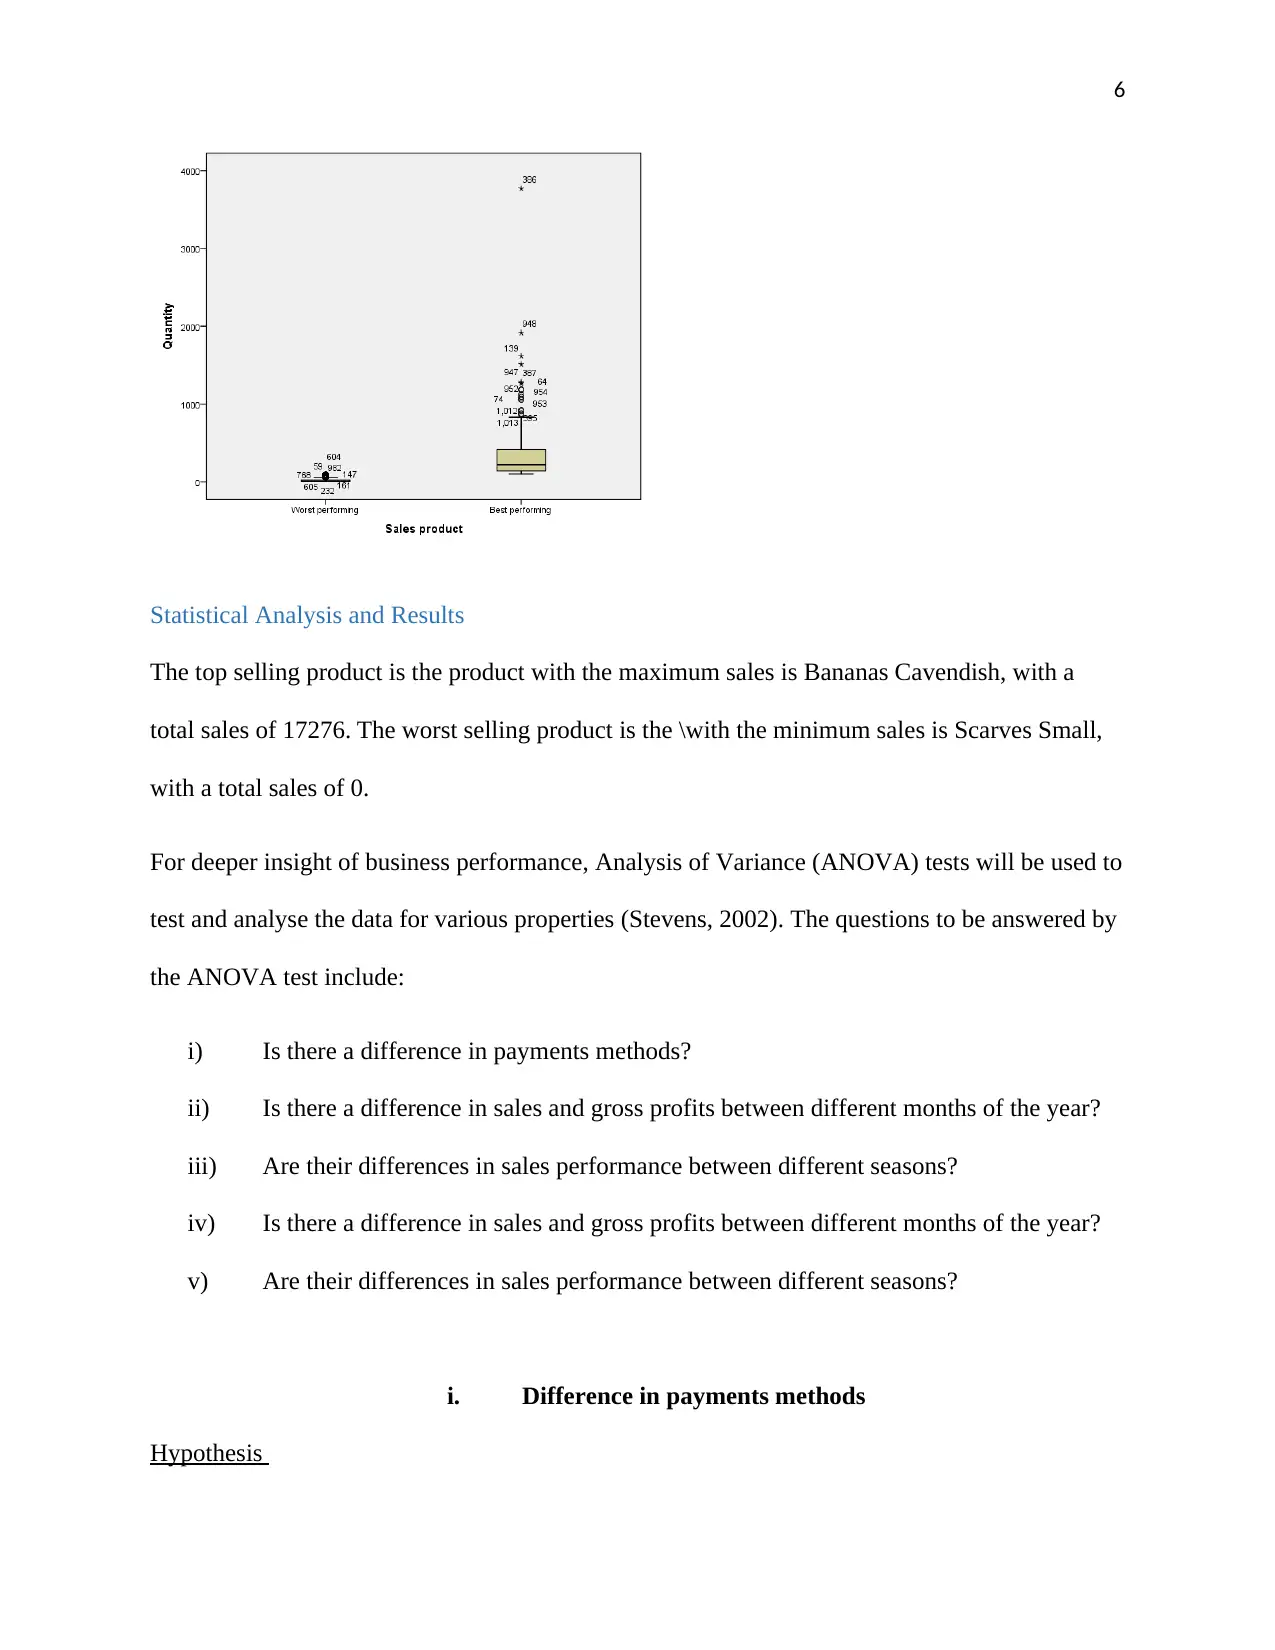
The boxplot presented is for the worst performing and best performing products. As can be seen,
the worst performing products have total quantity sales less than 100 while the best performing
have sales averaging to almost 500 in number with some products having sales up to almost
4000.
The above three plots shows the histogram for the profit total, gross sales and the net sales. As
can be seen, the histogram for the profit total shows that the data is right skewed while both the
gross sales and the net sales appear to be normally distributed.
Box plots
The boxplot presented is for the worst performing and best performing products. As can be seen,
the worst performing products have total quantity sales less than 100 while the best performing
have sales averaging to almost 500 in number with some products having sales up to almost
4000.
6
Statistical Analysis and Results
The top selling product is the product with the maximum sales is Bananas Cavendish, with a
total sales of 17276. The worst selling product is the \with the minimum sales is Scarves Small,
with a total sales of 0.
For deeper insight of business performance, Analysis of Variance (ANOVA) tests will be used to
test and analyse the data for various properties (Stevens, 2002). The questions to be answered by
the ANOVA test include:
i) Is there a difference in payments methods?
ii) Is there a difference in sales and gross profits between different months of the year?
iii) Are their differences in sales performance between different seasons?
iv) Is there a difference in sales and gross profits between different months of the year?
v) Are their differences in sales performance between different seasons?
i. Difference in payments methods
Hypothesis
⊘ This is a preview!⊘
Do you want full access?
Subscribe today to unlock all pages.
Trusted by 1+ million students worldwide
7
Null hypothesis (H0): There is no difference in payments methods
Alternate hypothesis (HA): There is difference in payments methods
Level of significance = 0.05
Analysis Results
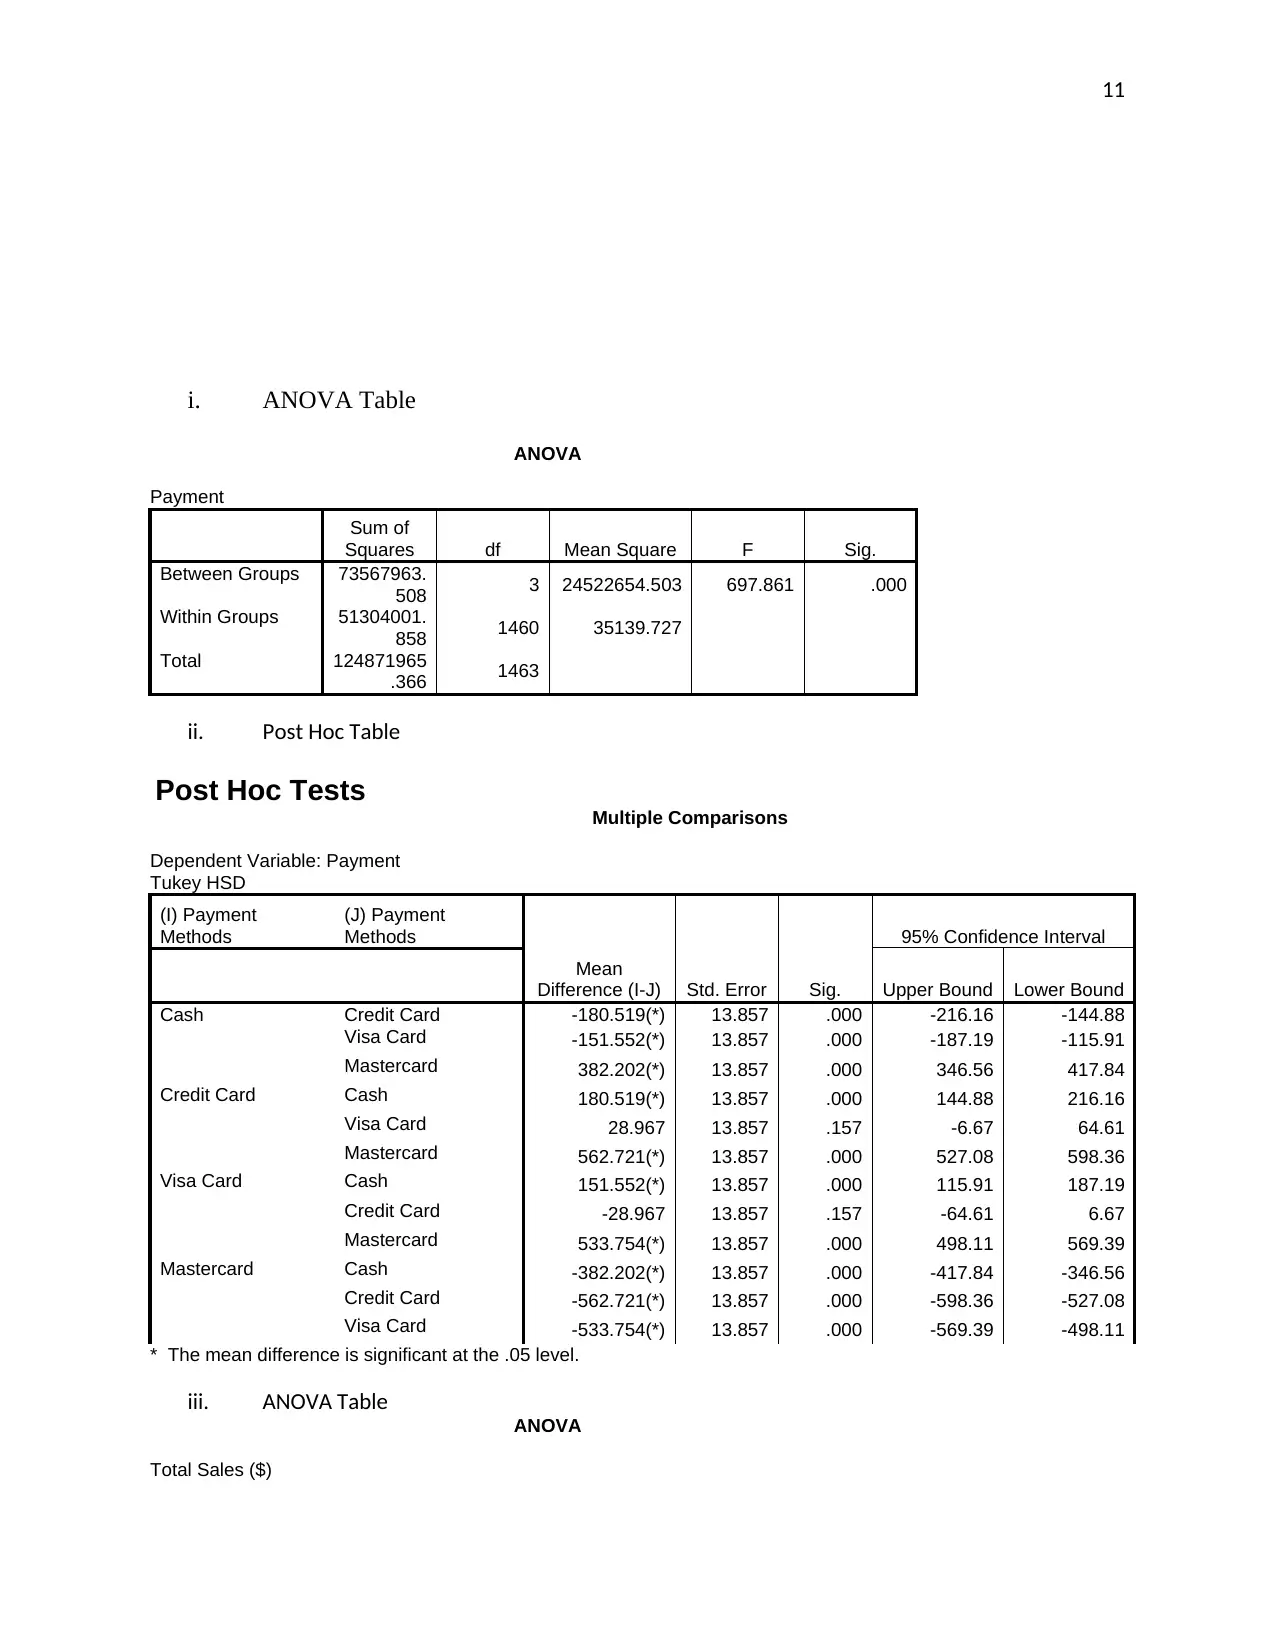
The p-value of the (ANOVA table i) on page 7 is less than the alpha (0.05). This provides
sufficient evidence to reject the null hypothesis; we therefore reject H0. This means that there is
a difference in payment methods.
We then perform a post hoc analysis to determine where the difference exists among the four
payment methods (cash, credit card, visa card and MasterCard).
The results of this analysis as per figure 2 on page 9, show that cash is the most common mode
of payment, credit card and visa card are the second most used, and MasterCard, the least used.
There exists a difference between cash payments and all the other modes of payment. There is no
significant difference in credit card and visa card payment, and finally, there exists a significant
difference between MasterCard and the other payment methods (Montgomery, 2001).
ii. Differences in sales performance based on where the product is located in the
shop
How does this effect both profits and revenue?
Hypothesis
Null hypothesis (H0): There is no difference in sales performance for location in shop
Alternate hypothesis (HA): There is difference in sales performance for location in shop
Null hypothesis (H0): There is no difference in payments methods
Alternate hypothesis (HA): There is difference in payments methods
Level of significance = 0.05
Analysis Results
The p-value of the (ANOVA table i) on page 7 is less than the alpha (0.05). This provides
sufficient evidence to reject the null hypothesis; we therefore reject H0. This means that there is
a difference in payment methods.
We then perform a post hoc analysis to determine where the difference exists among the four
payment methods (cash, credit card, visa card and MasterCard).
The results of this analysis as per figure 2 on page 9, show that cash is the most common mode
of payment, credit card and visa card are the second most used, and MasterCard, the least used.
There exists a difference between cash payments and all the other modes of payment. There is no
significant difference in credit card and visa card payment, and finally, there exists a significant
difference between MasterCard and the other payment methods (Montgomery, 2001).
ii. Differences in sales performance based on where the product is located in the
shop
How does this effect both profits and revenue?
Hypothesis
Null hypothesis (H0): There is no difference in sales performance for location in shop
Alternate hypothesis (HA): There is difference in sales performance for location in shop
Paraphrase This Document
Need a fresh take? Get an instant paraphrase of this document with our AI Paraphraser
8
Level of significance = 0.05
Analysis Results
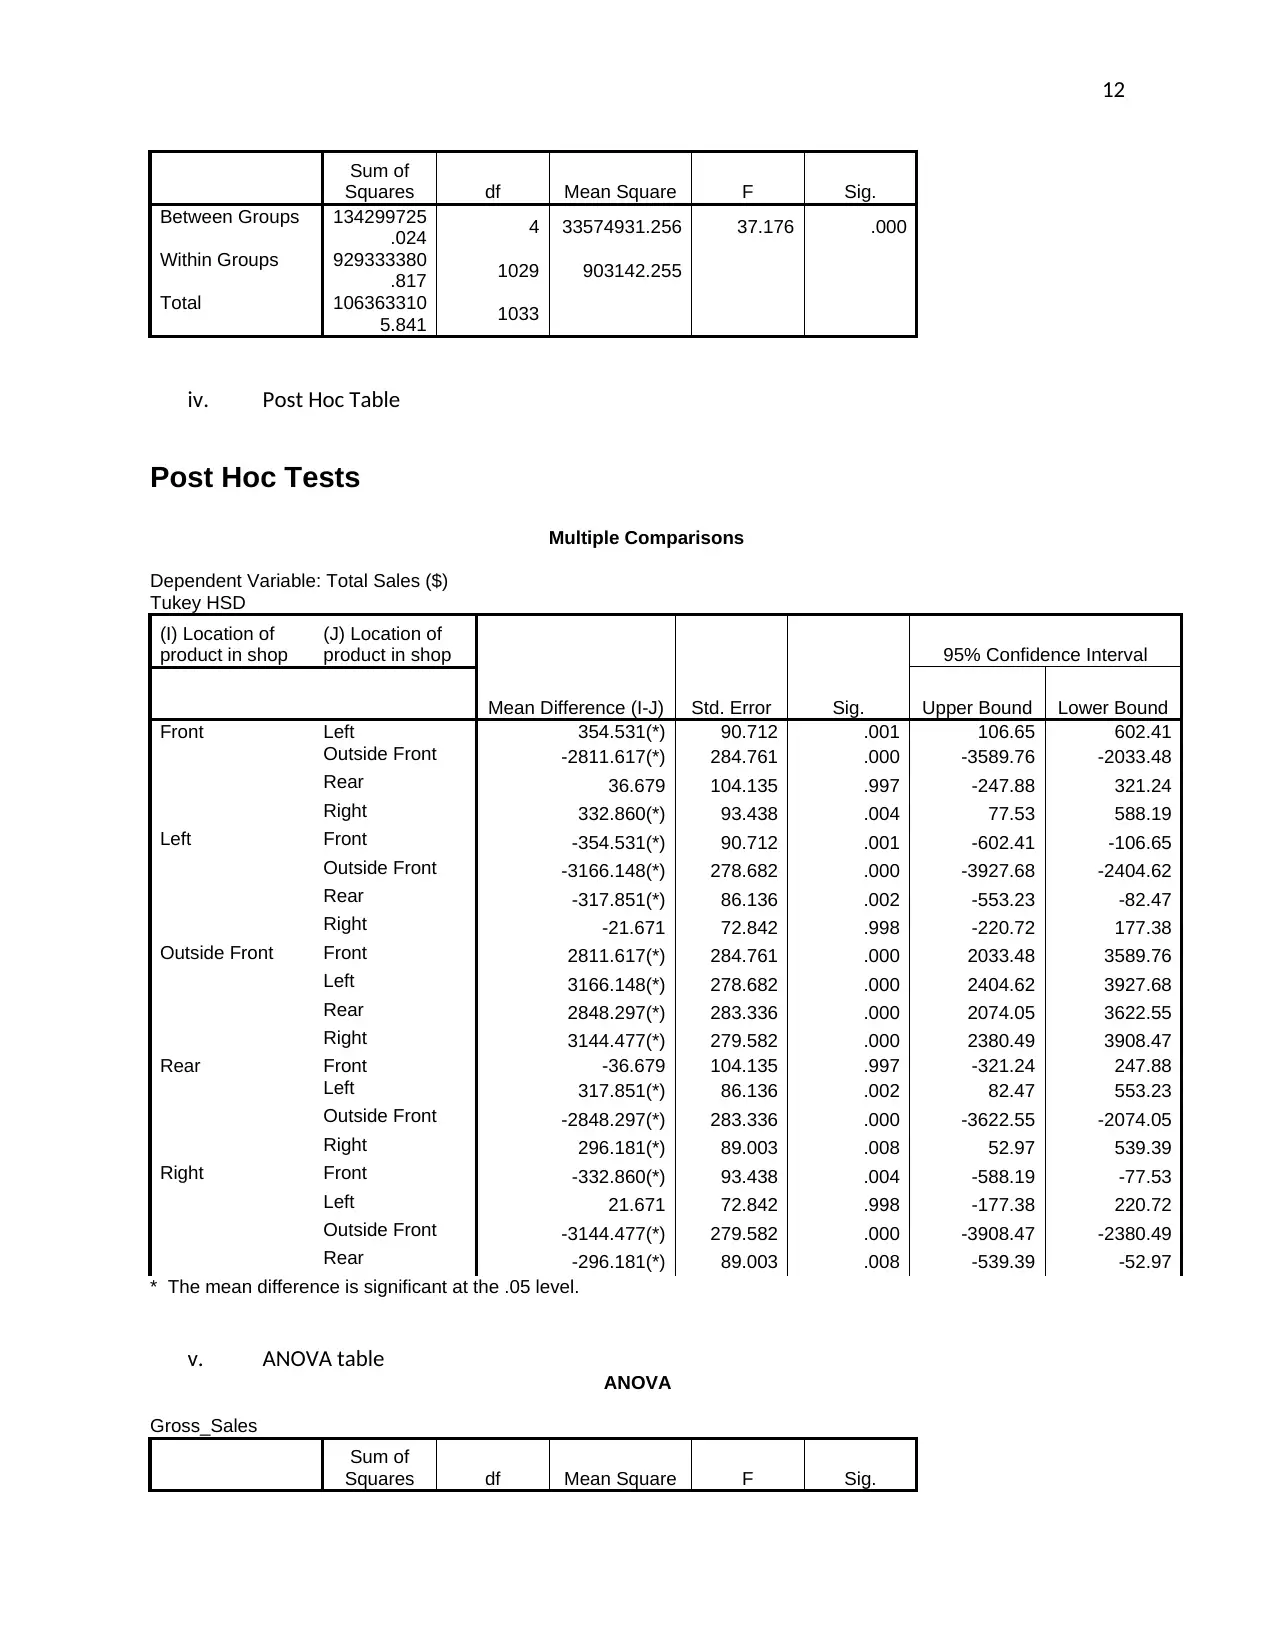
The p-value of the (ANOVA table iii) on page 8 is less than the alpha (0.05). This provides
sufficient evidence to reject the null hypothesis; we therefore reject H0. This means that there is
a difference in sales performance based on the location of the product in the shop (Chiang,
2003).
We then perform a post hoc analysis to determine where the difference exists among the five
locations (front, left, outside front, rear, and right).
The results of this analysis as per figure (iv) on page 10 show that goods in the left location of
the shop made the highest sales, followed by products in the right. Those on outside front
received the lowest sales.
iii. Difference in sales and gross profits between different months of the year
a) Hypothesis
Null hypothesis (H0): There is no difference in sales between different months of the year
Alternate hypothesis (HA): There is difference in sales between different months of the year
Level of significance = 0.05
Analysis Results
The p-value (0.22) of the ANOVA table (v) on page 12 is greater than the alpha (0.05). This
provides sufficient evidence to accept the null hypothesis; we therefore fail to reject H0. This
means that there is no difference in sales between different months of the year (Gelman, Analysis
of variance? why it is more important than ever, 2005).
Level of significance = 0.05
Analysis Results
The p-value of the (ANOVA table iii) on page 8 is less than the alpha (0.05). This provides
sufficient evidence to reject the null hypothesis; we therefore reject H0. This means that there is
a difference in sales performance based on the location of the product in the shop (Chiang,
2003).
We then perform a post hoc analysis to determine where the difference exists among the five
locations (front, left, outside front, rear, and right).
The results of this analysis as per figure (iv) on page 10 show that goods in the left location of
the shop made the highest sales, followed by products in the right. Those on outside front
received the lowest sales.
iii. Difference in sales and gross profits between different months of the year
a) Hypothesis
Null hypothesis (H0): There is no difference in sales between different months of the year
Alternate hypothesis (HA): There is difference in sales between different months of the year
Level of significance = 0.05
Analysis Results
The p-value (0.22) of the ANOVA table (v) on page 12 is greater than the alpha (0.05). This
provides sufficient evidence to accept the null hypothesis; we therefore fail to reject H0. This
means that there is no difference in sales between different months of the year (Gelman, Analysis
of variance? why it is more important than ever, 2005).
9
b) Hypothesis
Null hypothesis (H0): There is no difference in gross profit between different months of the year
Alternate hypothesis (HA): There is difference in gross profit between different months of the
year
Level of significance = 0.05
Analysis Results
The p-value of the ANOVA table (vi) on page 12 is less than the alpha (0.05). This provides
sufficient evidence to reject the null hypothesis; we therefore reject H0. This means that there is
a difference in gross profit between different months of the year.
The results of this analysis show that November recorded the highest profits while June recorded
the lowest profits.
iv. Differences in sales performance between different seasons
Hypothesis
Null hypothesis (H0): There is no difference in sales performance between different seasons
Alternate hypothesis (HA): There is difference in sales performance between different seasons
Level of significance = 0.05
Analysis Results
The p-value (0.814) in the ANOVA table (vii) on page 12 is less than the alpha (0.05). This
doesn’t provide sufficient evidence to reject the null hypothesis; we therefore fail to reject H0.
This means that there is no difference in sales performance between different seasons.
⊘ This is a preview!⊘
Do you want full access?
Subscribe today to unlock all pages.
Trusted by 1+ million students worldwide
10
v. Relationship between rainfall and profits
A correlation analysis is performed to determine the linear relationship between rainfall and
profits (Gelman & Hill, Data Analysis Using Regression and Multilevel/Hierarchical Models,
2006). The results of the analysis according to figure (ix) on page 11 shows a correlation
coefficient of 0.885. This implies a strong positive linear relationship between the two variables.
Meaning that an increase in one rainfall results in an increase in profits.
Conclusions and Recommendations
From examining the financial status of the organic firm business, we notice that the business
performs different according to different months and different seasons. There are months when
sales and profit recorded are high, there are seasons (rainfall seasons) when profitability is high,
and there are certain locations that guarantees sale of products more than others. Since the profits
and quantity of sales are mostly based on fruit or vegetable production, the firm can take
advantage of certain seasons when a particular fruit is most likely to give the best products, and
plant the vegetable then. The firm can also try to maximize their sales during the months that
recorded the highest profit like November. Another way the firm can develop financial
advantage is to position their best selling and profitable products on the shop locations which
recorded the highest sales, i.e., left and center of the shop. I believe that implementing these
suggestions will lead to a better financial performance of the business and ensure its future
success.
Paraphrase This Document
Need a fresh take? Get an instant paraphrase of this document with our AI Paraphraser
11
i. ANOVA Table
ANOVA
Payment
Sum of
Squares df Mean Square F Sig.
Between Groups 73567963.
508 3 24522654.503 697.861 .000
Within Groups 51304001.
858 1460 35139.727
Total 124871965
.366 1463
ii. Post Hoc Table
Post Hoc Tests Multiple Comparisons
Dependent Variable: Payment
Tukey HSD
(I) Payment
Methods
(J) Payment
Methods
Mean
Difference (I-J) Std. Error Sig.
95% Confidence Interval
Upper Bound Lower Bound
Cash Credit Card -180.519(*) 13.857 .000 -216.16 -144.88
Visa Card -151.552(*) 13.857 .000 -187.19 -115.91
Mastercard 382.202(*) 13.857 .000 346.56 417.84
Credit Card Cash 180.519(*) 13.857 .000 144.88 216.16
Visa Card 28.967 13.857 .157 -6.67 64.61
Mastercard 562.721(*) 13.857 .000 527.08 598.36
Visa Card Cash 151.552(*) 13.857 .000 115.91 187.19
Credit Card -28.967 13.857 .157 -64.61 6.67
Mastercard 533.754(*) 13.857 .000 498.11 569.39
Mastercard Cash -382.202(*) 13.857 .000 -417.84 -346.56
Credit Card -562.721(*) 13.857 .000 -598.36 -527.08
Visa Card -533.754(*) 13.857 .000 -569.39 -498.11
* The mean difference is significant at the .05 level.
iii. ANOVA Table
ANOVA
Total Sales ($)
12
Sum of
Squares df Mean Square F Sig.
Between Groups 134299725
.024 4 33574931.256 37.176 .000
Within Groups 929333380
.817 1029 903142.255
Total 106363310
5.841 1033
iv. Post Hoc Table
Post Hoc Tests
Multiple Comparisons
Dependent Variable: Total Sales ($)
Tukey HSD
(I) Location of
product in shop
(J) Location of
product in shop
Mean Difference (I-J) Std. Error Sig.
95% Confidence Interval
Upper Bound Lower Bound
Front Left 354.531(*) 90.712 .001 106.65 602.41
Outside Front -2811.617(*) 284.761 .000 -3589.76 -2033.48
Rear 36.679 104.135 .997 -247.88 321.24
Right 332.860(*) 93.438 .004 77.53 588.19
Left Front -354.531(*) 90.712 .001 -602.41 -106.65
Outside Front -3166.148(*) 278.682 .000 -3927.68 -2404.62
Rear -317.851(*) 86.136 .002 -553.23 -82.47
Right -21.671 72.842 .998 -220.72 177.38
Outside Front Front 2811.617(*) 284.761 .000 2033.48 3589.76
Left 3166.148(*) 278.682 .000 2404.62 3927.68
Rear 2848.297(*) 283.336 .000 2074.05 3622.55
Right 3144.477(*) 279.582 .000 2380.49 3908.47
Rear Front -36.679 104.135 .997 -321.24 247.88
Left 317.851(*) 86.136 .002 82.47 553.23
Outside Front -2848.297(*) 283.336 .000 -3622.55 -2074.05
Right 296.181(*) 89.003 .008 52.97 539.39
Right Front -332.860(*) 93.438 .004 -588.19 -77.53
Left 21.671 72.842 .998 -177.38 220.72
Outside Front -3144.477(*) 279.582 .000 -3908.47 -2380.49
Rear -296.181(*) 89.003 .008 -539.39 -52.97
* The mean difference is significant at the .05 level.
v. ANOVA table
ANOVA
Gross_Sales
Sum of
Squares df Mean Square F Sig.
Sum of
Squares df Mean Square F Sig.
Between Groups 134299725
.024 4 33574931.256 37.176 .000
Within Groups 929333380
.817 1029 903142.255
Total 106363310
5.841 1033
iv. Post Hoc Table
Post Hoc Tests
Multiple Comparisons
Dependent Variable: Total Sales ($)
Tukey HSD
(I) Location of
product in shop
(J) Location of
product in shop
Mean Difference (I-J) Std. Error Sig.
95% Confidence Interval
Upper Bound Lower Bound
Front Left 354.531(*) 90.712 .001 106.65 602.41
Outside Front -2811.617(*) 284.761 .000 -3589.76 -2033.48
Rear 36.679 104.135 .997 -247.88 321.24
Right 332.860(*) 93.438 .004 77.53 588.19
Left Front -354.531(*) 90.712 .001 -602.41 -106.65
Outside Front -3166.148(*) 278.682 .000 -3927.68 -2404.62
Rear -317.851(*) 86.136 .002 -553.23 -82.47
Right -21.671 72.842 .998 -220.72 177.38
Outside Front Front 2811.617(*) 284.761 .000 2033.48 3589.76
Left 3166.148(*) 278.682 .000 2404.62 3927.68
Rear 2848.297(*) 283.336 .000 2074.05 3622.55
Right 3144.477(*) 279.582 .000 2380.49 3908.47
Rear Front -36.679 104.135 .997 -321.24 247.88
Left 317.851(*) 86.136 .002 82.47 553.23
Outside Front -2848.297(*) 283.336 .000 -3622.55 -2074.05
Right 296.181(*) 89.003 .008 52.97 539.39
Right Front -332.860(*) 93.438 .004 -588.19 -77.53
Left 21.671 72.842 .998 -177.38 220.72
Outside Front -3144.477(*) 279.582 .000 -3908.47 -2380.49
Rear -296.181(*) 89.003 .008 -539.39 -52.97
* The mean difference is significant at the .05 level.
v. ANOVA table
ANOVA
Gross_Sales
Sum of
Squares df Mean Square F Sig.
⊘ This is a preview!⊘
Do you want full access?
Subscribe today to unlock all pages.
Trusted by 1+ million students worldwide
1 out of 15
Related Documents


Your All-in-One AI-Powered Toolkit for Academic Success.
+13062052269
info@desklib.com
Available 24*7 on WhatsApp / Email
![[object Object]](/_next/static/media/star-bottom.7253800d.svg)
Unlock your academic potential
Copyright © 2020–2026 A2Z Services. All Rights Reserved. Developed and managed by ZUCOL.