Harvest Kitchen: Business Operations Research and Report

Verified

Added on  2020/03/16

|19
|3039
|375
Report
AI Summary
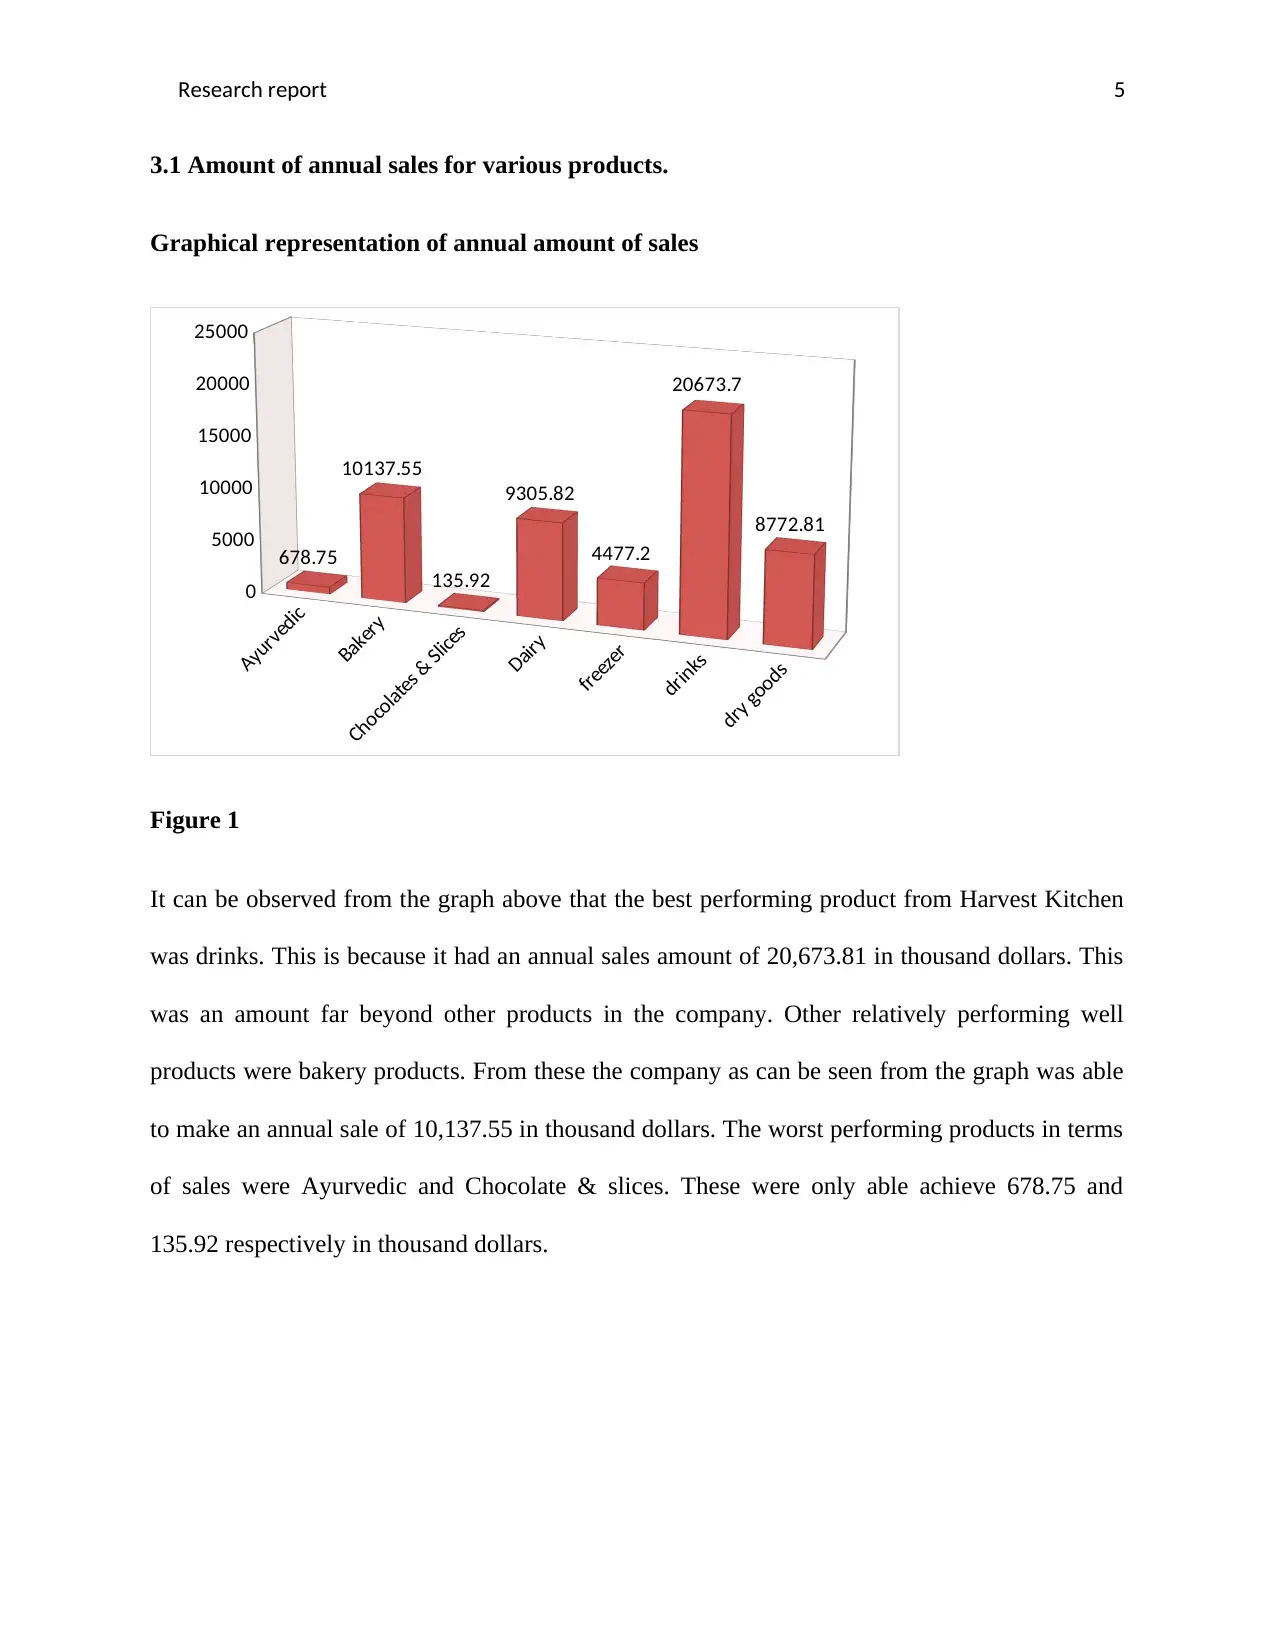
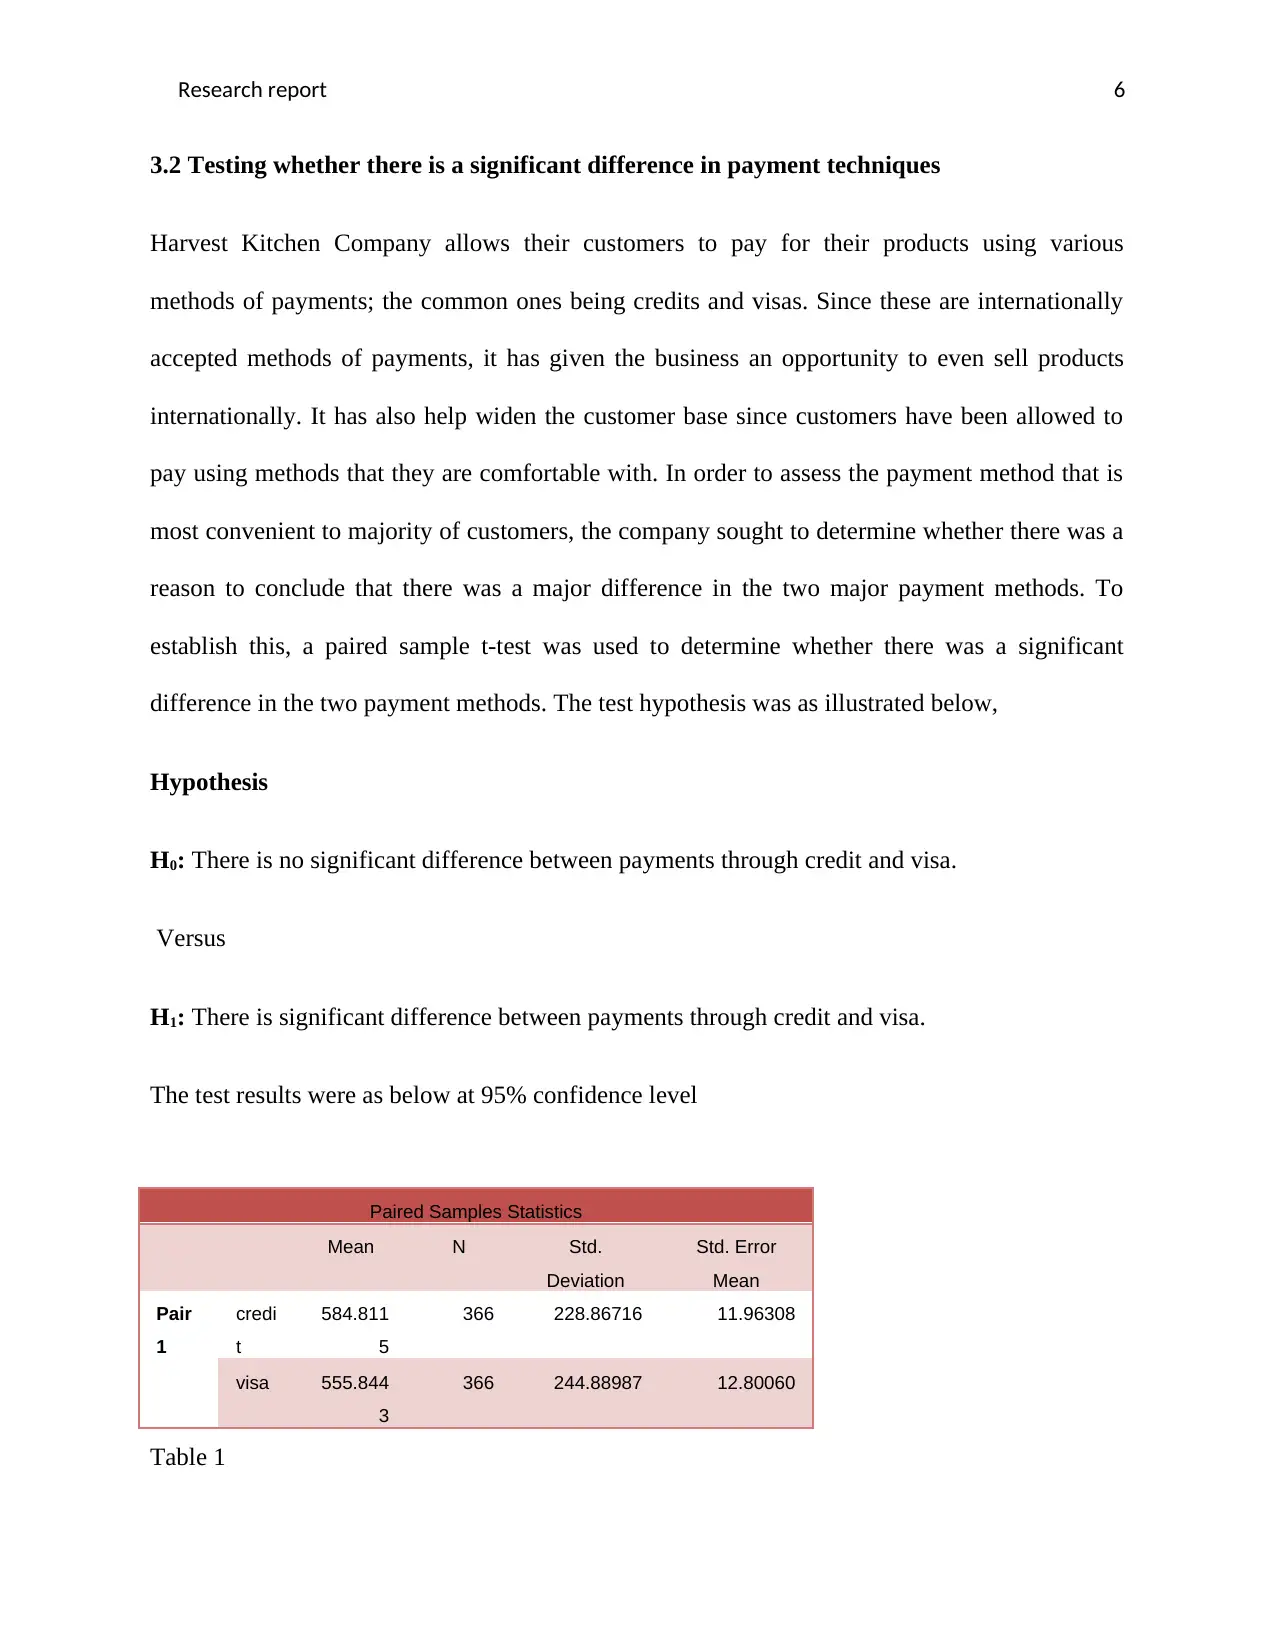
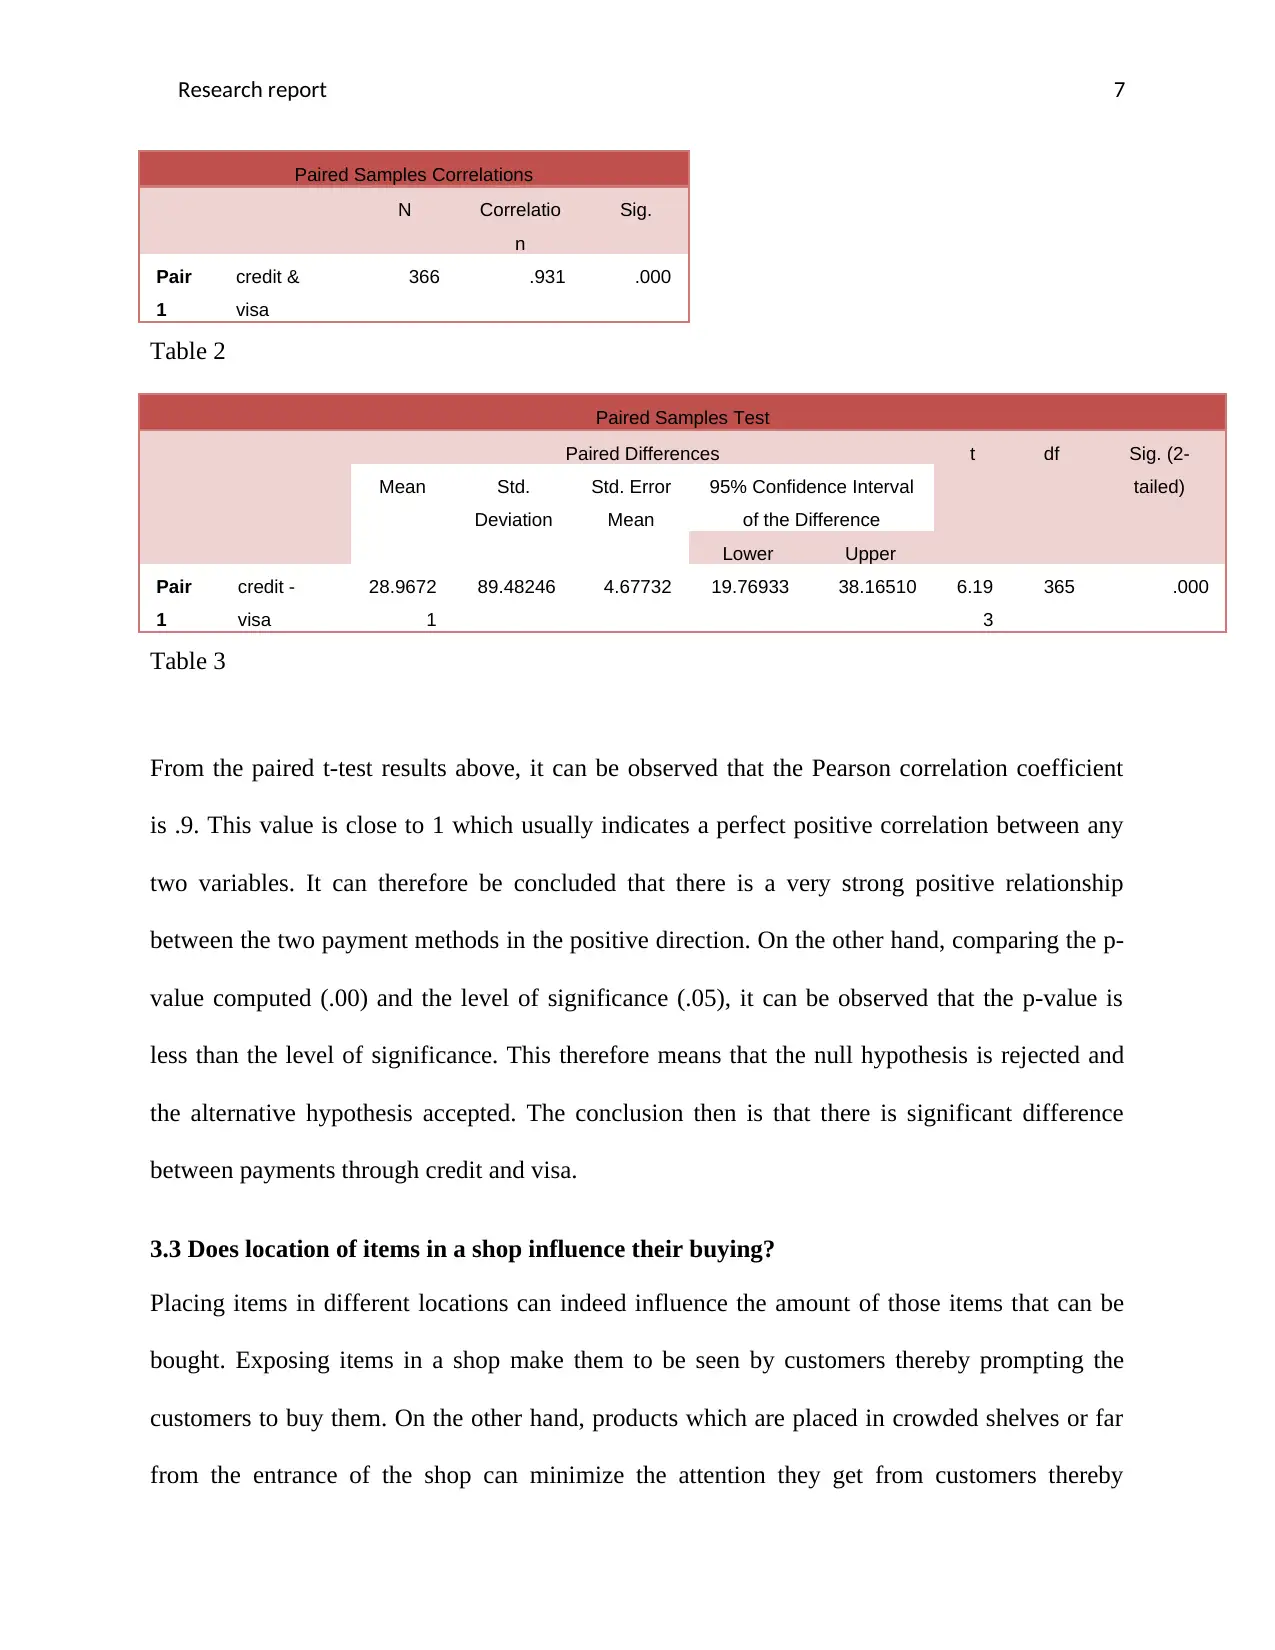
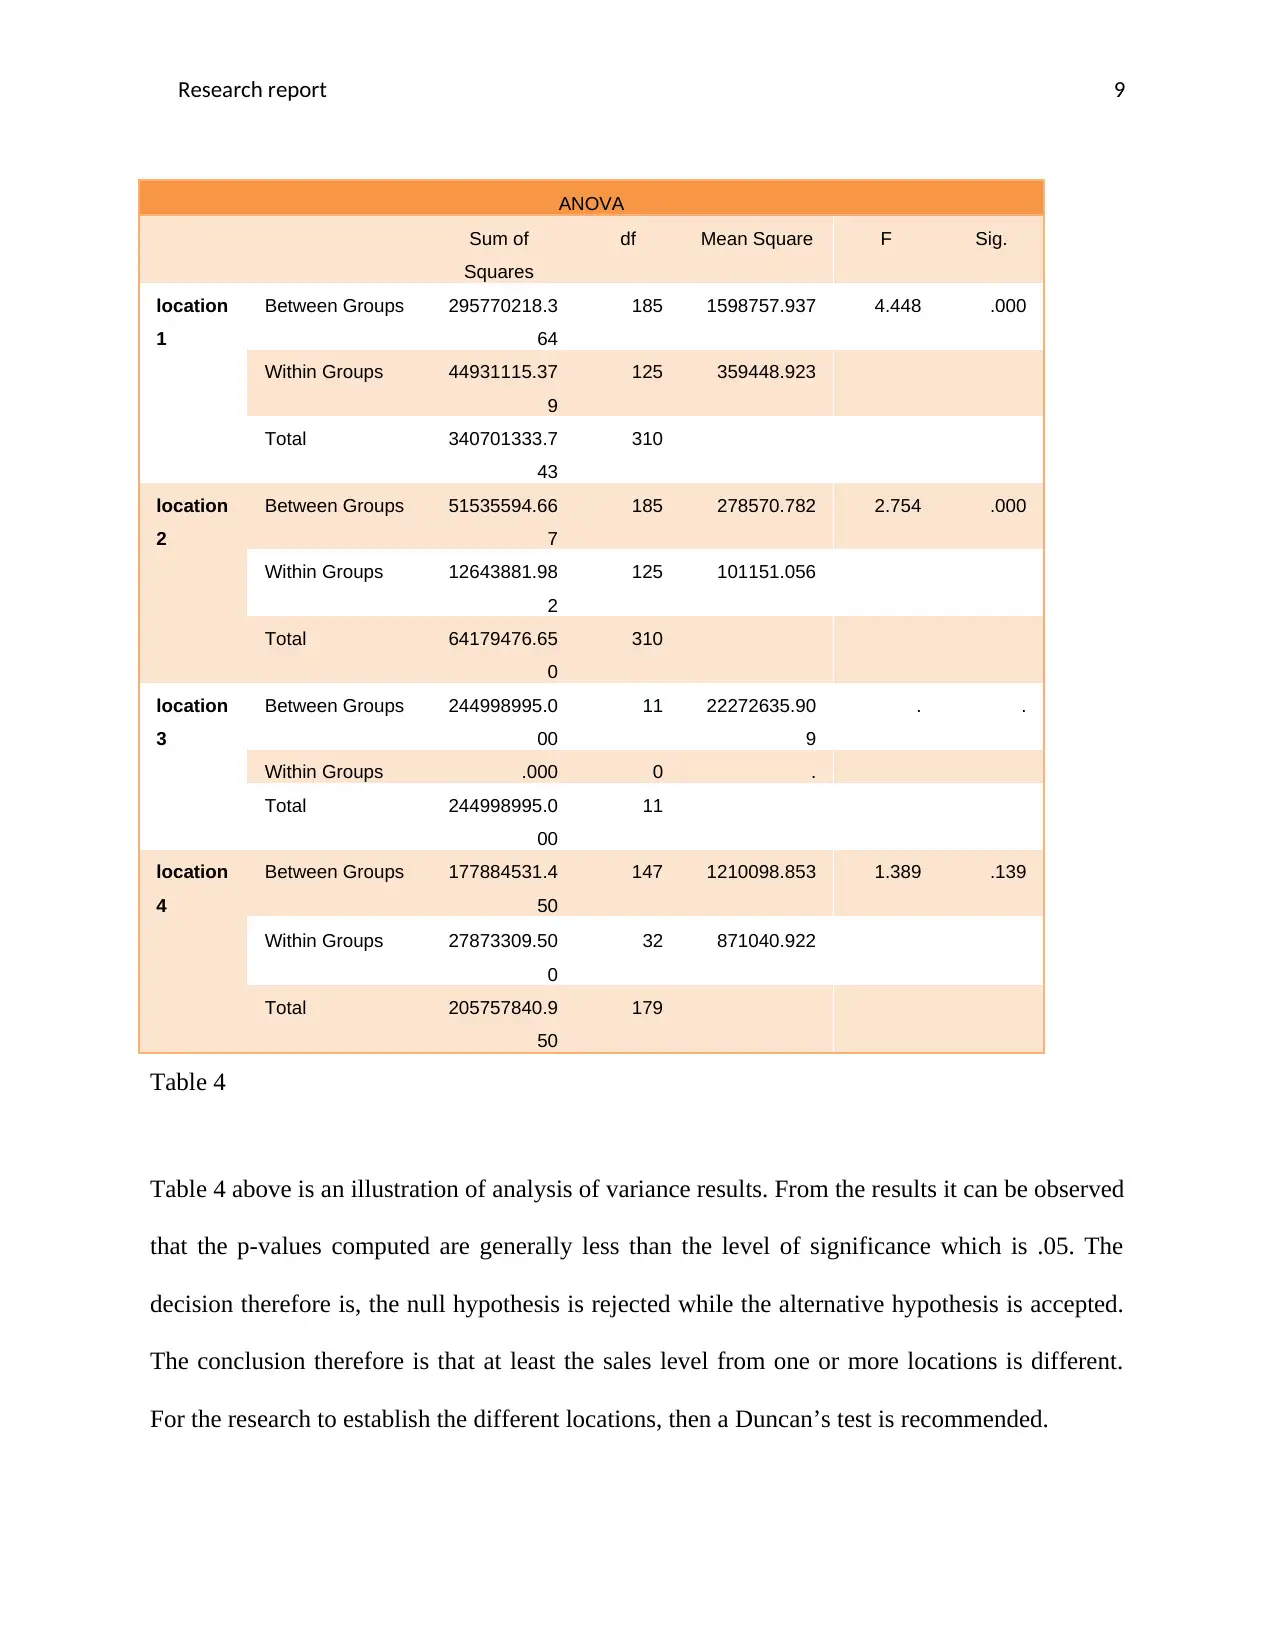
This research report examines the market performance of Harvest Kitchen, a company dealing with fruits and vegetables, focusing on sales, profit margins, and business operations. The report addresses key research questions, including the top and worst-performing products, differences in payment methods (credit vs. visa), the influence of product location on sales, and the correlation between sales, gross profit, and rainfall. Using statistical analyses like paired sample t-tests and ANOVA, the study identifies significant differences in payment methods, sales levels across different locations, and sales and gross profit variations among the months. The findings reveal that drinks are the best-performing product, while Ayurvedic and Chocolate & slices are the worst. The report concludes with a discussion of the findings and recommendations for Harvest Kitchen to improve its revenue and profit margins.
Document Page
Research report 1
Student Name:
Student number:
Lecturer:
Harvest Kitchen Market report
tabler-icon-diamond-filled.svg

Paraphrase This Document

Need a fresh take? Get an instant paraphrase of this document with our AI Paraphraser
Document Page
Research report 2
Table of contents
Content Page
1.0 Introduction ……………………………………………………….3
2.0 Problem statement…………………………………………………….3
3.0 Research questions……………………………………………………4
3.1 Top and worst performers…………………………………………….4
3.2 Difference in payment methods ……………………… …………….5
3.3 Difference in sales performance …………………………………….6
3.4 Difference in sales and gross profit………………………………….8
3.5 Test for correlation-sales and rain …………………………….…...13
3.6 Test for correlation-sales and gross profit ………………………….13
3.7 Product category…………………………………………………….14
4.0 Discussion and recommendation …………………………………...15
5.0 Reference……………………… …………………………………...16
Document Page
Research report 3
1.0 Introduction
Due to global inflation that affected the world in 2008, many business enterprises have been
finding it difficult to cope in the market (March, 2009) and (Romano, 2009). The economic
turmoil dealt many industries a heavy blow. And until recently it has been difficult for various
businesses to get up to their knees. Worse is for the new entrants in various industries. The new
entrepreneurs have had to face the stiff competition waged by very established businesses in
those particular industries (Mowlana & Smith, 2003) and (March, 2009). So for the new
businesses to thrive in the global market they have to strategize to counter their competitor’s
strong selling points. These strategies might include very elaborate sales and marketing
approaches so as to increase their sales and hence widen their profit margins.
2.0 Problem statement
Strong profit margin is very fundamental aspect of any business organization which needs to
remain competitive in the market. This is because is a wider profit margin that will support
various operations of the business from paying of salaries, business inputs, advertisement costs,
logistics costs to production costs. This means that if any business does not pay attention to how
it can solidify its sources of profits, then the business might be in a state of jeopardy. Harvest
Kitchen is a young company that has been dealing with fruits and vegetables. The problems
facing other new companies have also been playing out in Harvest Kitchen Company. They have
being faced by low gross profits which is being attributed to low sales annually. The low amount
sale on the other hand is believed to be due to lack of conversion of leads to actual business
opportunities. Lastly, the cost of goods has also been a factor contributing to low sales. It for this
reason the management of the organization has decided to carry out a research report on their
Document Page
Research report 4
business operations in order to identify areas that are directly affecting their revenues so that they
can improve on them.
3.0 Research questions
Some of the questions that the management of Harvest Kitchen sought to get answers for were
the following;
 Which products are performing well and which are performing poorly when it comes to
sales?
 Are there differences in payment methods?
 Does location of a product in a shop influence its sales? Does this affect profits and
revenues? In which way?
 Is there a difference in sales and gross profits between different months of the year?
 Are their differences in sales performance between different seasons?
 How does this relate to rainfall and profits?
tabler-icon-diamond-filled.svg

Paraphrase This Document

Need a fresh take? Get an instant paraphrase of this document with our AI Paraphraser
Document Page
Research report 5
3.1 Amount of annual sales for various products.
Graphical representation of annual amount of sales
Ayurvedic
Bakery
Chocolates & Slices
Dairy
freezer
drinks
dry goods
0
5000
10000
15000
20000
25000
678.75
10137.55
135.92
9305.82
4477.2
20673.7
8772.81
Figure 1
It can be observed from the graph above that the best performing product from Harvest Kitchen
was drinks. This is because it had an annual sales amount of 20,673.81 in thousand dollars. This
was an amount far beyond other products in the company. Other relatively performing well
products were bakery products. From these the company as can be seen from the graph was able
to make an annual sale of 10,137.55 in thousand dollars. The worst performing products in terms
of sales were Ayurvedic and Chocolate & slices. These were only able achieve 678.75 and
135.92 respectively in thousand dollars.
Document Page
Research report 6
3.2 Testing whether there is a significant difference in payment techniques
Harvest Kitchen Company allows their customers to pay for their products using various
methods of payments; the common ones being credits and visas. Since these are internationally
accepted methods of payments, it has given the business an opportunity to even sell products
internationally. It has also help widen the customer base since customers have been allowed to
pay using methods that they are comfortable with. In order to assess the payment method that is
most convenient to majority of customers, the company sought to determine whether there was a
reason to conclude that there was a major difference in the two major payment methods. To
establish this, a paired sample t-test was used to determine whether there was a significant
difference in the two payment methods. The test hypothesis was as illustrated below,
Hypothesis
H0: There is no significant difference between payments through credit and visa.
Versus
H1: There is significant difference between payments through credit and visa.
The test results were as below at 95% confidence level
Paired Samples Statistics
Mean N Std.
Deviation
Std. Error
Mean
Pair
1
credi
t
584.811
5
366 228.86716 11.96308
visa 555.844
3
366 244.88987 12.80060
Table 1
Document Page
Research report 7
Paired Samples Correlations
N Correlatio
n
Sig.
Pair
1
credit &
visa
366 .931 .000
Table 2
Paired Samples Test
Paired Differences t df Sig. (2-
tailed)Mean Std.
Deviation
Std. Error
Mean
95% Confidence Interval
of the Difference
Lower Upper
Pair
1
credit -
visa
28.9672
1
89.48246 4.67732 19.76933 38.16510 6.19
3
365 .000
Table 3
From the paired t-test results above, it can be observed that the Pearson correlation coefficient
is .9. This value is close to 1 which usually indicates a perfect positive correlation between any
two variables. It can therefore be concluded that there is a very strong positive relationship
between the two payment methods in the positive direction. On the other hand, comparing the p-
value computed (.00) and the level of significance (.05), it can be observed that the p-value is
less than the level of significance. This therefore means that the null hypothesis is rejected and
the alternative hypothesis accepted. The conclusion then is that there is significant difference
between payments through credit and visa.
3.3 Does location of items in a shop influence their buying?
Placing items in different locations can indeed influence the amount of those items that can be
bought. Exposing items in a shop make them to be seen by customers thereby prompting the
customers to buy them. On the other hand, products which are placed in crowded shelves or far
from the entrance of the shop can minimize the attention they get from customers thereby
tabler-icon-diamond-filled.svg

Paraphrase This Document

Need a fresh take? Get an instant paraphrase of this document with our AI Paraphraser
Document Page
Research report 8
decreasing their chances of being bought too. Research has it that if products that do not attract
much attention or are not so much on demand placed close to fast moving goods, then their
chances of being bought always increase by some percentage. This is explained by influence of
impulse buying. Harvest Kitchen has five locations where they place their products. What is not
clear is whether the five locations get equal attention and hence purchase from customers. It is
for this reason that this research report decided to carry out an analysis to determine whether
there is significant difference in sales levels from the five different locations. The test statistic to
be employed is an analysis of variance. This test is appropriate since the variables involved are
more than two. The test hypothesis has been illustrated as below;
The test hypothesis
H0: There is no significant difference in the sales of products from the five locations.
Versus
H1: At least sales from one location are different.
The analysis of variance results are as in the table below,
Document Page
Research report 9
ANOVA
Sum of
Squares
df Mean Square F Sig.
location
1
Between Groups 295770218.3
64
185 1598757.937 4.448 .000
Within Groups 44931115.37
9
125 359448.923
Total 340701333.7
43
310
location
2
Between Groups 51535594.66
7
185 278570.782 2.754 .000
Within Groups 12643881.98
2
125 101151.056
Total 64179476.65
0
310
location
3
Between Groups 244998995.0
00
11 22272635.90
9
. .
Within Groups .000 0 .
Total 244998995.0
00
11
location
4
Between Groups 177884531.4
50
147 1210098.853 1.389 .139
Within Groups 27873309.50
0
32 871040.922
Total 205757840.9
50
179
Table 4
Table 4 above is an illustration of analysis of variance results. From the results it can be observed
that the p-values computed are generally less than the level of significance which is .05. The
decision therefore is, the null hypothesis is rejected while the alternative hypothesis is accepted.
The conclusion therefore is that at least the sales level from one or more locations is different.
For the research to establish the different locations, then a Duncan’s test is recommended.
Document Page
Research report 10
3.4 Are sales and gross profit different among the months?
It is a conventional norm in any business that the more the sales the more the gross profit
realized. However sometimes more sales do not translate to more gross profit as products might
be fetching low prices in the market. Again, sales across the year can also not be constant due to
various factors. The factors may include market conditions that do not favor sales such as
excessive supply of a given commodity in the market. Sometimes factors such as weather may
affect the amount of production and hence the amount of sales. Since Harvest Kitchen deals with
agricultural products, due to the above mentioned factors, the sales levels cannot be the same
across the months of the year.
H0: The mean sales level is the same across all the months of the year.
Versus
H1: At least one month is different in terms of sales.
The test’s confidence level is 95%
The results are as in the table below,
tabler-icon-diamond-filled.svg

Paraphrase This Document

Need a fresh take? Get an instant paraphrase of this document with our AI Paraphraser
Document Page
Research report 11
ANOVA
Document Page
Research report 12
Sum of
Squares
df Mean
Square
F Sig.
Net sales
January
Between Groups 3678107.097 30 122603.570 . .
Within Groups .000 0 .
Total 3678107.097 30
Net sales
February
Between Groups 1492938.000 28 53319.214 . .
Within Groups .000 0 .
Total 1492938.000 28
Net sales
March
Between Groups 4187028.774 30 139567.626 . .
Within Groups .000 0 .
Total 4187028.774 30
Net sales April Between Groups 2786878.800 29 96099.269 . .
Within Groups .000 0 .
Total 2786878.800 29
Net sales May Between Groups 3317298.839 30 110576.628 . .
Within Groups .000 0 .
Total 3317298.839 30
Net sales June Between Groups 1418345.467 29 48908.464 . .
Within Groups .000 0 .
Total 1418345.467 29
Net sales July Between Groups 1765256.194 30 58841.873 . .
Within Groups .000 0 .
Total 1765256.194 30
Net sales Aug. Between Groups 2698581.935 30 89952.731 . .
Within Groups .000 0 .
Total 2698581.935 30
Net sales Sep Between Groups 2248828.000 29 77545.793 . .
Within Groups .000 0 .
Total 2248828.000 29
Net sales Oct Between Groups 3395575.419 30 113185.847 . .
Within Groups .000 0 .
Total 3395575.419 30
Net sales Nov Between Groups 2655303.367 29 91562.185 . .
Within Groups .000 0 .
Total 2655303.367 29
Table 5
Document Page
Research report 13
The table 5 above, the analysis of variance results show that there p-values calculated are
generally larger than the significant level used in the test. In anova test, if the p-value is less than
the level of significance, then the decision is always that the null hypothesis is rejected and the
alternative is not rejected. The reverse is also true. In regard to this test rule, since it has been
found in this test that the p-values are less than .05, then the decision rule is that the null
hypothesis is rejected and the alternative is accepted. This means then that at least sales from one
month are different. For the test to determine from which month or months are sales different,
then further tests such as Duncan’s tests are recommended.
Test for gross profit difference between the months
Hypothesis
H0: There is no significant difference in gross profit across the 12 months of the year.
Versus
H1: At least one month is different in terms of gross profit.
In this hypothesis, 95% confidence level has been applied.
The ANOVA results are tabulated as below,
tabler-icon-diamond-filled.svg

Paraphrase This Document

Need a fresh take? Get an instant paraphrase of this document with our AI Paraphraser
Document Page
Research report 14
ANOVA
Sum of
Squares
df Mean
Square
F Sig.
jan_gp Between Groups 50905.200 28 1818.043 4.474 .199
Within Groups 812.659 2 406.329
Total 51717.859 30
feb_gp Between Groups 7919.956 27 293.332 .164 .980
Within Groups 1791.610 1 1791.610
Total 9711.566 28
march_g
p
Between Groups 7419.298 28 264.975 1.097 .586
Within Groups 482.904 2 241.452
Total 7902.202 30
Apr gp Between Groups 3216.693 27 119.137 .156 .995
Within Groups 1528.049 2 764.024
Total 4744.742 29
may_gp Between Groups 12456.400 28 444.871 36.134 .027
Within Groups 24.623 2 12.312
Total 12481.023 30
june_gp Between Groups 6554.626 27 242.764 25.033 .039
Within Groups 19.395 2 9.698
Total 6574.022 29
july_gp Between Groups 8586.214 28 306.651 2.287 .350
Within Groups 268.174 2 134.087
Total 8854.388 30
aug_gp Between Groups 12119.709 28 432.847 1.136 .574
Within Groups 762.284 2 381.142
Total 12881.994 30
sept_gp Between Groups 22640.467 27 838.536 .116 .999
Within Groups 14424.341 2 7212.171
Total 37064.809 29
oct_gp Between Groups 42678.595 28 1524.236 1.087 .590
Within Groups 2803.541 2 1401.771
Total 45482.136 30
nov_gp Between Groups 68636.751 27 2542.102 2.032 .383
Document Page
Research report 15
Within Groups 2502.487 2 1251.244
Total 71139.239 29
Table 6
The table 6 above, the analysis of variance results show that there p-values calculated are
generally larger than the significant level used in the test. In anova test, if the p-value is less than
the level of significance, then the decision is always that the null hypothesis is rejected and the
alternative is not rejected. The reverse is also true. In regard to this test rule, since it has been
found in this test that the p-values are more than .05, then the decision rule is that the null
hypothesis is rejected and the alternative is accepted. This therefore indicates that there is no
significant difference in gross profit across the 12 months of the year.
3.5 Test for relationship between sales and rainfall.
To establish whether there was a relationship between sales and rainfall, a Pearson correlation
test was used to establish the same. A Pearson correlation coefficient usually span from -1 to 1. -
1 means a negative perfect correlation while 1 means a positive perfect positive correlation.
The test results for the correlation are as shown in the table below,
Correlations
SALES RAINFAL
L
SALES Pearson Correlation 1 .057
Sig. (2-tailed) .273
N 366 366
RAINFAL
L
Pearson Correlation .057 1
Sig. (2-tailed) .273
N 366 366
Table 7
Document Page
Research report 16
Table 7 above shows the results for relationship between rainfall and sales. The correlation
coefficient between the two variables is .06. This shows that there is a weak but positive
relationship between rainfall and sales.
3.6 Tests for correlation between sales performance and profits
To establish whether there was a relationship between sales and net profit, a Pearson correlation
test was used to establish the same. A Pearson correlation coefficient usually span from -1 to 1. -
1 means a negative perfect correlation while 1 means a positive perfect positive correlation.
The test results for the correlation are as shown in the table below,
Correlations
SALES Net
profit
SALES Pearson Correlation 1 .017
Sig. (2-tailed) .745
N 366 366
Net
profit
Pearson Correlation .017 1
Sig. (2-tailed) .745
N 366 1034
Table 9
Table 7 above shows the results for relationship between rainfall and sales. The correlation
coefficient between the two variables is .02. This shows that there is a weak but positive
relationship between net profit and sales.
tabler-icon-diamond-filled.svg

Paraphrase This Document

Need a fresh take? Get an instant paraphrase of this document with our AI Paraphraser
Document Page
Research report 17
3.7 DISTRIBUTION OF MONTHLY GROSS PROFIT
Graph of monthly gross profit.
JAN FEB MAR APR MAY JUN JUL AUG SEP OCT NOV DEC
0.00
2000.00
4000.00
6000.00
8000.00
10000.00
12000.00
14000.00
16000.00
GROSS PROFIT
Figure 2
The graph 2 above shows the distribution of gross profit across the 12 months of the year. It can
be observed that there were no significant differences in the gross profit between the months.
4.0 Discussion and recommendation
The research report found that there was no relationship between rainfall and sales. It was also
found that the gross profit the company fetched from sales every month showed not much
improvement. The report therefore recommends to the management of Harvest Kitchen that
Document Page
Research report 18
since it deals in agricultural products, it will be very dangerous to rainfall to do any forecast of
their sales at any month of the year. This is because the two have been found not to have any
strong relationship. The report also recommends that there should be a lot of sales and marketing
done by the company if at all profit margins are to be widened. This is because the current trend
shows little improvement in gross profits from one month to the other.
Document Page
Research report 19
Bibliography
Kotler , P. (2012). Marketing Management: Analysis, Planning, Implementation and Control,.
Englewood Cliffs, NJ.: Prentice-Hall.
March, R. (2009). Tourism marketing myopia'', Tourism Management. (Vol. 15).
Mowlana, H., & Smith, G. (2003). Marketing in a global context: the case of frequent traveler
programs. Journal of Travel Research, 33, 20-27.
Romano, C. (2009). Research strategies for small business: a case study. International Small
Business Journal, 7, 35-43.
chevron_up_icon
1 out of 19
circle_padding
hide_on_mobile
zoom_out_icon
[object Object]