Harvest Kitchen: Business Performance and Research Analysis Report
VerifiedAdded on 2020/03/16
|17
|2815
|233
Report
AI Summary
This business research report analyzes the performance of Harvest Kitchen, a fruit and vegetable business. The report investigates several key research questions, including the top and worst-performing product categories, differences in payment methods (Visa vs. credit), the impact of product location on sales, and variations in sales and gross profits across different months of the year. The analysis uses graphical representations, paired t-tests, and ANOVA to derive insights. Findings reveal that drinks and bakery products perform well, while Ayurvedic and chocolates perform poorly. The report indicates a significant difference between payment methods, with a preference for either Visa or credit. The report also examines the relationship between sales and rainfall. Overall, the report provides a comprehensive overview of Harvest Kitchen's operations, offering recommendations based on the research findings.
Business report 1
Student Name:
Student number:
Lecturer:
Business research report
Student Name:
Student number:
Lecturer:
Business research report
Paraphrase This Document
Need a fresh take? Get an instant paraphrase of this document with our AI Paraphraser
Business report 2
Table of contents
Content Page
1.0 Introduction ……………………………………………………….3
2.0 Problem statement…………………………………………………….3
3.0 Research questions……………………………………………………4
3.1 Top and worst performers…………………………………………….4
3.2 Difference in payment methods ……………………… …………….5
3.3 Difference in sales performance …………………………………….6
3.4 Difference in sales and gross profit………………………………….8
3.5 Test for correlation-sales and rain …………………………….…...13
3.6 Test for correlation-sales and gross profit ………………………….13
3.7 Product category…………………………………………………….14
4.0 Discussion and recommendation …………………………………...15
5.0 Reference……………………… …………………………………...16
Business report 3
1.0 Introduction
Due to globalization, the world markets have joined to become one big market. This has led to
ripple effects to every country especially when there is a major interruption in the economies of
the major super powers. This effect usually trickles down to other economies of the world
thereby affecting business operations. Just about a decade ago there was a major global inflation
that originated from the US that affected the world market. This scenario can be very threatening
especially to upcoming businesses in industries that are dominated by well established
businesses. The small and new businesses have to grapple with high cost of production which in
turn has led to very narrow profit margins and sometimes loses. Many companies for this reason
have reverted to focusing most of their resources to sales and marketing so as to beat the
challenge in the market.
2.0 Statement of the problem
It is evident that for any business to prosper then it must be commanding a substantial customer
base. It is the large customer base that will provide market for the goods produced. This leads to
high sales hence high profit margins. If the profit margins are narrow then the operations of the
business is bound to face a lot of challenges. To solve the problem, business organizations
should focus on creating a lot of leads which will in turn opportunities thereafter. They can do
this by aggressively conducting market campaigns and advertising. High cost of goods which is
also another problem that businesses are faced with can be solved by creating a basis for high
sales thus the problem will automatically be solved by economies of large scale in terms of
profits that will be realized. Harvest Kitchen is a business organization that has been dealing with
fruits and vegetables. It is not a unique business as it has been experiencing problems in sales
⊘ This is a preview!⊘
Do you want full access?
Subscribe today to unlock all pages.
Trusted by 1+ million students worldwide
Business report 4
due to low close on leads and high cost of goods. For this reason, it decided to conduct analysis
on several of its operations in a bid to come up with results that will provide insights on where
they need to rectify to put back Harvest Kitchen back on track.
3.0 Research questions
The following were the main research questions for the report;
Which are the best and poorly performing types of products as far as sales levels are
concerned?
Is there a significant difference in payment methods?
Is there a significant difference in sales of products at different locations in the shop?
Does this affect profits and revenues? In which way?
Is there a difference in sales and gross profits between different months of the year?
Are their differences in sales performance between different seasons?
How does this relate to rainfall and profits?
Paraphrase This Document
Need a fresh take? Get an instant paraphrase of this document with our AI Paraphraser
Business report 5
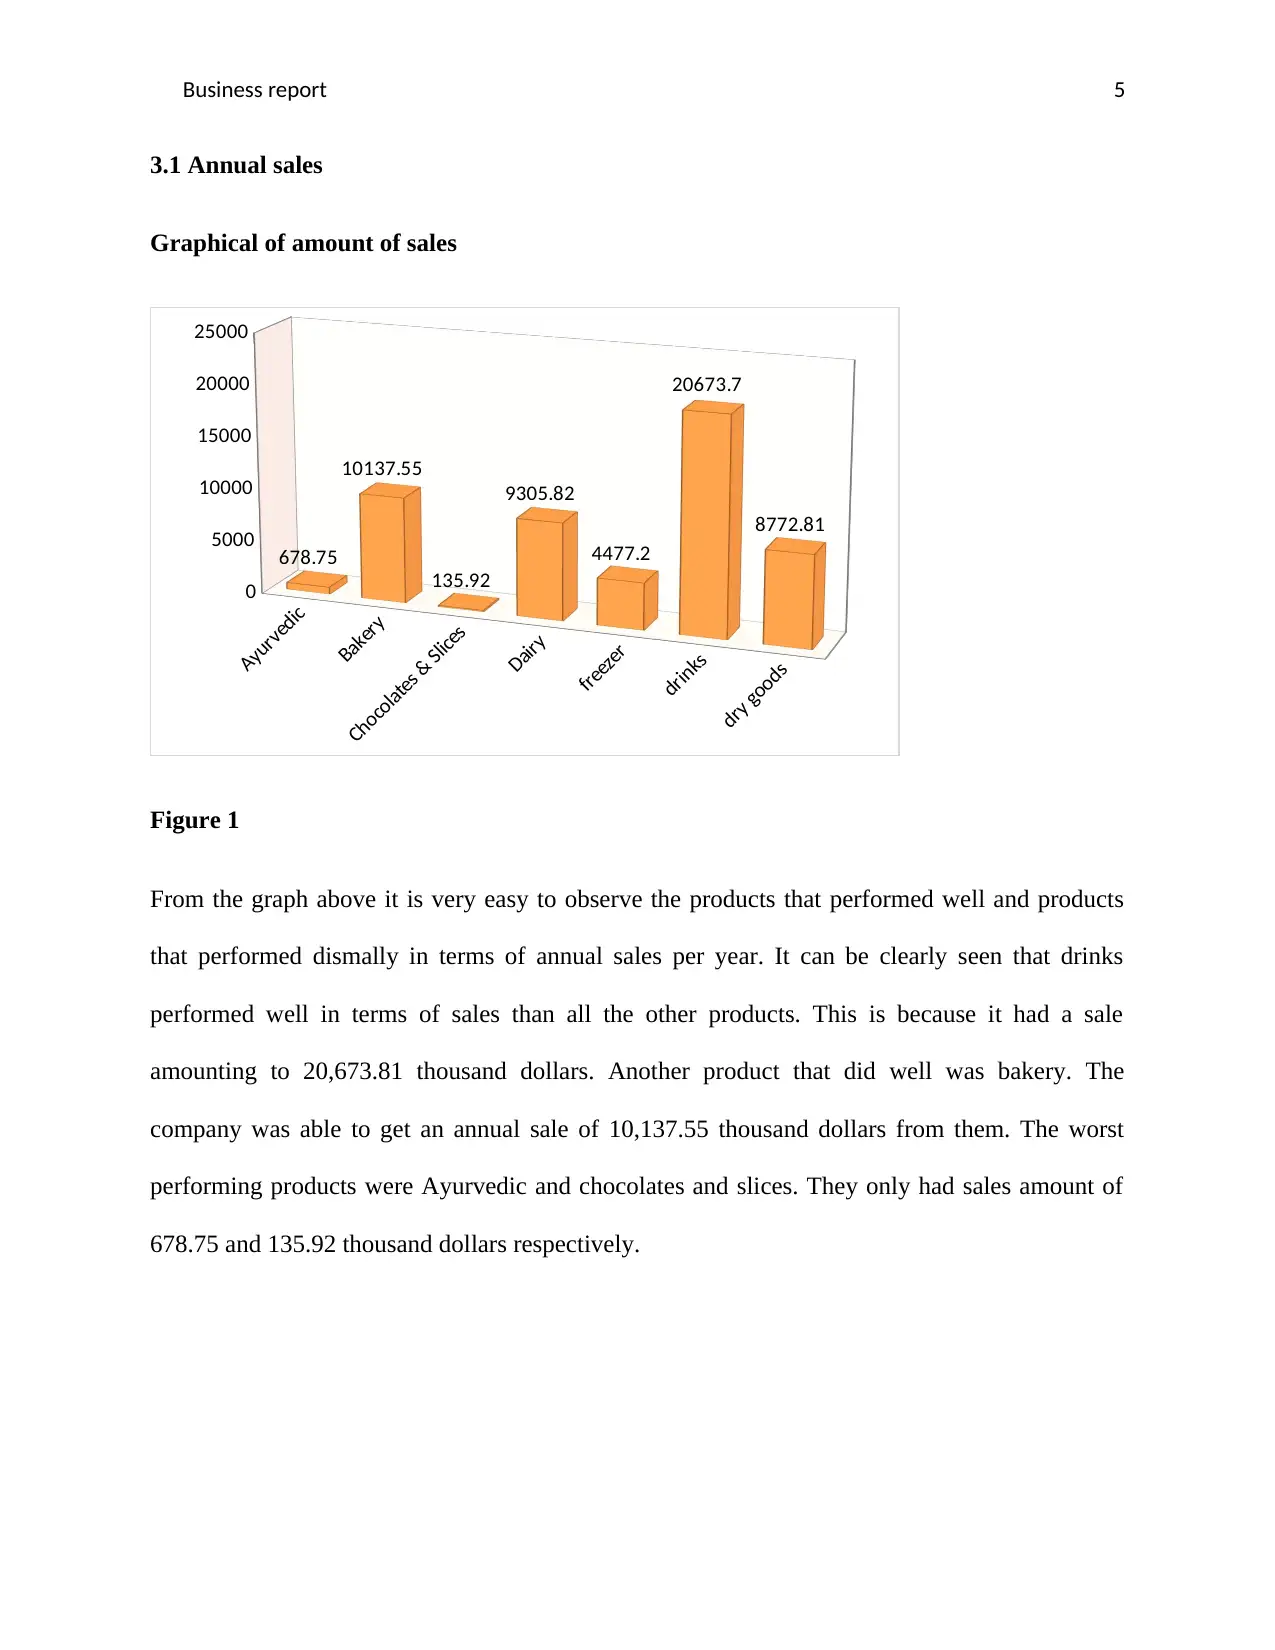
3.1 Annual sales
Graphical of amount of sales
Ayurvedic
Bakery
Chocolates & Slices
Dairy
freezer
drinks
dry goods
0
5000
10000
15000
20000
25000
678.75
10137.55
135.92
9305.82
4477.2
20673.7
8772.81
Figure 1
From the graph above it is very easy to observe the products that performed well and products
that performed dismally in terms of annual sales per year. It can be clearly seen that drinks
performed well in terms of sales than all the other products. This is because it had a sale
amounting to 20,673.81 thousand dollars. Another product that did well was bakery. The
company was able to get an annual sale of 10,137.55 thousand dollars from them. The worst
performing products were Ayurvedic and chocolates and slices. They only had sales amount of
678.75 and 135.92 thousand dollars respectively.
Business report 6
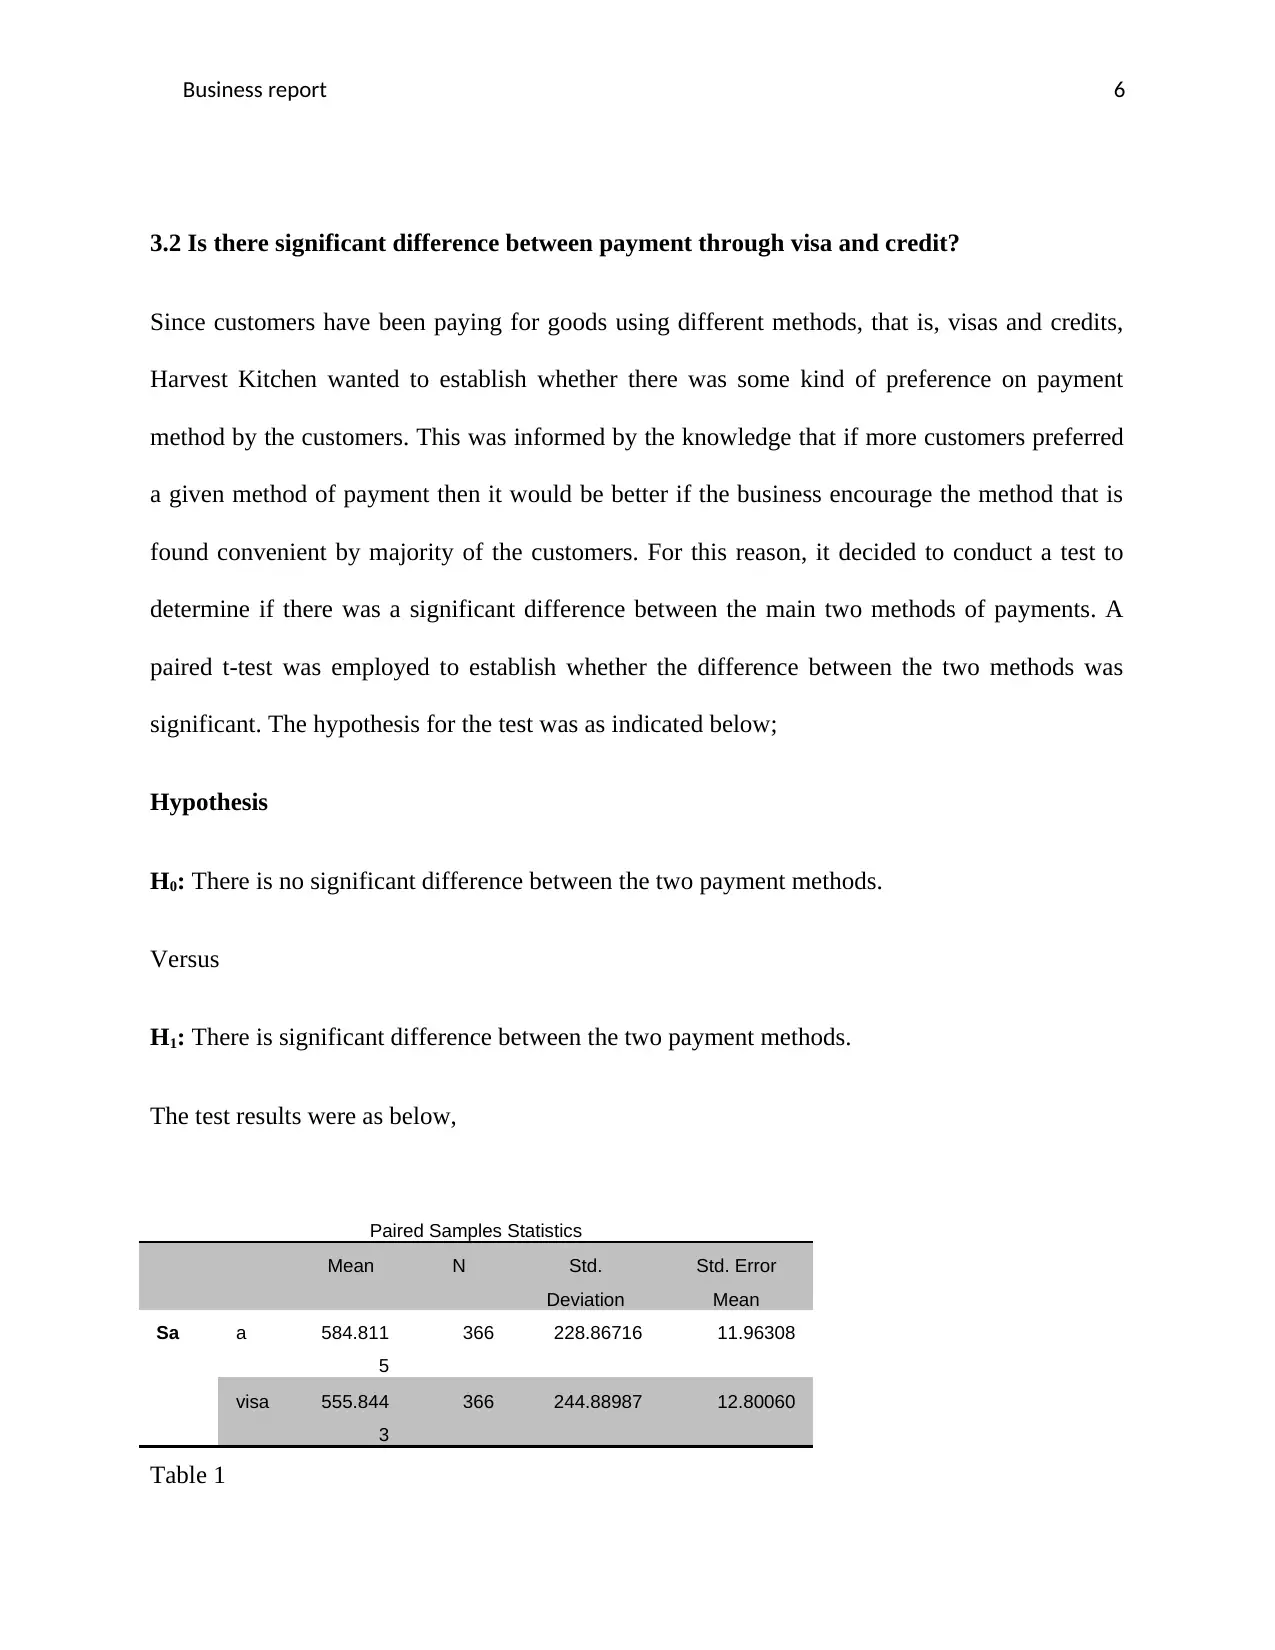
3.2 Is there significant difference between payment through visa and credit?
Since customers have been paying for goods using different methods, that is, visas and credits,
Harvest Kitchen wanted to establish whether there was some kind of preference on payment
method by the customers. This was informed by the knowledge that if more customers preferred
a given method of payment then it would be better if the business encourage the method that is
found convenient by majority of the customers. For this reason, it decided to conduct a test to
determine if there was a significant difference between the main two methods of payments. A
paired t-test was employed to establish whether the difference between the two methods was
significant. The hypothesis for the test was as indicated below;
Hypothesis
H0: There is no significant difference between the two payment methods.
Versus
H1: There is significant difference between the two payment methods.
The test results were as below,
Paired Samples Statistics
Mean N Std.
Deviation
Std. Error
Mean
Sa a 584.811
5
366 228.86716 11.96308
visa 555.844
3
366 244.88987 12.80060
Table 1
⊘ This is a preview!⊘
Do you want full access?
Subscribe today to unlock all pages.
Trusted by 1+ million students worldwide
Business report 7
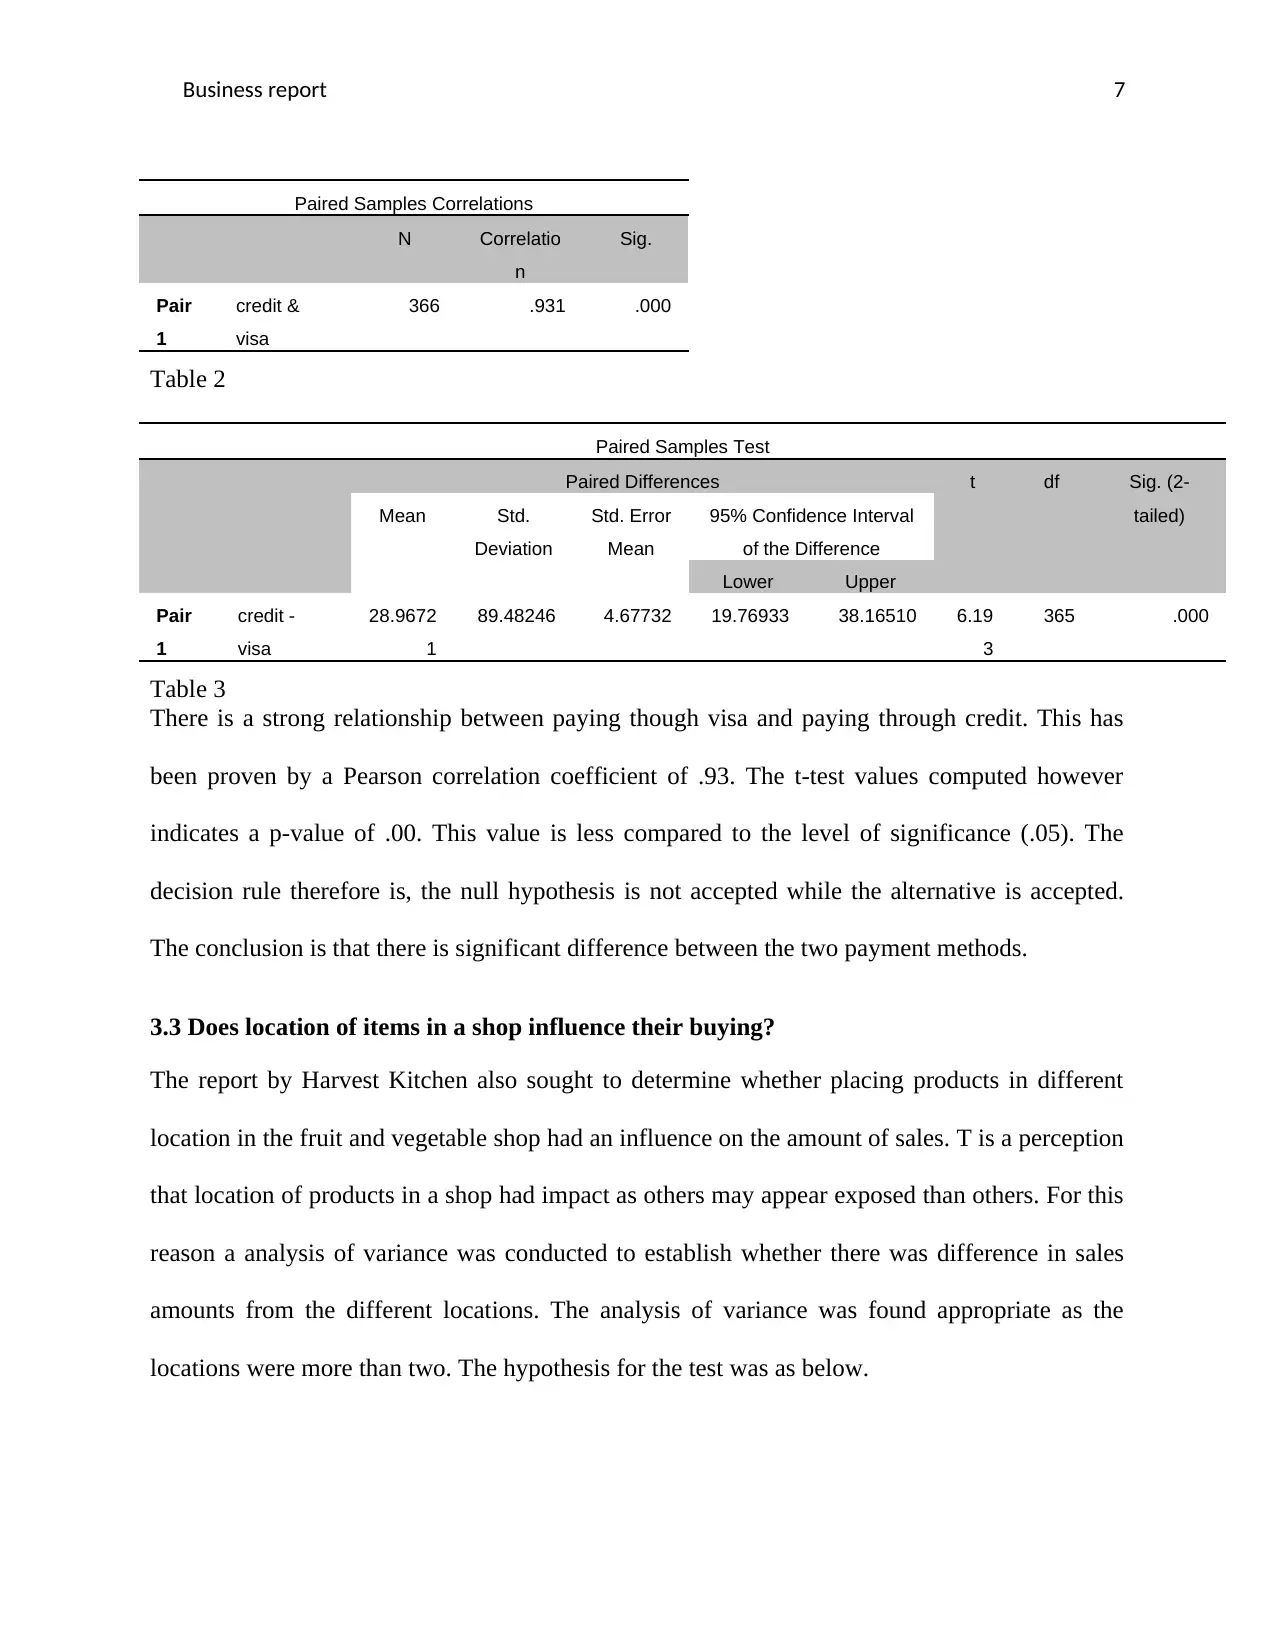
Paired Samples Correlations
N Correlatio
n
Sig.
Pair
1
credit &
visa
366 .931 .000
Table 2
Paired Samples Test
Paired Differences t df Sig. (2-
tailed)Mean Std.
Deviation
Std. Error
Mean
95% Confidence Interval
of the Difference
Lower Upper
Pair
1
credit -
visa
28.9672
1
89.48246 4.67732 19.76933 38.16510 6.19
3
365 .000
Table 3
There is a strong relationship between paying though visa and paying through credit. This has
been proven by a Pearson correlation coefficient of .93. The t-test values computed however
indicates a p-value of .00. This value is less compared to the level of significance (.05). The
decision rule therefore is, the null hypothesis is not accepted while the alternative is accepted.
The conclusion is that there is significant difference between the two payment methods.
3.3 Does location of items in a shop influence their buying?
The report by Harvest Kitchen also sought to determine whether placing products in different
location in the fruit and vegetable shop had an influence on the amount of sales. T is a perception
that location of products in a shop had impact as others may appear exposed than others. For this
reason a analysis of variance was conducted to establish whether there was difference in sales
amounts from the different locations. The analysis of variance was found appropriate as the
locations were more than two. The hypothesis for the test was as below.
Paraphrase This Document
Need a fresh take? Get an instant paraphrase of this document with our AI Paraphraser
Business report 8
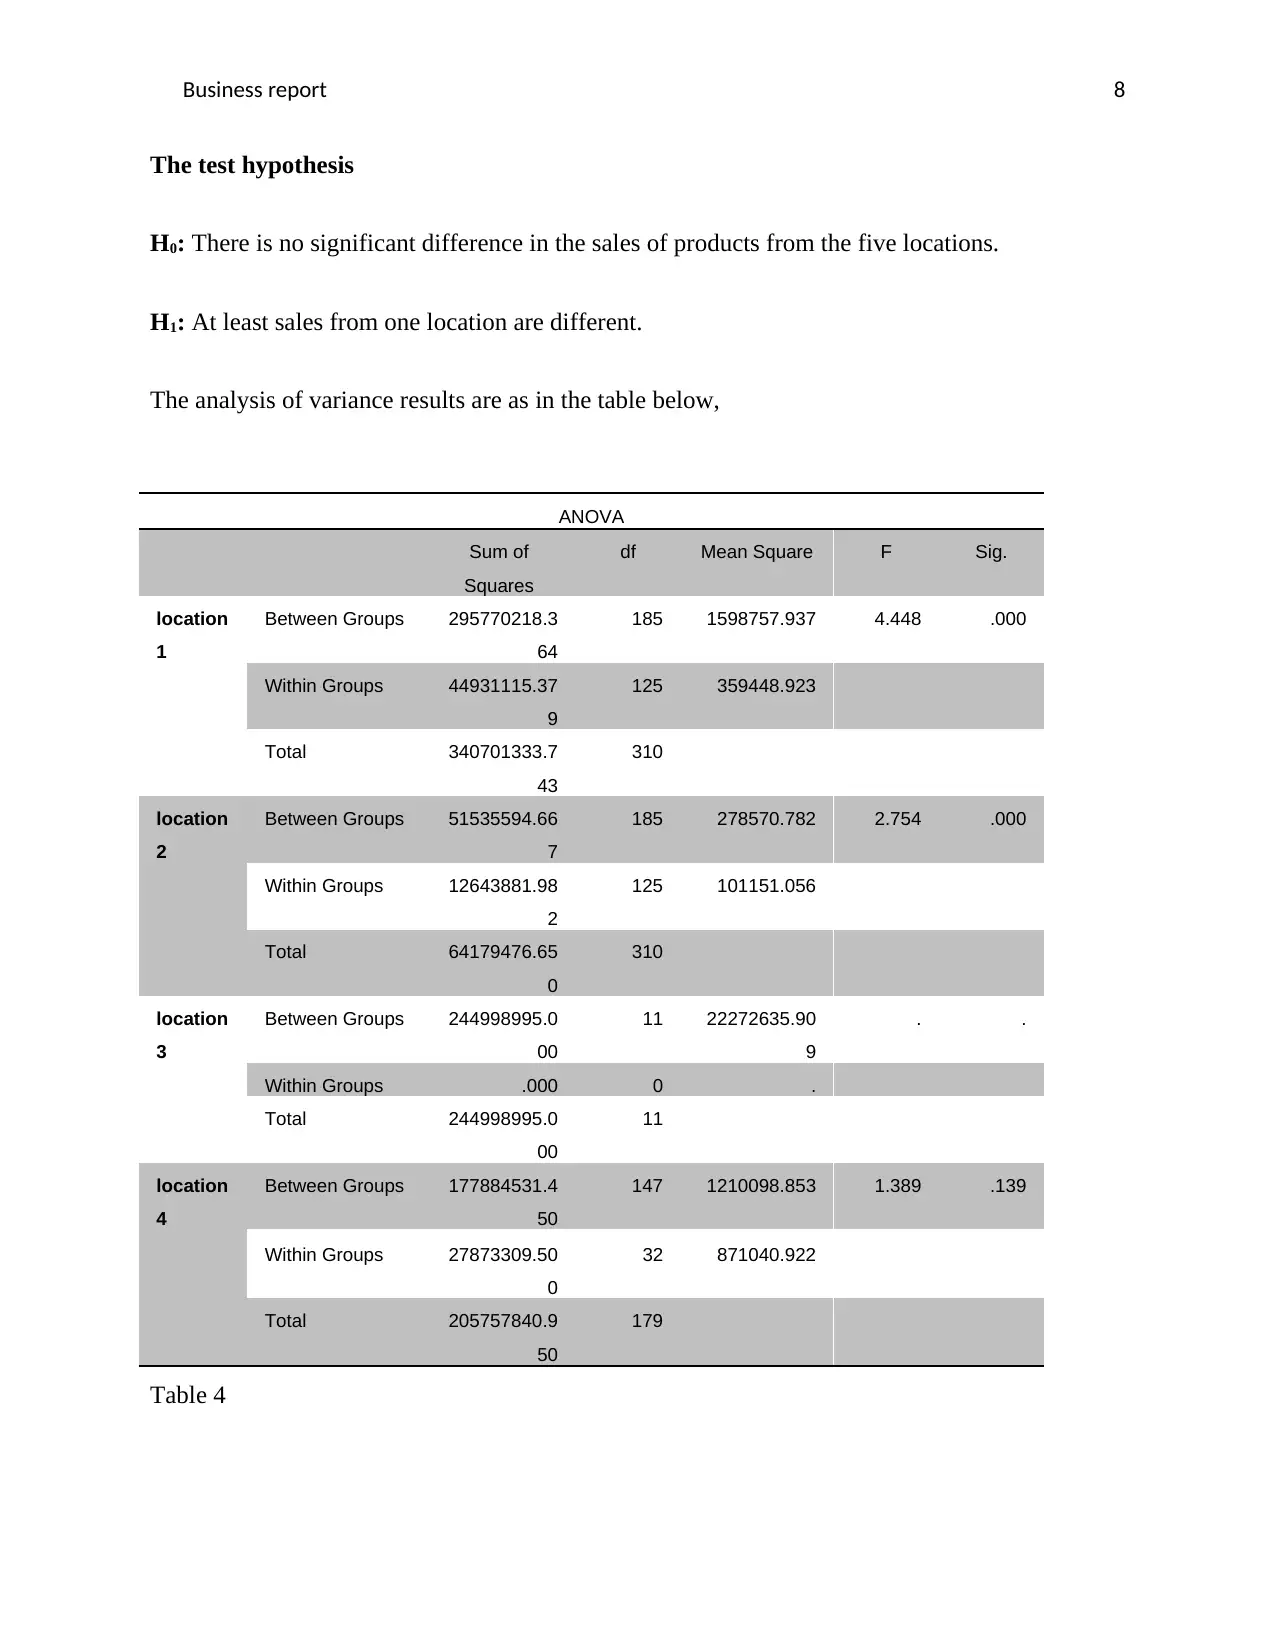
The test hypothesis
H0: There is no significant difference in the sales of products from the five locations.
H1: At least sales from one location are different.
The analysis of variance results are as in the table below,
ANOVA
Sum of
Squares
df Mean Square F Sig.
location
1
Between Groups 295770218.3
64
185 1598757.937 4.448 .000
Within Groups 44931115.37
9
125 359448.923
Total 340701333.7
43
310
location
2
Between Groups 51535594.66
7
185 278570.782 2.754 .000
Within Groups 12643881.98
2
125 101151.056
Total 64179476.65
0
310
location
3
Between Groups 244998995.0
00
11 22272635.90
9
. .
Within Groups .000 0 .
Total 244998995.0
00
11
location
4
Between Groups 177884531.4
50
147 1210098.853 1.389 .139
Within Groups 27873309.50
0
32 871040.922
Total 205757840.9
50
179
Table 4
Business report 9
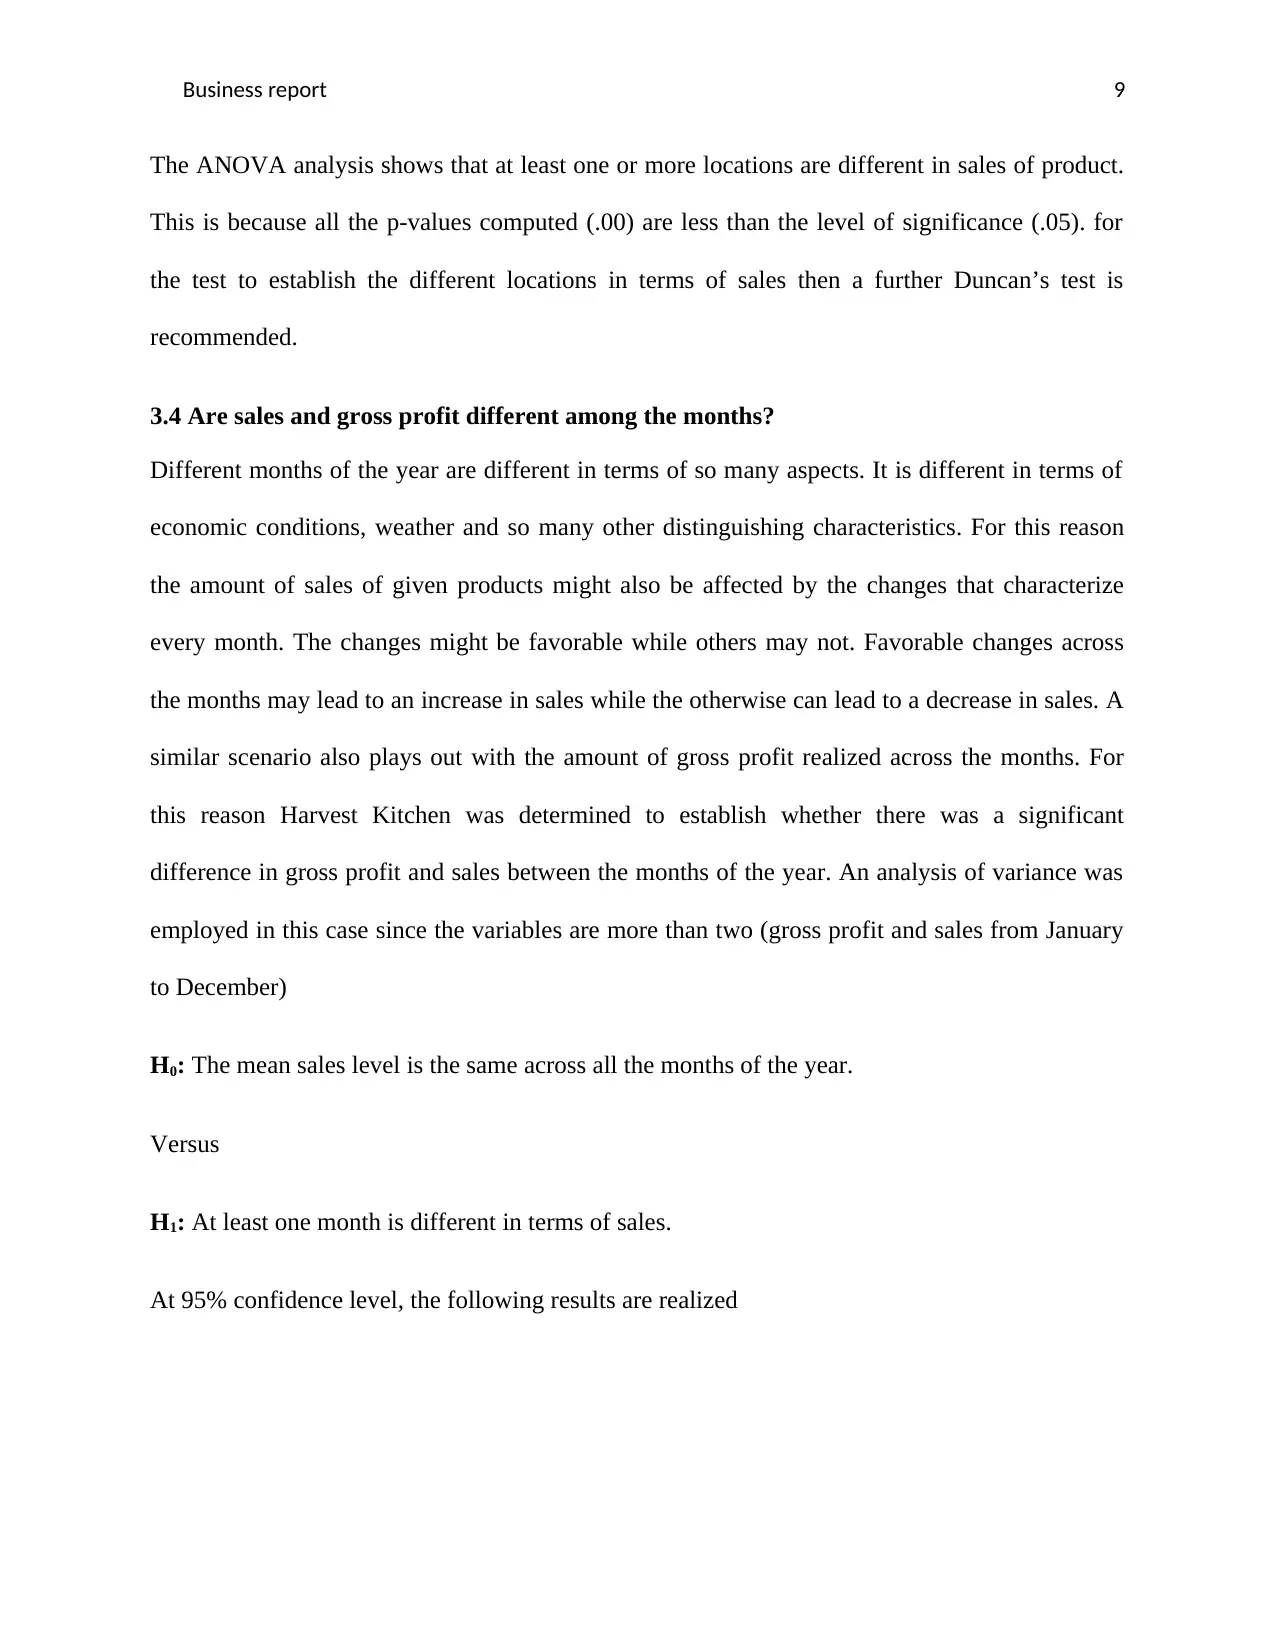
The ANOVA analysis shows that at least one or more locations are different in sales of product.
This is because all the p-values computed (.00) are less than the level of significance (.05). for
the test to establish the different locations in terms of sales then a further Duncan’s test is
recommended.
3.4 Are sales and gross profit different among the months?
Different months of the year are different in terms of so many aspects. It is different in terms of
economic conditions, weather and so many other distinguishing characteristics. For this reason
the amount of sales of given products might also be affected by the changes that characterize
every month. The changes might be favorable while others may not. Favorable changes across
the months may lead to an increase in sales while the otherwise can lead to a decrease in sales. A
similar scenario also plays out with the amount of gross profit realized across the months. For
this reason Harvest Kitchen was determined to establish whether there was a significant
difference in gross profit and sales between the months of the year. An analysis of variance was
employed in this case since the variables are more than two (gross profit and sales from January
to December)
H0: The mean sales level is the same across all the months of the year.
Versus
H1: At least one month is different in terms of sales.
At 95% confidence level, the following results are realized
⊘ This is a preview!⊘
Do you want full access?
Subscribe today to unlock all pages.
Trusted by 1+ million students worldwide
Business report 10
ANOVA
Sum of
Squares
df Mean
Square
F Sig.
Net sales
January
Between Groups 3678107.097 30 122603.570 . .
Within Groups .000 0 .
Total 3678107.097 30
Net sales
February
Between Groups 1492938.000 28 53319.214 . .
Within Groups .000 0 .
Total 1492938.000 28
Net sales
March
Between Groups 4187028.774 30 139567.626 . .
Within Groups .000 0 .
Total 4187028.774 30
Net sales April Between Groups 2786878.800 29 96099.269 . .
Within Groups .000 0 .
Total 2786878.800 29
Net sales May Between Groups 3317298.839 30 110576.628 . .
Within Groups .000 0 .
Total 3317298.839 30
Net sales June Between Groups 1418345.467 29 48908.464 . .
Within Groups .000 0 .
Total 1418345.467 29
Net sales July Between Groups 1765256.194 30 58841.873 . .
Within Groups .000 0 .
Total 1765256.194 30
Net sales Aug. Between Groups 2698581.935 30 89952.731 . .
Within Groups .000 0 .
Total 2698581.935 30
Net sales Sep Between Groups 2248828.000 29 77545.793 . .
Within Groups .000 0 .
Total 2248828.000 29
Net sales Oct Between Groups 3395575.419 30 113185.847 . .
Within Groups .000 0 .
Total 3395575.419 30
Net sales Nov Between Groups 2655303.367 29 91562.185 . .
Within Groups .000 0 .
Total 2655303.367 29
Table 5
Paraphrase This Document
Need a fresh take? Get an instant paraphrase of this document with our AI Paraphraser
Business report 11
The ANOVA analysis shows that at least one or more months have different in sales amounts.
This is because all the p-values computed (.00) are less than the level of significance (.05). For
the test to establish the different months in terms of net sales then a further Duncan’s test is
recommended.
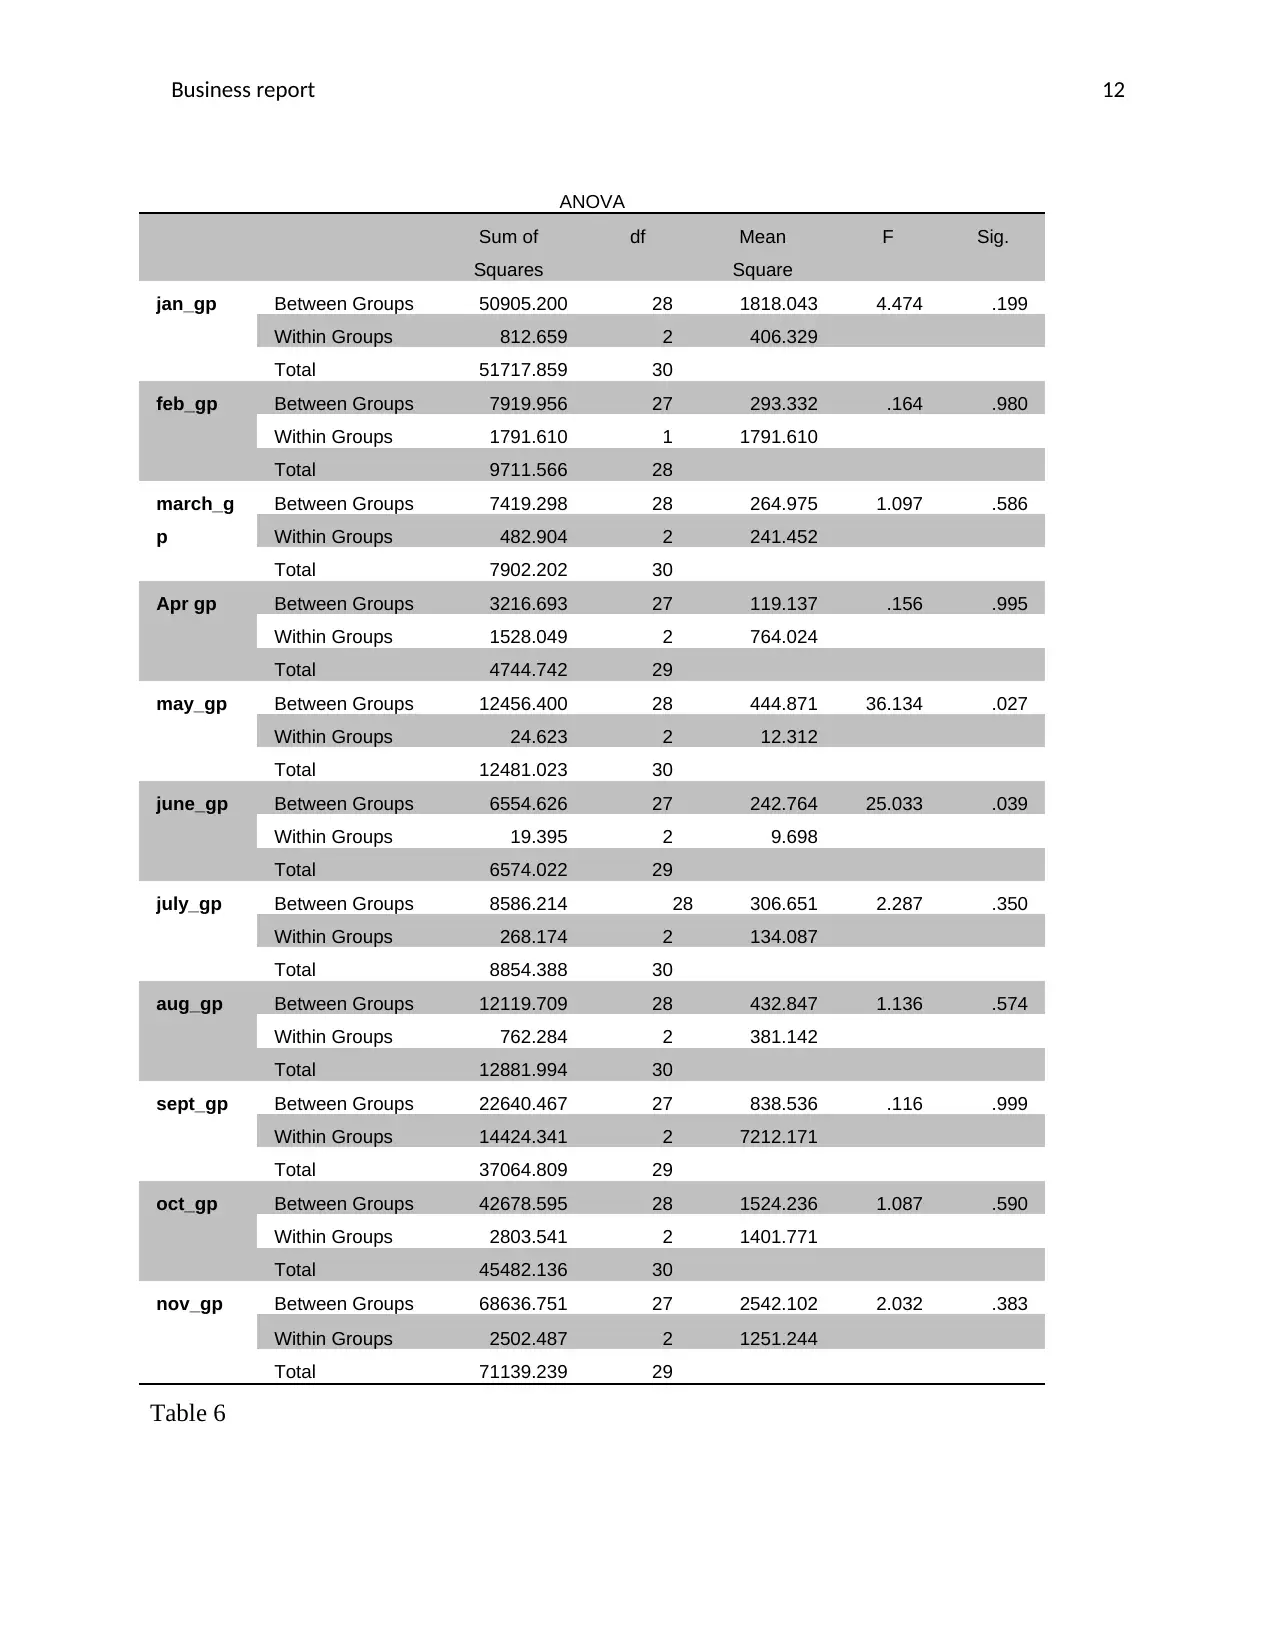
Test for gross profit difference between the months
Hypothesis
H0: There is no significant difference in gross profit across the 12 months of the year.
Versus
H1: At least one month is different in terms of gross profit.
At 95% confidence level The ANOVA results are tabulated as below,
The ANOVA analysis shows that at least one or more months have different in sales amounts.
This is because all the p-values computed (.00) are less than the level of significance (.05). For
the test to establish the different months in terms of net sales then a further Duncan’s test is
recommended.
Test for gross profit difference between the months
Hypothesis
H0: There is no significant difference in gross profit across the 12 months of the year.
Versus
H1: At least one month is different in terms of gross profit.
At 95% confidence level The ANOVA results are tabulated as below,
Business report 12
ANOVA
Sum of
Squares
df Mean
Square
F Sig.
jan_gp Between Groups 50905.200 28 1818.043 4.474 .199
Within Groups 812.659 2 406.329
Total 51717.859 30
feb_gp Between Groups 7919.956 27 293.332 .164 .980
Within Groups 1791.610 1 1791.610
Total 9711.566 28
march_g
p
Between Groups 7419.298 28 264.975 1.097 .586
Within Groups 482.904 2 241.452
Total 7902.202 30
Apr gp Between Groups 3216.693 27 119.137 .156 .995
Within Groups 1528.049 2 764.024
Total 4744.742 29
may_gp Between Groups 12456.400 28 444.871 36.134 .027
Within Groups 24.623 2 12.312
Total 12481.023 30
june_gp Between Groups 6554.626 27 242.764 25.033 .039
Within Groups 19.395 2 9.698
Total 6574.022 29
july_gp Between Groups 8586.214 28 306.651 2.287 .350
Within Groups 268.174 2 134.087
Total 8854.388 30
aug_gp Between Groups 12119.709 28 432.847 1.136 .574
Within Groups 762.284 2 381.142
Total 12881.994 30
sept_gp Between Groups 22640.467 27 838.536 .116 .999
Within Groups 14424.341 2 7212.171
Total 37064.809 29
oct_gp Between Groups 42678.595 28 1524.236 1.087 .590
Within Groups 2803.541 2 1401.771
Total 45482.136 30
nov_gp Between Groups 68636.751 27 2542.102 2.032 .383
Within Groups 2502.487 2 1251.244
Total 71139.239 29
Table 6
⊘ This is a preview!⊘
Do you want full access?
Subscribe today to unlock all pages.
Trusted by 1+ million students worldwide
1 out of 17
Related Documents


Your All-in-One AI-Powered Toolkit for Academic Success.
+13062052269
info@desklib.com
Available 24*7 on WhatsApp / Email
![[object Object]](/_next/static/media/star-bottom.7253800d.svg)
Unlock your academic potential
Copyright © 2020–2026 A2Z Services. All Rights Reserved. Developed and managed by ZUCOL.