Harvest Kitchen Shop Report: Sales, Profit, Analytics, and Insights
VerifiedAdded on 2020/05/11
|12
|1822
|58
Report
AI Summary
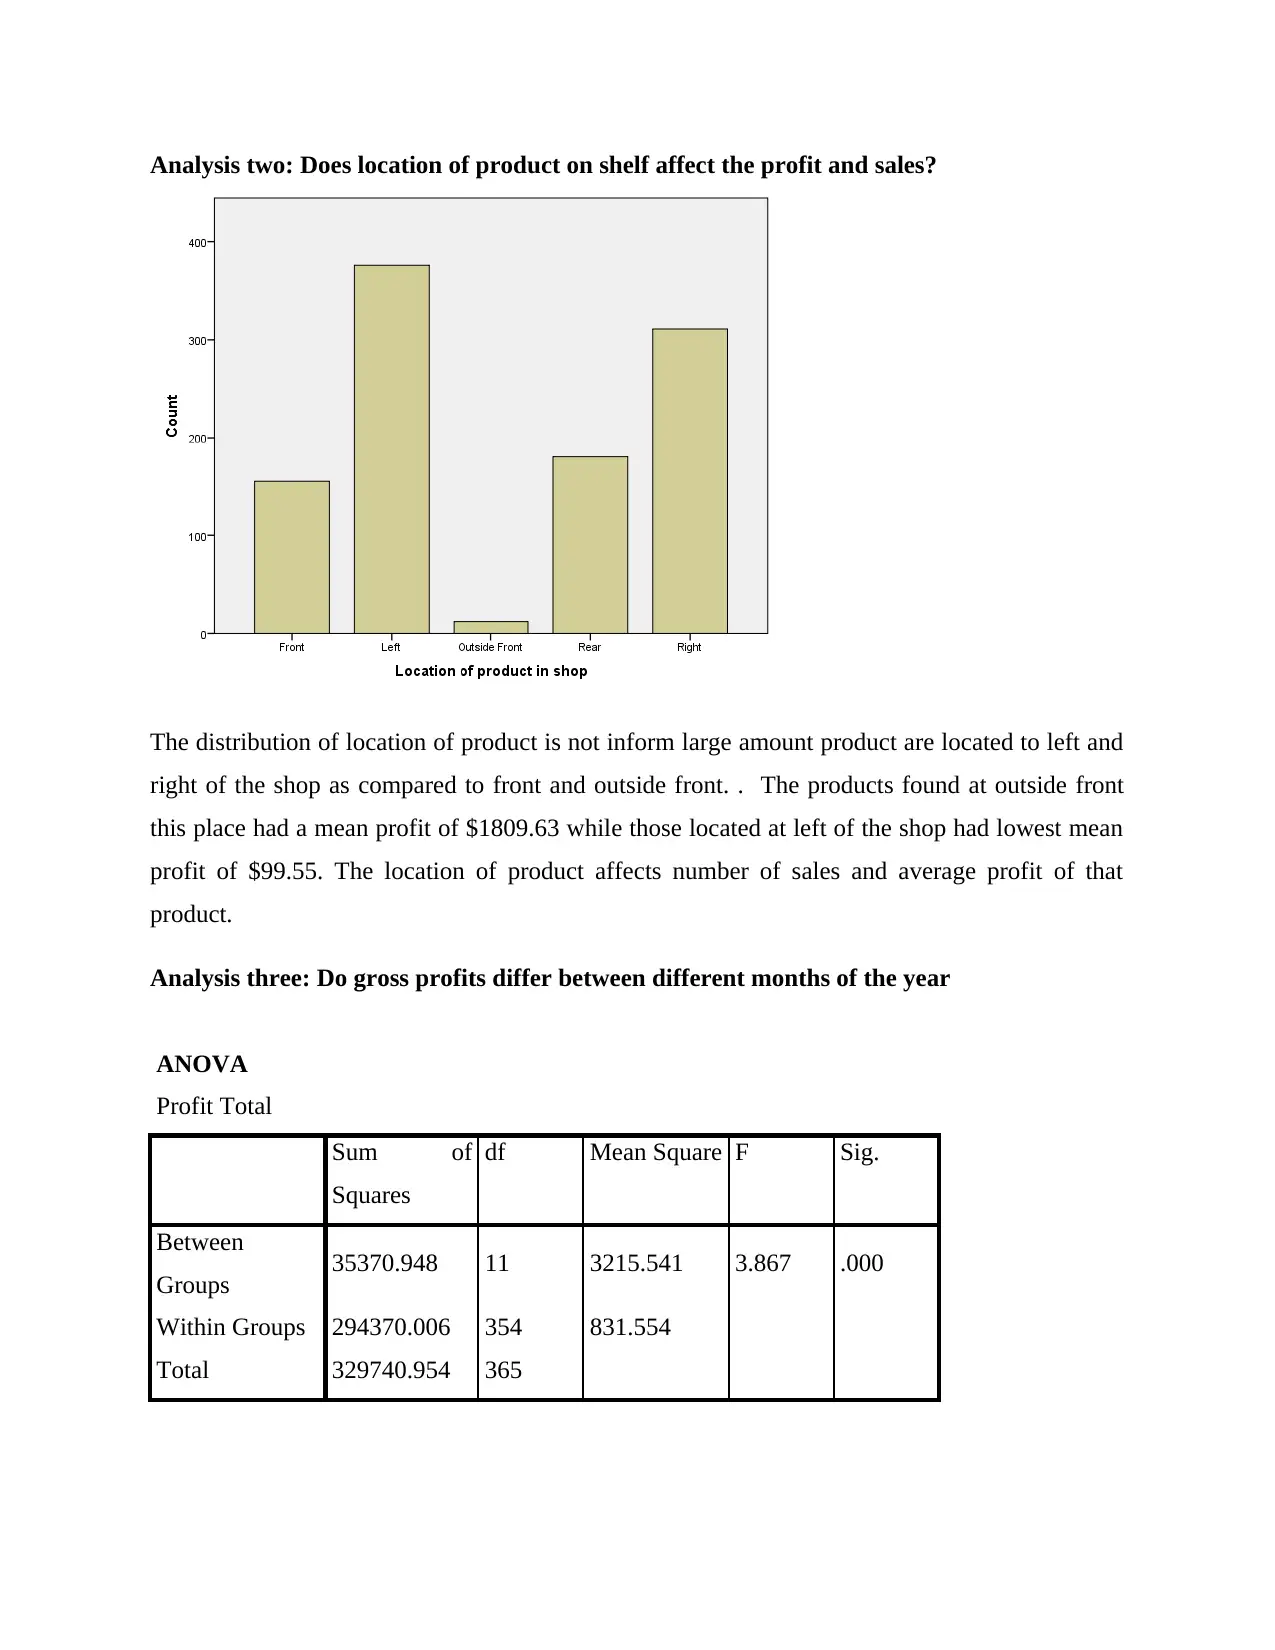
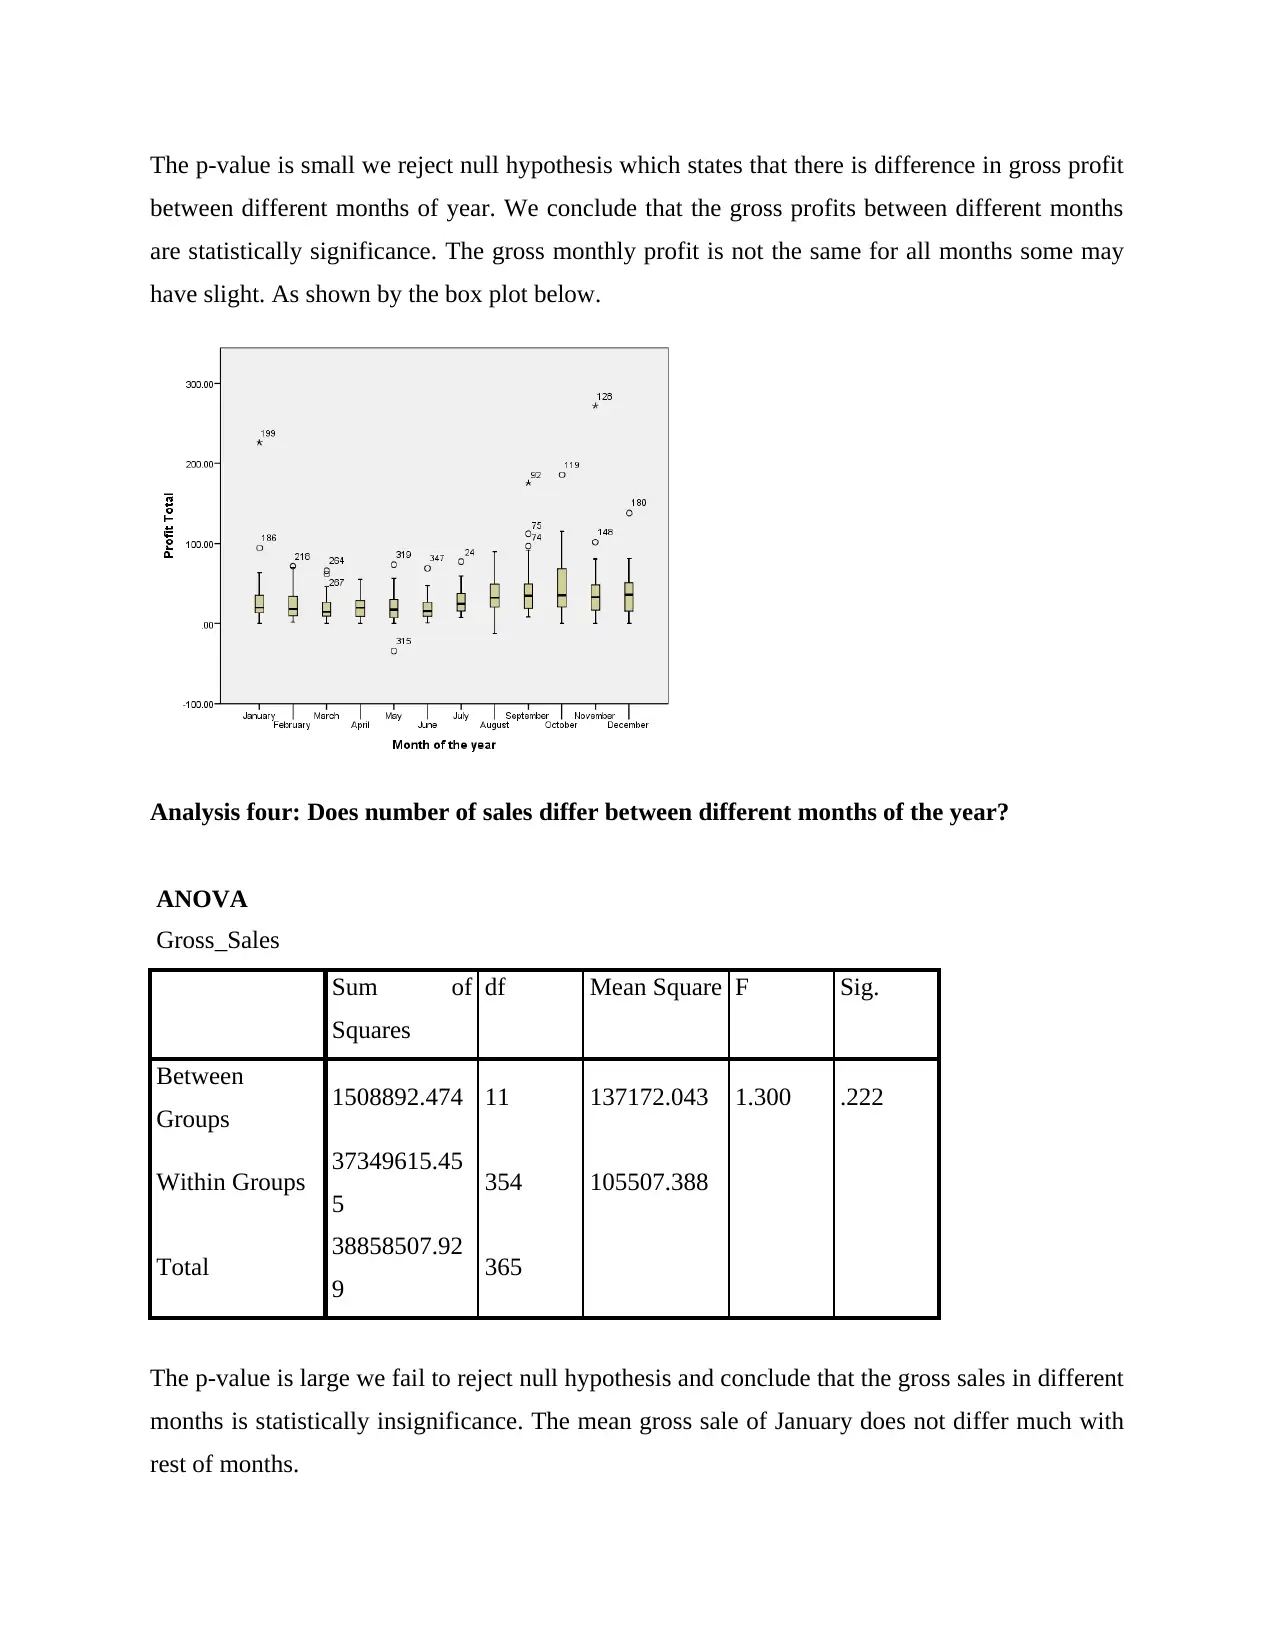
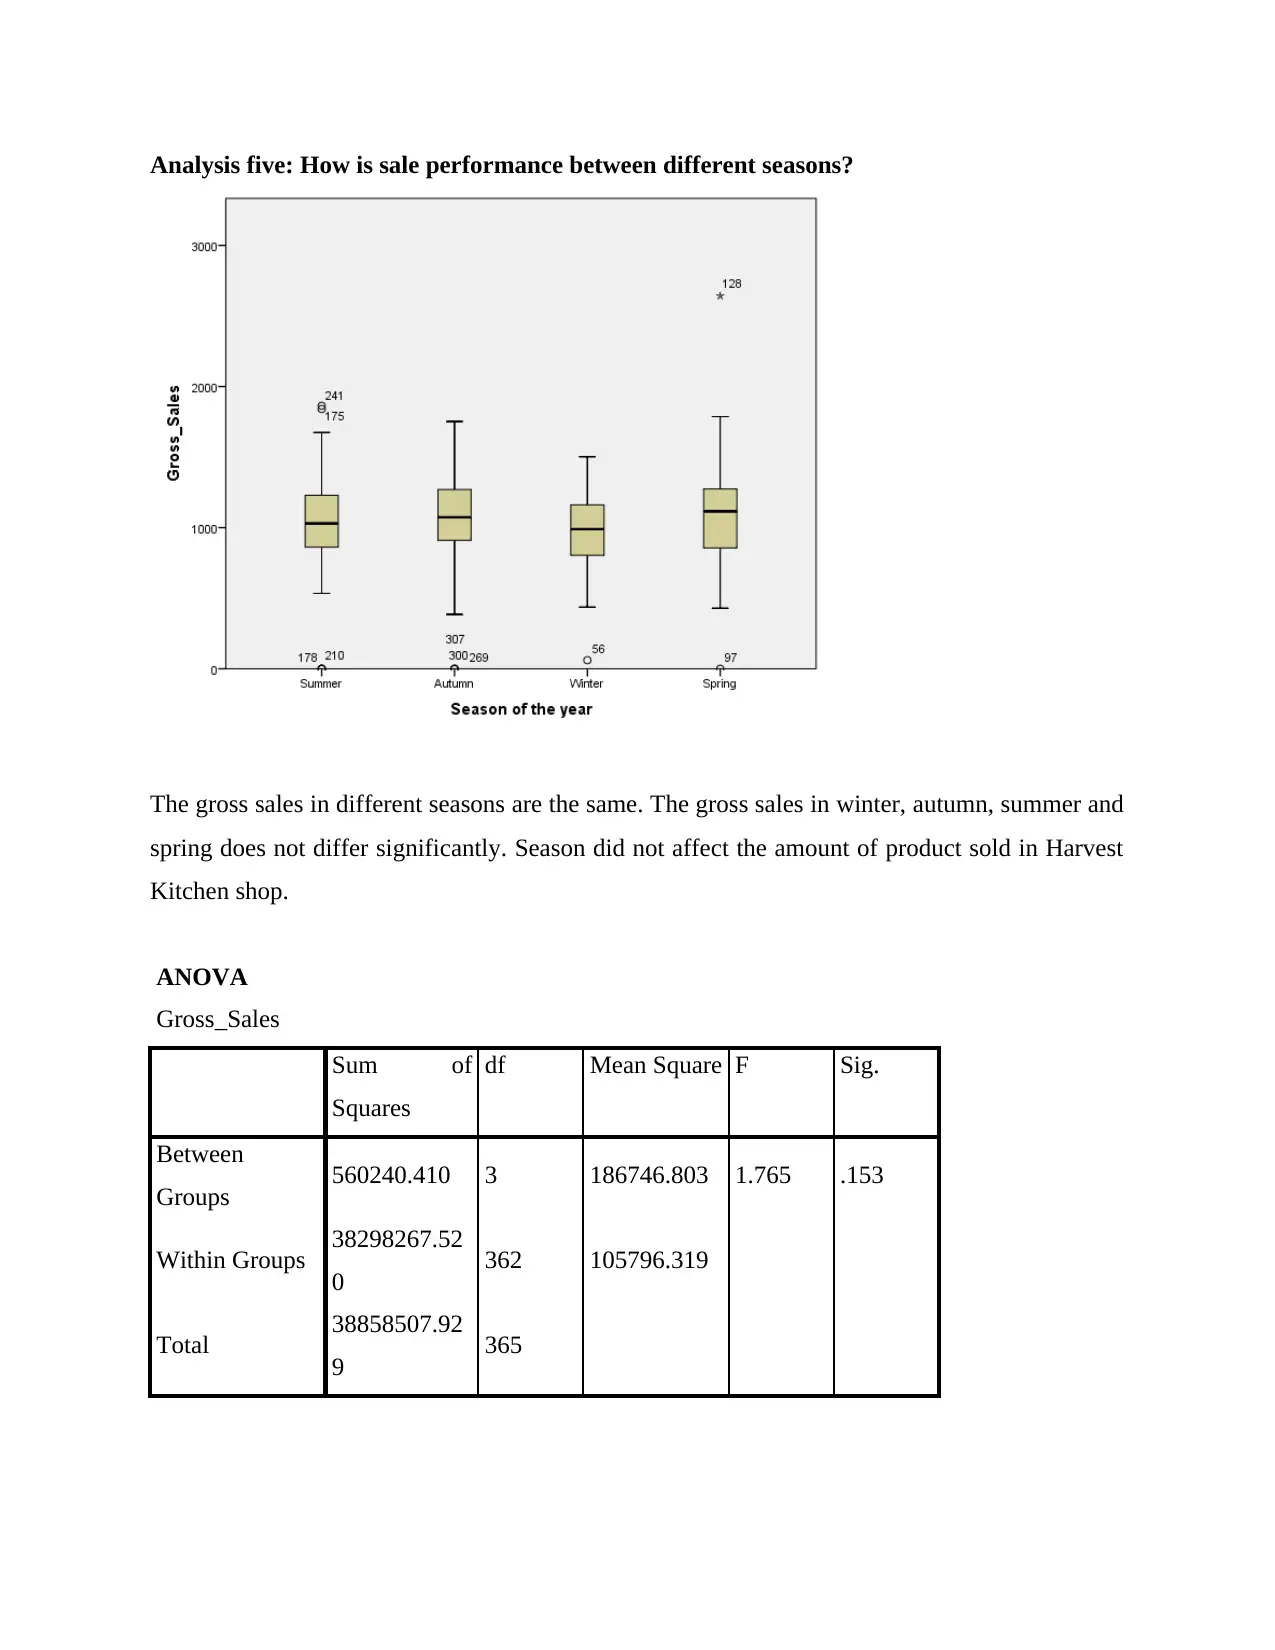
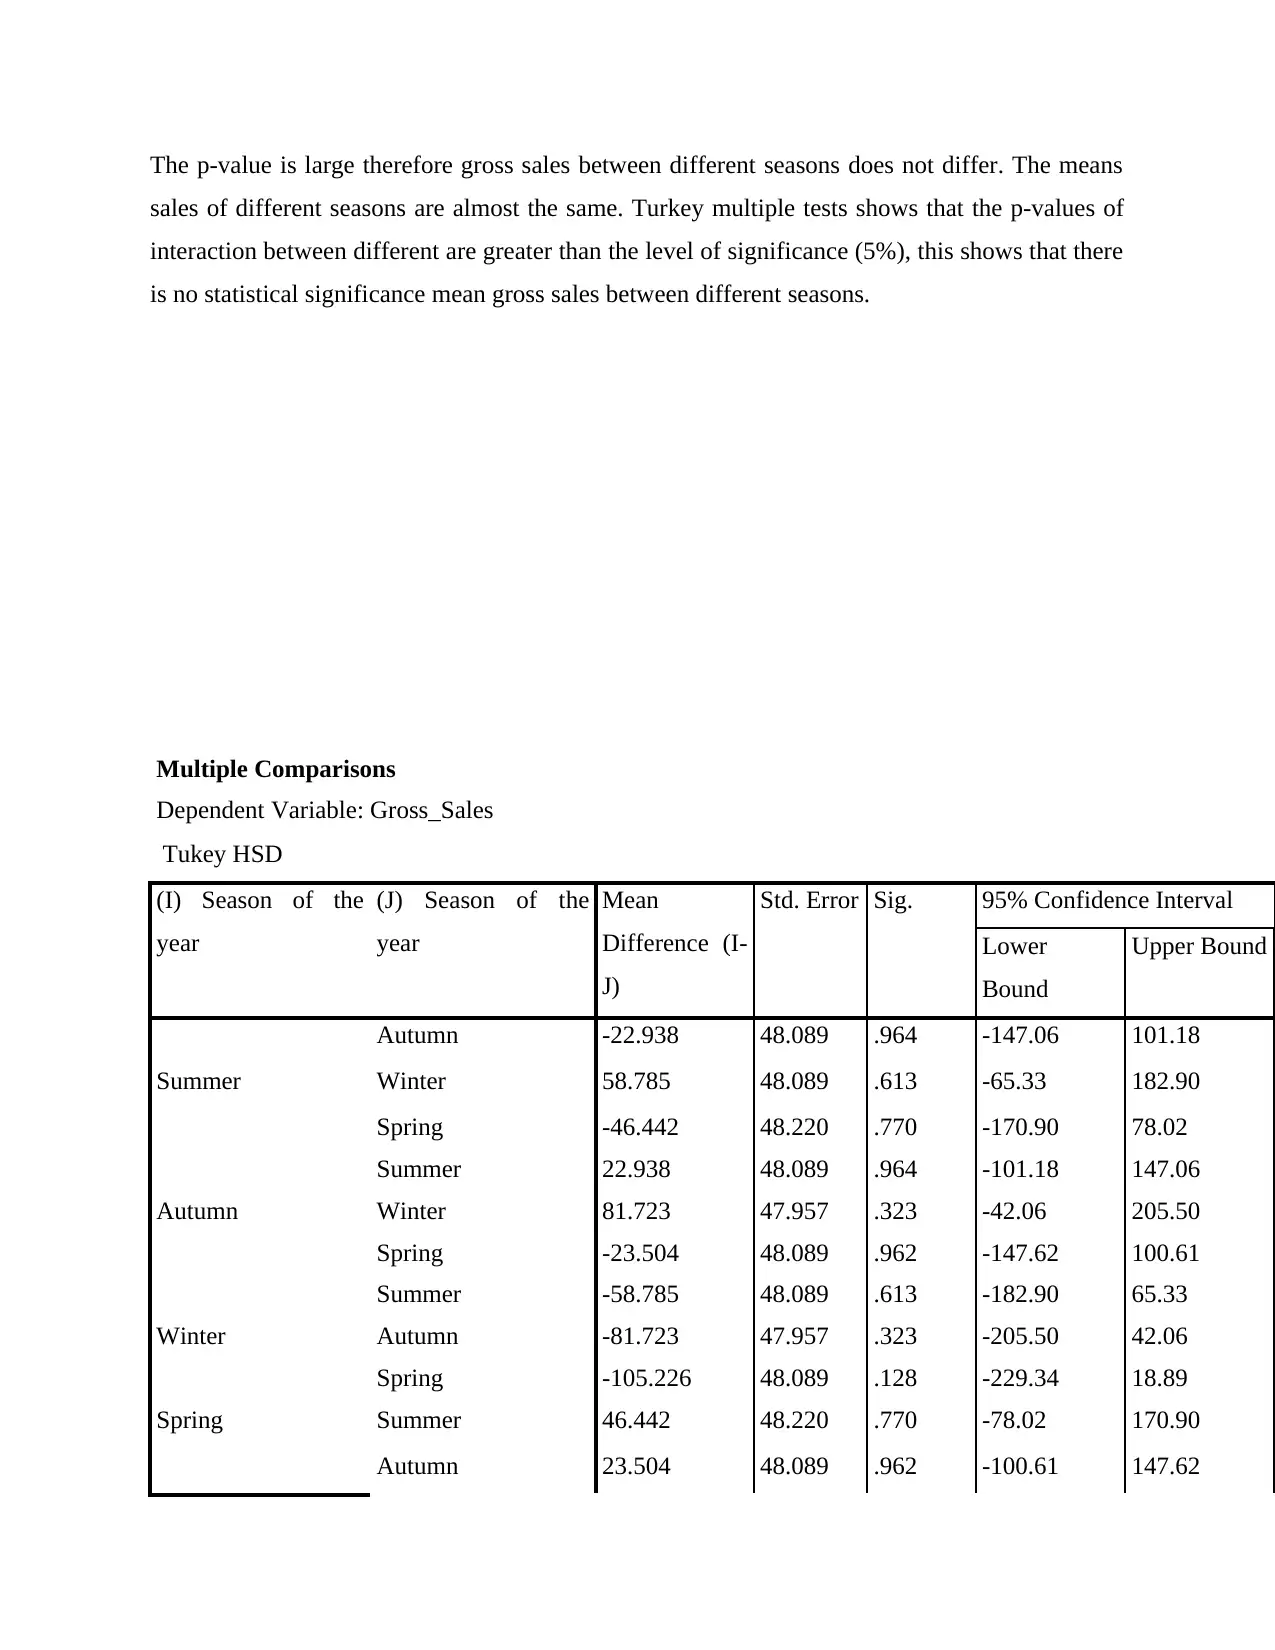
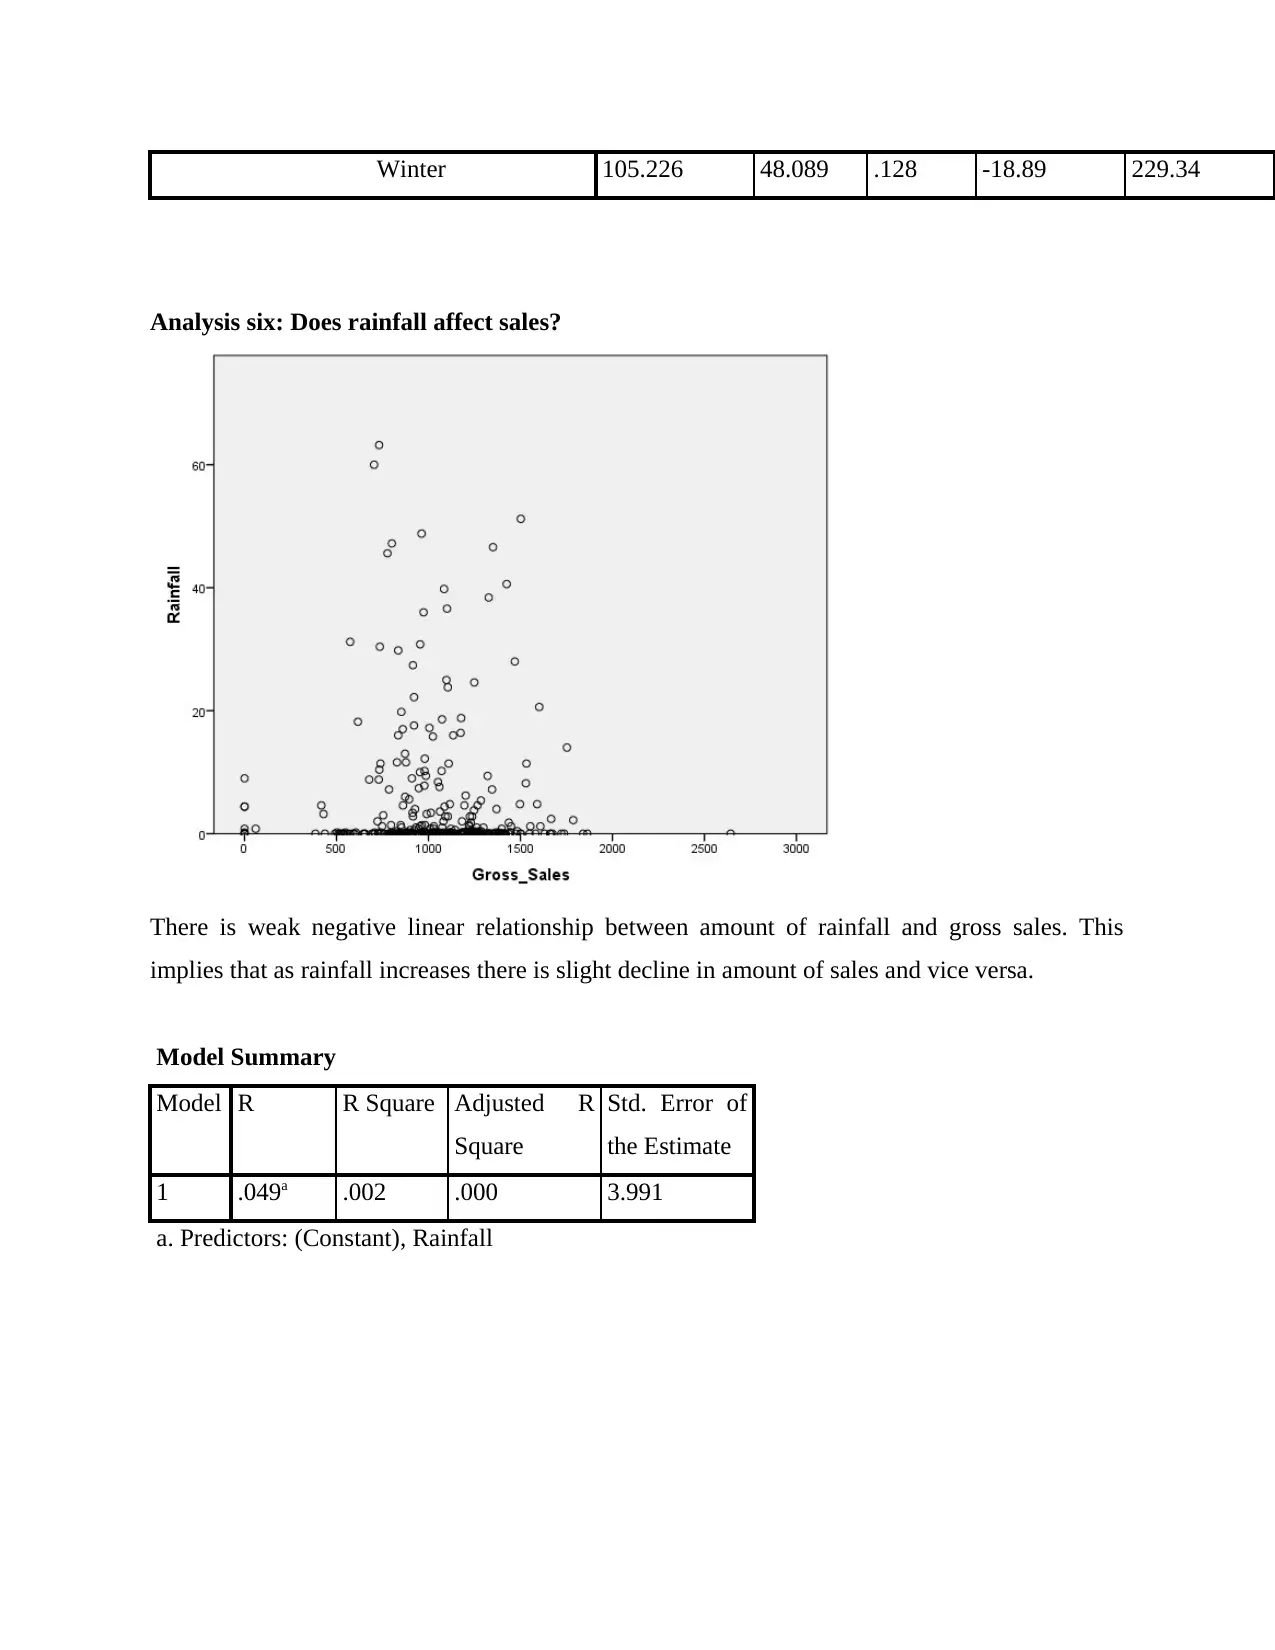
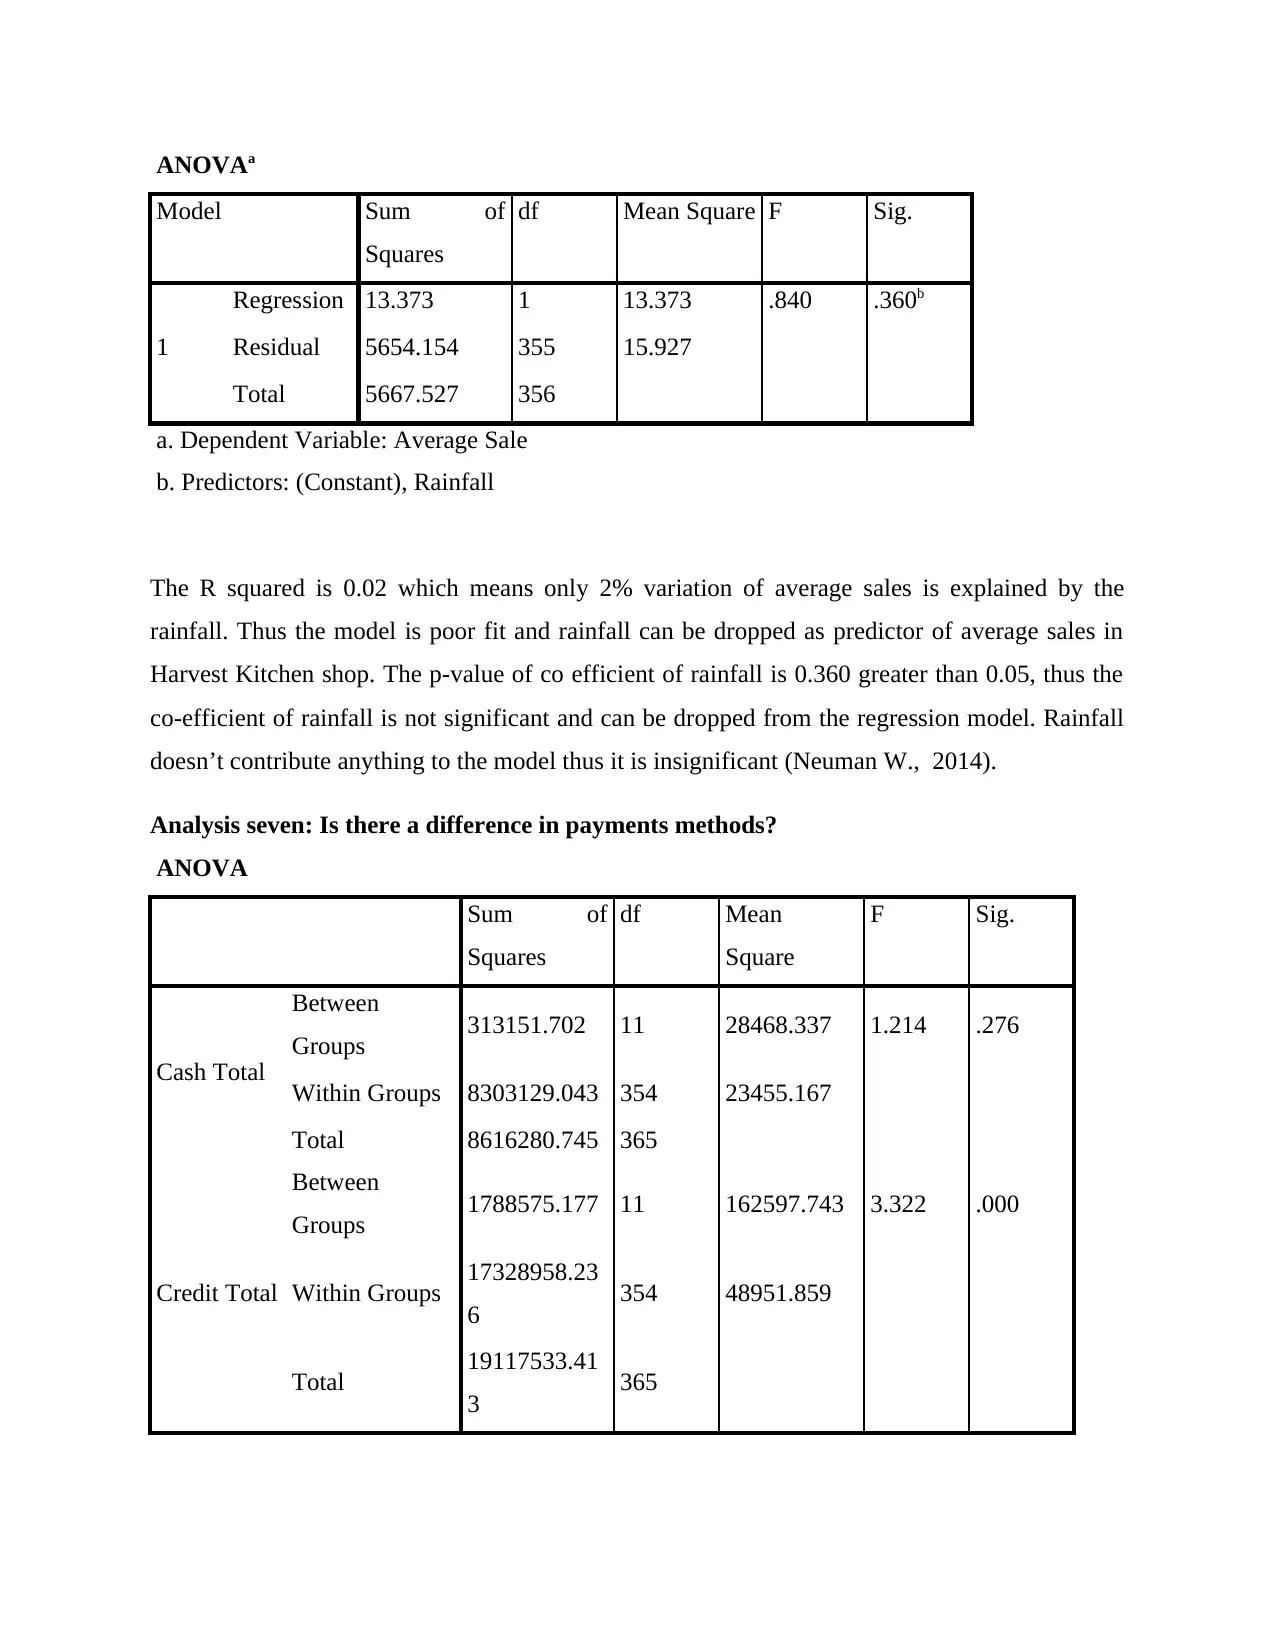
The Harvest Kitchen shop report analyzes the performance of an organic food shop, focusing on sales, profit, and customer behavior. The report uses data from the first financial year to address key business questions, including identifying top-selling products, assessing the impact of product location on sales and profit, and examining the influence of seasonality and rainfall. The analysis utilizes inferential statistics like regression, ANOVA, and correlation to derive insights. The findings reveal that water, fruits, and vegetables are the best-selling products, and product location significantly affects profit. Gross profits vary across months, but sales are not affected by seasons or rainfall. The report concludes with recommendations for maximizing profit, emphasizing the importance of product placement and focusing on best-selling items. The report also includes references to relevant academic sources.

Harvest Kitchen shop Report
Course Name…………………………………………………..
School ……………………………………………………
Department…………………………………………….
Lecturer name…………………………………………………..
Task Name……………………………………………………
Date………………………………………………………………
Course Name…………………………………………………..
School ……………………………………………………
Department…………………………………………….
Lecturer name…………………………………………………..
Task Name……………………………………………………
Date………………………………………………………………
Paraphrase This Document
Need a fresh take? Get an instant paraphrase of this document with our AI Paraphraser

Introduction
Good Harvest is organic food growing company, which is dedicated to feed the society
with healthy food. It has a shop at Sunshine Coast by the name Harvest Kitchen which
sells food to residents. Good Harvest ids divided in wholesale, retail, box delivery and
Harvest Kitchen. The shop has been in operation for one year and is second year. Major
challenges facing start up business are inadequate human capital and finances (The
Queensland University, 2017). With the high coast of organic goods, lack of adequate
finances may lead to closure of a business. The main challenges facing Harvest Kitchen
are lack of enough finances, high coast of good and low number of sales. It is therefore
necessary to predict future sales and to identify the best selling commodities (Good
Harvest, 2017). Currently the business has six employees, one delivery van, a retail outlet
and a cold store warehouse.
Definition of problem and necessary business intelligence
Data obtained from first financial year were used in analysis. The study utilized inferential
statistics such as regression analysis, test of hypothesis, analysis of variance and correlation to
answer business problem. Descriptive statistics and data presentation method were used to
describe the distribution of variable of interest (Desaro S., 2011). In particular:
Which are the top selling products?
Does location of product on shelf affect the profit and sales?
Do gross profits differ between different months of the year?
Does number of sales differ between different months of the year?
How is sale performance between different seasons?
How does rainfall affect profits?
Does rainfall affect sales?
Analytics methods and technical analysis
Appropriate business analytic methods were used to address business problems under
investigation. The variable on data set was checked if they were properly scaled. There were no
missing cases in all variables. Ordinal variable were weekday, month, seasons and date and the
rest variables were scale variable. Below is screenshot of data used in analysis of this report.

The nets sales of products were normally distributed. There were no outliers that very high
number of sales or too low number of sales in the data. The actual number of sales did not vary
much with mean net sales; the standard deviation of mean net sales was small. The mean net
sales were not significance different in different seasons of the year. Below is box plot of mean
net sales in different season of year.
⊘ This is a preview!⊘
Do you want full access?
Subscribe today to unlock all pages.

Trusted by 1+ million students worldwide

Analysis one: Which are the top selling products?
A bar graph of mean total sales of different products showed that the highest were water, fruits
and vegetables. Water, vegetables and fruits have nutritional value and increase immunity of the
body. The worst selling products include juicing, spices, snacks and herbal teas. The customers
of Harvest Kitchen prefer organic products. Customers indicate to avoid citric acid products
despite them being organic.
Paraphrase This Document
Need a fresh take? Get an instant paraphrase of this document with our AI Paraphraser

Analysis two: Does location of product on shelf affect the profit and sales?
The distribution of location of product is not inform large amount product are located to left and
right of the shop as compared to front and outside front. . The products found at outside front
this place had a mean profit of $1809.63 while those located at left of the shop had lowest mean
profit of $99.55. The location of product affects number of sales and average profit of that
product.
Analysis three: Do gross profits differ between different months of the year
ANOVA
Profit Total
Sum of
Squares
df Mean Square F Sig.
Between
Groups 35370.948 11 3215.541 3.867 .000
Within Groups 294370.006 354 831.554
Total 329740.954 365

The p-value is small we reject null hypothesis which states that there is difference in gross profit
between different months of year. We conclude that the gross profits between different months
are statistically significance. The gross monthly profit is not the same for all months some may
have slight. As shown by the box plot below.
Analysis four: Does number of sales differ between different months of the year?
ANOVA
Gross_Sales
Sum of
Squares
df Mean Square F Sig.
Between
Groups 1508892.474 11 137172.043 1.300 .222
Within Groups 37349615.45
5 354 105507.388
Total 38858507.92
9 365
The p-value is large we fail to reject null hypothesis and conclude that the gross sales in different
months is statistically insignificance. The mean gross sale of January does not differ much with
rest of months.
⊘ This is a preview!⊘
Do you want full access?
Subscribe today to unlock all pages.

Trusted by 1+ million students worldwide

Analysis five: How is sale performance between different seasons?
The gross sales in different seasons are the same. The gross sales in winter, autumn, summer and
spring does not differ significantly. Season did not affect the amount of product sold in Harvest
Kitchen shop.
ANOVA
Gross_Sales
Sum of
Squares
df Mean Square F Sig.
Between
Groups 560240.410 3 186746.803 1.765 .153
Within Groups 38298267.52
0 362 105796.319
Total 38858507.92
9 365
Paraphrase This Document
Need a fresh take? Get an instant paraphrase of this document with our AI Paraphraser

The p-value is large therefore gross sales between different seasons does not differ. The means
sales of different seasons are almost the same. Turkey multiple tests shows that the p-values of
interaction between different are greater than the level of significance (5%), this shows that there
is no statistical significance mean gross sales between different seasons.
Multiple Comparisons
Dependent Variable: Gross_Sales
Tukey HSD
(I) Season of the
year
(J) Season of the
year
Mean
Difference (I-
J)
Std. Error Sig. 95% Confidence Interval
Lower
Bound
Upper Bound
Summer
Autumn -22.938 48.089 .964 -147.06 101.18
Winter 58.785 48.089 .613 -65.33 182.90
Spring -46.442 48.220 .770 -170.90 78.02
Autumn
Summer 22.938 48.089 .964 -101.18 147.06
Winter 81.723 47.957 .323 -42.06 205.50
Spring -23.504 48.089 .962 -147.62 100.61
Winter
Summer -58.785 48.089 .613 -182.90 65.33
Autumn -81.723 47.957 .323 -205.50 42.06
Spring -105.226 48.089 .128 -229.34 18.89
Spring Summer 46.442 48.220 .770 -78.02 170.90
Autumn 23.504 48.089 .962 -100.61 147.62

Winter 105.226 48.089 .128 -18.89 229.34
Analysis six: Does rainfall affect sales?
There is weak negative linear relationship between amount of rainfall and gross sales. This
implies that as rainfall increases there is slight decline in amount of sales and vice versa.
Model Summary
Model R R Square Adjusted R
Square
Std. Error of
the Estimate
1 .049a .002 .000 3.991
a. Predictors: (Constant), Rainfall
⊘ This is a preview!⊘
Do you want full access?
Subscribe today to unlock all pages.

Trusted by 1+ million students worldwide

ANOVAa
Model Sum of
Squares
df Mean Square F Sig.
1
Regression 13.373 1 13.373 .840 .360b
Residual 5654.154 355 15.927
Total 5667.527 356
a. Dependent Variable: Average Sale
b. Predictors: (Constant), Rainfall
The R squared is 0.02 which means only 2% variation of average sales is explained by the
rainfall. Thus the model is poor fit and rainfall can be dropped as predictor of average sales in
Harvest Kitchen shop. The p-value of co efficient of rainfall is 0.360 greater than 0.05, thus the
co-efficient of rainfall is not significant and can be dropped from the regression model. Rainfall
doesn’t contribute anything to the model thus it is insignificant (Neuman W., 2014).
Analysis seven: Is there a difference in payments methods?
ANOVA
Sum of
Squares
df Mean
Square
F Sig.
Cash Total
Between
Groups 313151.702 11 28468.337 1.214 .276
Within Groups 8303129.043 354 23455.167
Total 8616280.745 365
Credit Total
Between
Groups 1788575.177 11 162597.743 3.322 .000
Within Groups 17328958.23
6 354 48951.859
Total 19117533.41
3 365
Paraphrase This Document
Need a fresh take? Get an instant paraphrase of this document with our AI Paraphraser

The p-value of cash payments in different months is 0.276 and there no is statistical significance
difference of mean sale by cash. Those customers who bought products in cash did it
consistently. The p-value of credit sale is 0.00 which suggest statistical difference between more
than two mean sales by credit in different month. Some customers bought by credit in one month
and in cash in another month.
Results
The following were deduced from the analysis:
1. The most selling commodities are water, fruit and vegetable sin Sunshine Coast. Most of
people prefer to buy organic foods. The worst selling is snacks and juices, customer are
not willing to buy junk foods as they term them less healthy.
2. The location of product of in the shop is not uniform. Majority of the products are found
on left and right of the shop and few of the products on front and outside front of the
shop. The location of products affect profit, those commodities found on outside front
and front of the shop are the best selling products resulting to higher profits as compared
to those in rear, left or right of the shop.
3. Gross profit in different months is statistically insignificance. The gross profit between
different months is not the same, it differ this suggest the value or prices of the
commodities sold in different months are not the same.
4. Gross sale between different seasons and gross sale between different months of year is
statistically insignificance. Sales are not affected by months or season. Therefore it is
necessary to know the location of best selling commodity and the best selling
commodities to maximize profit.
5. Rainfalls do no affect sales, although there is negative linear relationship between sales
and rainfall.
6. Mean sales by cash are not different, they are the same. The mean sales by credit card
differ significantly. More than one means sale are different.
‘

References
Alderman A. & Salem B. (2010). Survey design. Plastic Reconstruction Surgery, vol 4, pg 9.
The University of Queensland (2017). Business Management and Finance [online] Retrieved
from www.ua.edu.au/research.
Fisher R.A. 1925. Methods For Research Work; Macmillan Publishers: London.
Good Harvest (2015) Harvest Kitchen [online]http://www.goodharvest.com.au
Kothari, C. R, (2004), Research Methodology Methods and Techniques New Age International
(P) Limited, Publishers New Delhi
Neuman, W. L. (2014). Social Research Methods: Qualitative and Quantitative Approaches, 7th
Edition. Pearson Education Limited: UK.
Perry, J. & Perry, E. (2014). Contemporary Society: An Introduction to Social Science, 12th
Edition. Pearson Education, Inc.: Singapore
⊘ This is a preview!⊘
Do you want full access?
Subscribe today to unlock all pages.

Trusted by 1+ million students worldwide
1 out of 12
Related Documents

Your All-in-One AI-Powered Toolkit for Academic Success.
+13062052269
info@desklib.com
Available 24*7 on WhatsApp / Email
Unlock your academic potential
Copyright © 2020–2025 A2Z Services. All Rights Reserved. Developed and managed by ZUCOL.