Comprehensive Financial Analysis and Investment Appraisal Report
VerifiedAdded on 2020/09/03
|23
|5220
|56
Report
AI Summary
This report undertakes a comprehensive financial analysis of Harvey Homes Plc, dissecting its financial statements, including the statement of profit or loss, financial position, and cash flow statement. The analysis employs ratio analysis to evaluate profitability (gross margin, net margin, ROCE), liquidity (current and quick ratios), and solvency (debt ratio). The report also delves into market segment analysis, assessing the performance of different segments of the company. Furthermore, it explores investment appraisal techniques, such as payback period, accounting rate of return (ARR), and net present value (NPV), along with the consideration of non-financial factors. The findings highlight the company's financial performance, liquidity, and areas for improvement, providing insights into financial decision-making and investment strategies. The report includes illustrations, tables, and appendices to support the analysis.
FINANCIAL DECISION
MAKING
MAKING
Paraphrase This Document
Need a fresh take? Get an instant paraphrase of this document with our AI Paraphraser
Table of Contents
EXECUTIVE SUMMARY.............................................................................................................1
PART 1............................................................................................................................................1
Analysing the statement of profit or loss................................................................................1
Financial position analysis.....................................................................................................5
Analysis of cash flow statement.............................................................................................9
Market Segment Analysis.....................................................................................................10
PART 2: INVESTMENT APPRAISAL........................................................................................12
Management forecast ...........................................................................................................12
Techniques of investment appraisal ....................................................................................12
Payback period ................................................................................................................12
Accounting/Average rate of return (ARR) .....................................................................13
Net present value..................................................................................................................13
Non-financial factors ...........................................................................................................14
APPENDIX....................................................................................................................................18
Illustration Index
Illustration 1: Comparison of gross profit and net sales..................................................................2
Illustration 2: Comparison of operating profits and revenue..........................................................3
Illustration 3: Comparison of operating profits and capital employed............................................4
Illustration 4: Current ratio of Harvey Homes Plc...........................................................................6
Illustration 5: Quick ratio of Harvey Homes Plc.............................................................................7
Illustration 6: Debt ratio of the Harvey Homes Plc.........................................................................8
Illustration 7: Cash flow from operating, investing and financing activities...................................9
Illustration 8: Comparison of Cash Conversion Cycle..................................................................10
Illustration 9: Comparison of the company's different segments..................................................11
Index of Tables
Table 1: Ratio analysis for profit and loss statement.....................................................................18
Table 2: Calculation of Capital employed.....................................................................................18
Table 3: Cash flow from operating, investing and financing activities.........................................19
Table 4: Calculation of DIO, DSO and DPO.................................................................................19
⊘ This is a preview!⊘
Do you want full access?
Subscribe today to unlock all pages.
Trusted by 1+ million students worldwide
EXECUTIVE SUMMARY
Analysing the financial statements of the entity helps in better decision making. It is
helpful in comparative analysis of sales, profits, assets etc (Allen, Larson and Sloan, 2013).
Harvey homes is a company which is involved in creating quality homes. Ratio analysis
technique have been used to analyse the financial statement of the company. Capital
budgeting technique have been used to assess that whether the project will prove to be
profitable for the company or not. The key findings suggest that current ratio of the company
is on higher side as compared to the ideal one which shows that the entity is not optimally
utilizing its resources available with it. Further, it has taken long term loan for 150 million in
order to meet its expenses as Harvey is not generating much operating cash in order to meet
out its needs. Midlands in not generating high revenues where the entity is advised to
improve its product mix and marketing strategy for better profits in near future. Moreover,
some financial and non-financial factors have been discussed which the enterprise should
consider while expanding in other country.
PART 1
Analysing the statement of profit or loss
Gross margin ratio
1
Paraphrase This Document
Need a fresh take? Get an instant paraphrase of this document with our AI Paraphraser
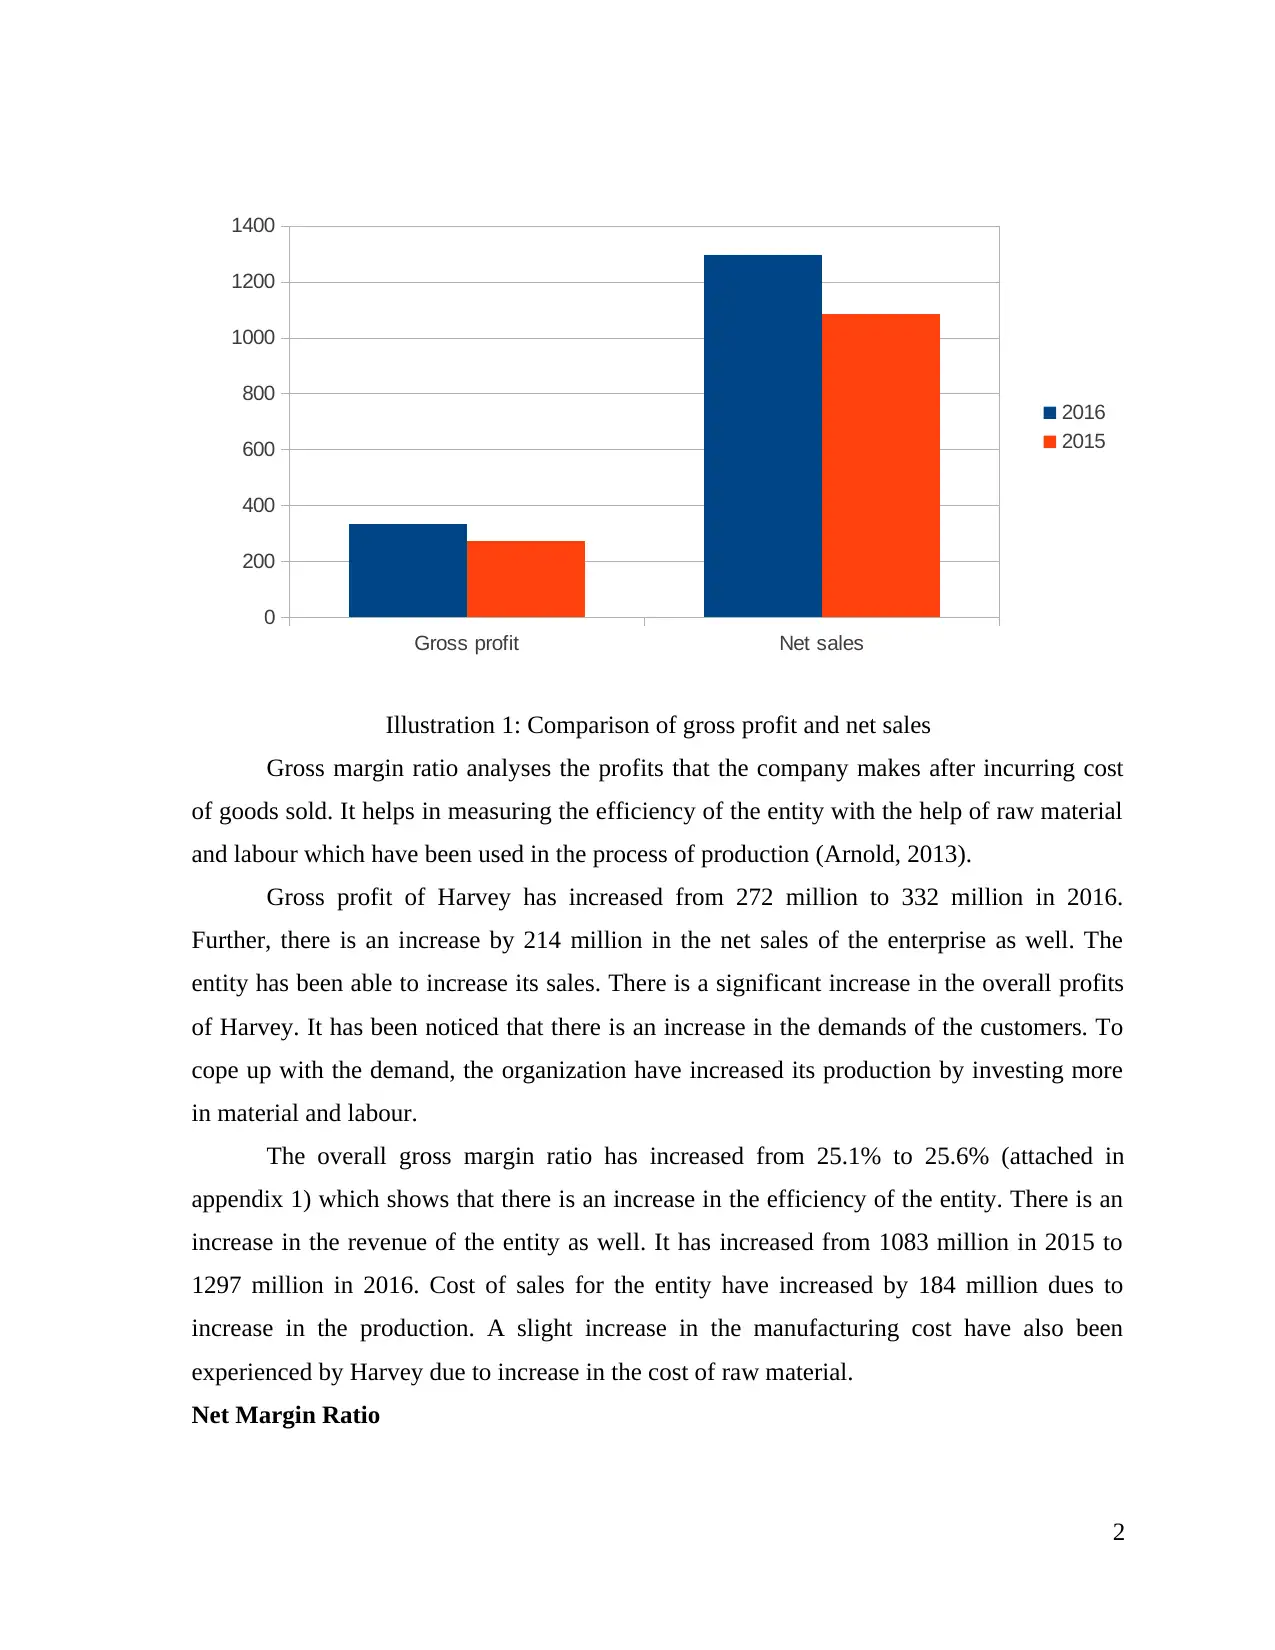
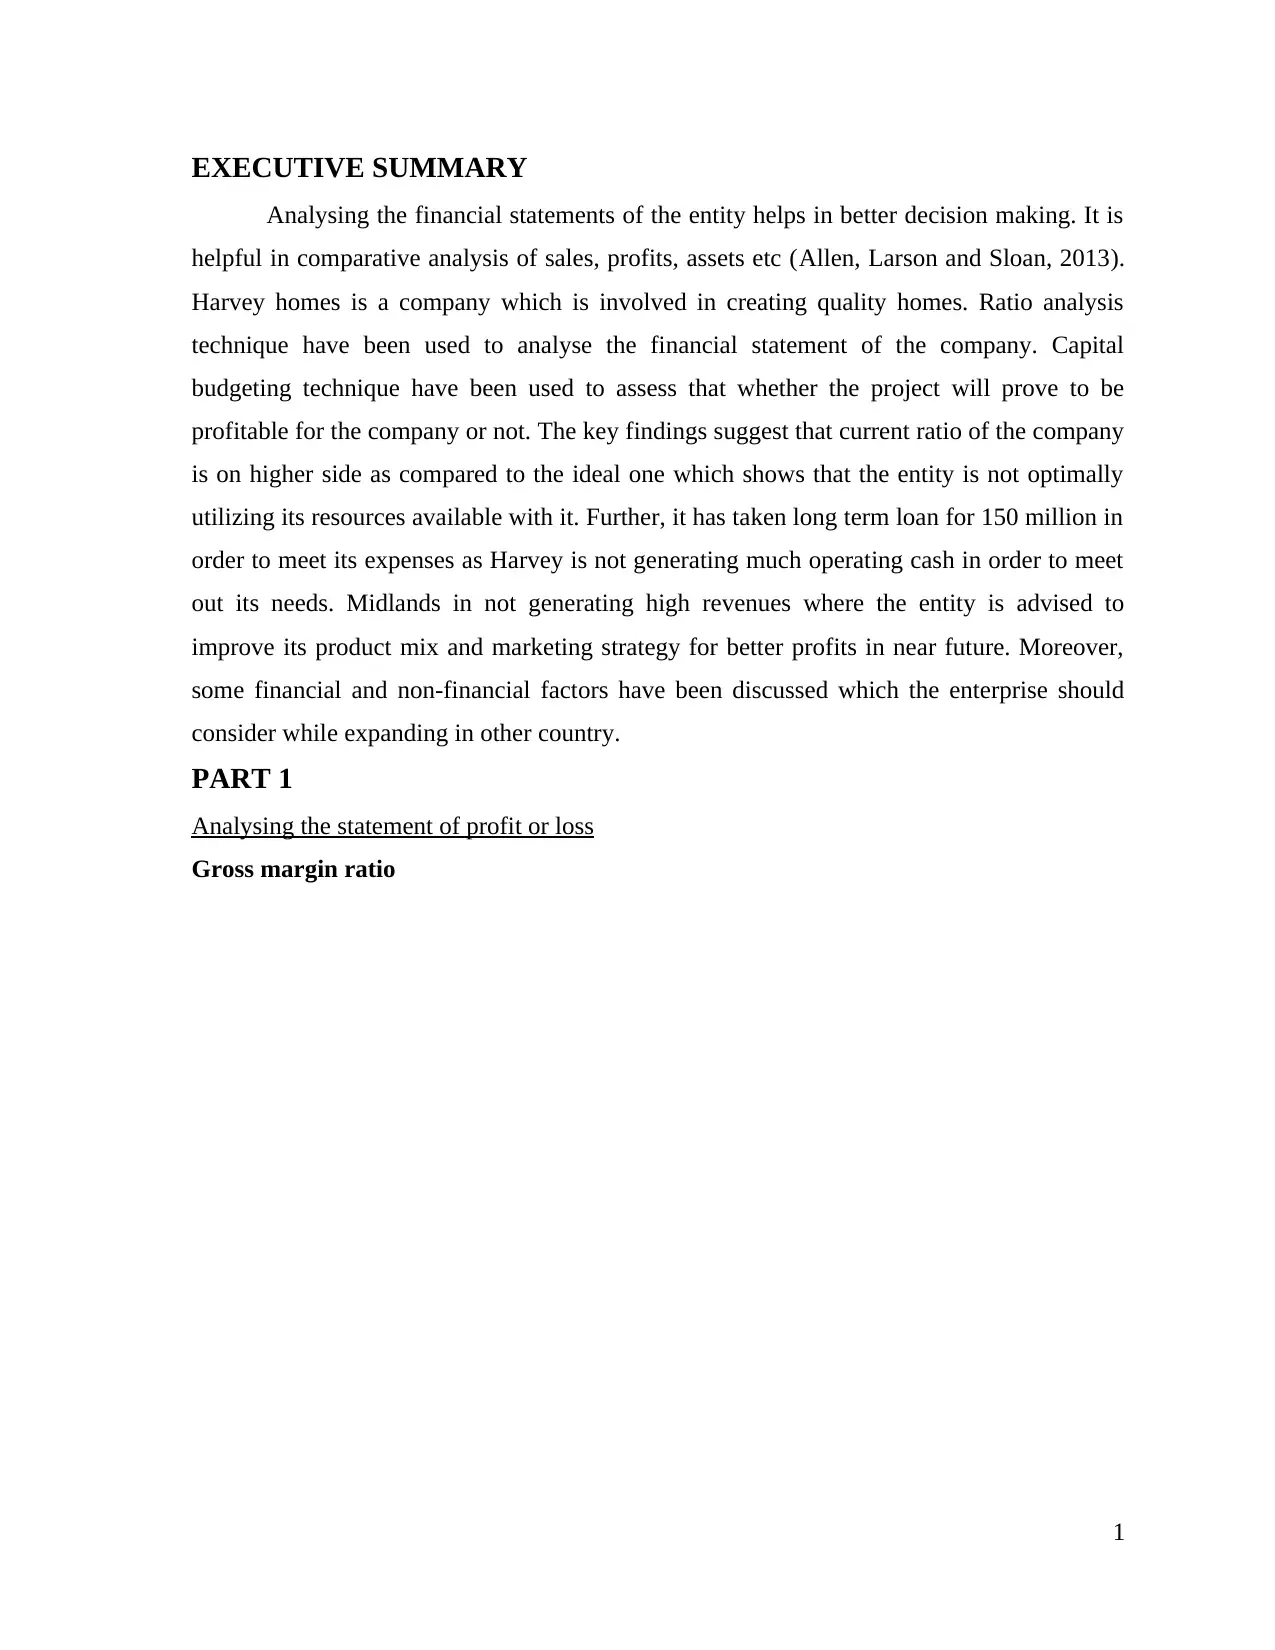
Gross margin ratio analyses the profits that the company makes after incurring cost
of goods sold. It helps in measuring the efficiency of the entity with the help of raw material
and labour which have been used in the process of production (Arnold, 2013).
Gross profit of Harvey has increased from 272 million to 332 million in 2016.
Further, there is an increase by 214 million in the net sales of the enterprise as well. The
entity has been able to increase its sales. There is a significant increase in the overall profits
of Harvey. It has been noticed that there is an increase in the demands of the customers. To
cope up with the demand, the organization have increased its production by investing more
in material and labour.
The overall gross margin ratio has increased from 25.1% to 25.6% (attached in
appendix 1) which shows that there is an increase in the efficiency of the entity. There is an
increase in the revenue of the entity as well. It has increased from 1083 million in 2015 to
1297 million in 2016. Cost of sales for the entity have increased by 184 million dues to
increase in the production. A slight increase in the manufacturing cost have also been
experienced by Harvey due to increase in the cost of raw material.
Net Margin Ratio
2
Gross profit Net sales
0
200
400
600
800
1000
1200
1400
2016
2015
Illustration 1: Comparison of gross profit and net sales
Operating profits Revenue
0
200
400
600
800
1000
1200
1400
2016
2015
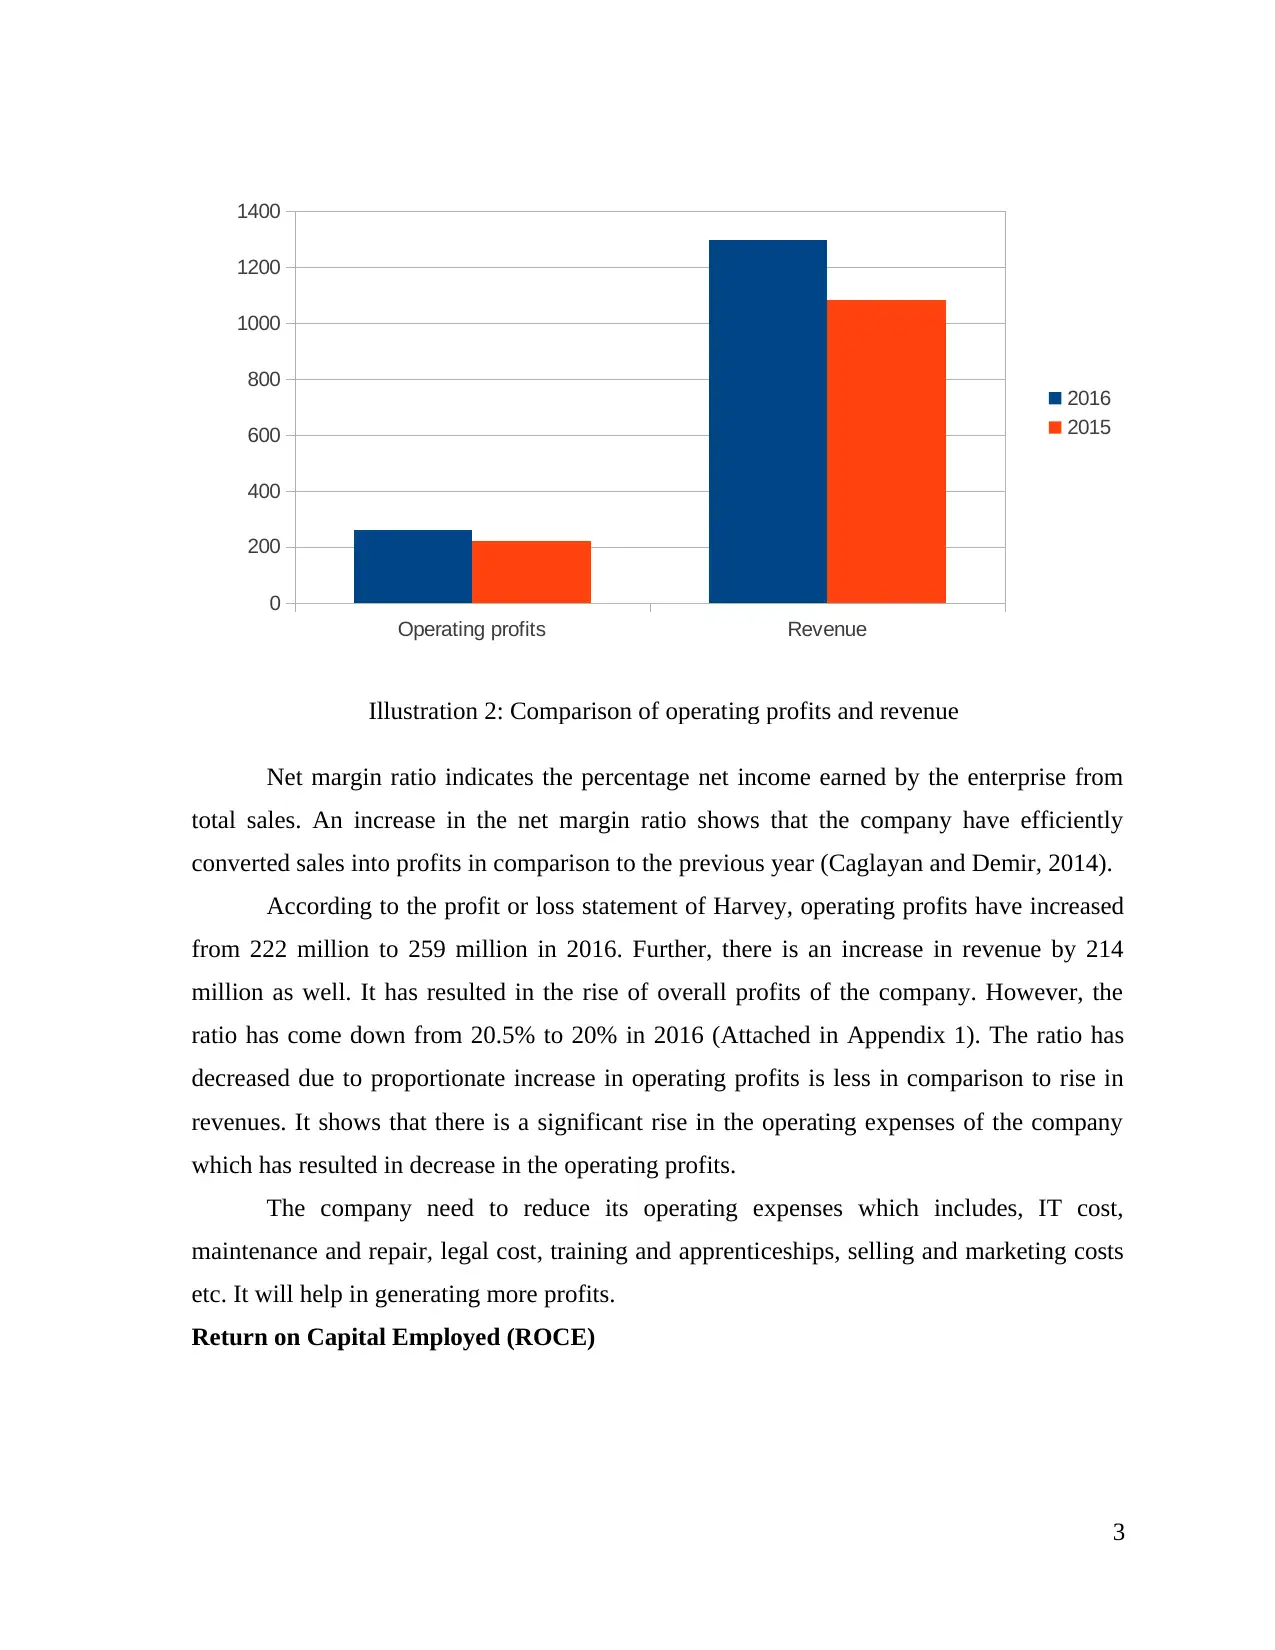
Illustration 2: Comparison of operating profits and revenue
Net margin ratio indicates the percentage net income earned by the enterprise from
total sales. An increase in the net margin ratio shows that the company have efficiently
converted sales into profits in comparison to the previous year (Caglayan and Demir, 2014).
According to the profit or loss statement of Harvey, operating profits have increased
from 222 million to 259 million in 2016. Further, there is an increase in revenue by 214
million as well. It has resulted in the rise of overall profits of the company. However, the
ratio has come down from 20.5% to 20% in 2016 (Attached in Appendix 1). The ratio has
decreased due to proportionate increase in operating profits is less in comparison to rise in
revenues. It shows that there is a significant rise in the operating expenses of the company
which has resulted in decrease in the operating profits.
The company need to reduce its operating expenses which includes, IT cost,
maintenance and repair, legal cost, training and apprenticeships, selling and marketing costs
etc. It will help in generating more profits.
Return on Capital Employed (ROCE)
3
0
200
400
600
800
1000
1200
1400
2016
2015
Illustration 2: Comparison of operating profits and revenue
Net margin ratio indicates the percentage net income earned by the enterprise from
total sales. An increase in the net margin ratio shows that the company have efficiently
converted sales into profits in comparison to the previous year (Caglayan and Demir, 2014).
According to the profit or loss statement of Harvey, operating profits have increased
from 222 million to 259 million in 2016. Further, there is an increase in revenue by 214
million as well. It has resulted in the rise of overall profits of the company. However, the
ratio has come down from 20.5% to 20% in 2016 (Attached in Appendix 1). The ratio has
decreased due to proportionate increase in operating profits is less in comparison to rise in
revenues. It shows that there is a significant rise in the operating expenses of the company
which has resulted in decrease in the operating profits.
The company need to reduce its operating expenses which includes, IT cost,
maintenance and repair, legal cost, training and apprenticeships, selling and marketing costs
etc. It will help in generating more profits.
Return on Capital Employed (ROCE)
3
⊘ This is a preview!⊘
Do you want full access?
Subscribe today to unlock all pages.
Trusted by 1+ million students worldwide
Operating profits Capital employed
0
200
400
600
800
1000
1200
1400
1600
2016
2015
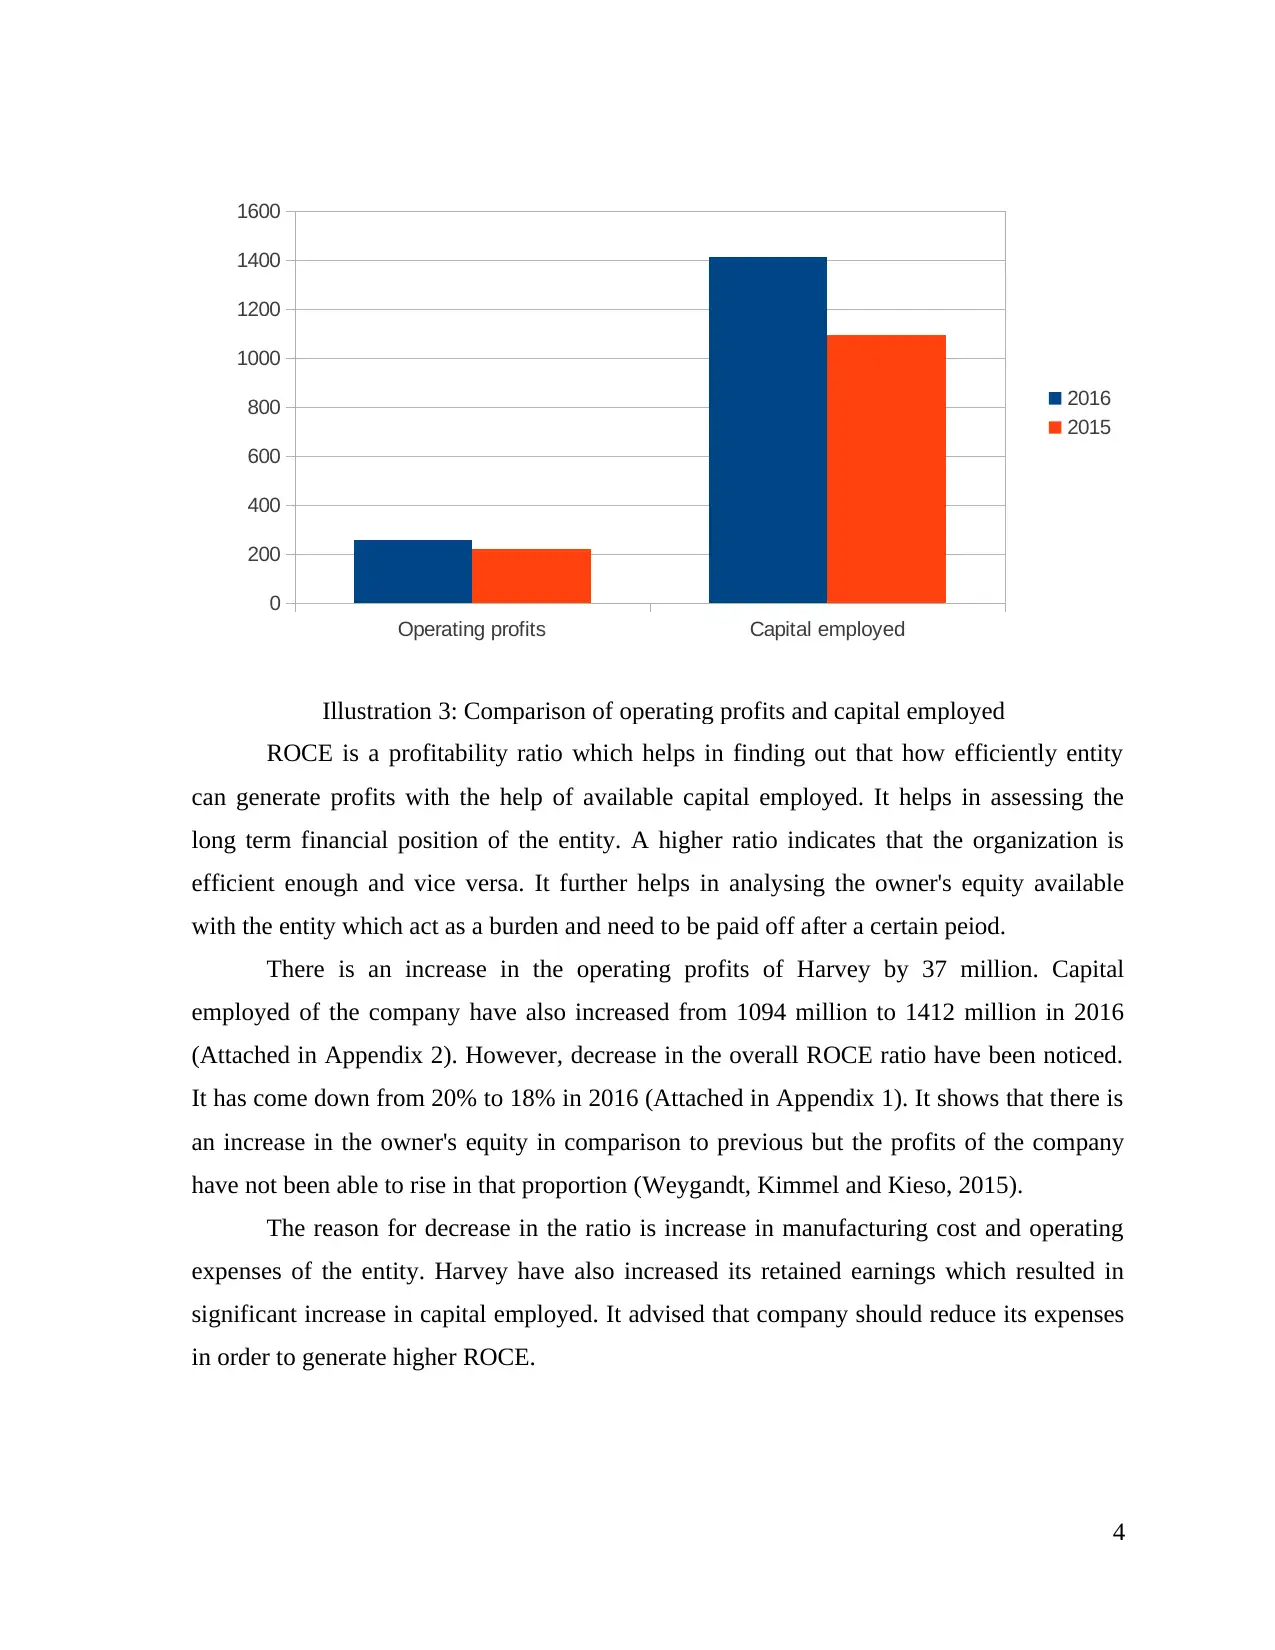
Illustration 3: Comparison of operating profits and capital employed
ROCE is a profitability ratio which helps in finding out that how efficiently entity
can generate profits with the help of available capital employed. It helps in assessing the
long term financial position of the entity. A higher ratio indicates that the organization is
efficient enough and vice versa. It further helps in analysing the owner's equity available
with the entity which act as a burden and need to be paid off after a certain peiod.
There is an increase in the operating profits of Harvey by 37 million. Capital
employed of the company have also increased from 1094 million to 1412 million in 2016
(Attached in Appendix 2). However, decrease in the overall ROCE ratio have been noticed.
It has come down from 20% to 18% in 2016 (Attached in Appendix 1). It shows that there is
an increase in the owner's equity in comparison to previous but the profits of the company
have not been able to rise in that proportion (Weygandt, Kimmel and Kieso, 2015).
The reason for decrease in the ratio is increase in manufacturing cost and operating
expenses of the entity. Harvey have also increased its retained earnings which resulted in
significant increase in capital employed. It advised that company should reduce its expenses
in order to generate higher ROCE.
4
0
200
400
600
800
1000
1200
1400
1600
2016
2015
Illustration 3: Comparison of operating profits and capital employed
ROCE is a profitability ratio which helps in finding out that how efficiently entity
can generate profits with the help of available capital employed. It helps in assessing the
long term financial position of the entity. A higher ratio indicates that the organization is
efficient enough and vice versa. It further helps in analysing the owner's equity available
with the entity which act as a burden and need to be paid off after a certain peiod.
There is an increase in the operating profits of Harvey by 37 million. Capital
employed of the company have also increased from 1094 million to 1412 million in 2016
(Attached in Appendix 2). However, decrease in the overall ROCE ratio have been noticed.
It has come down from 20% to 18% in 2016 (Attached in Appendix 1). It shows that there is
an increase in the owner's equity in comparison to previous but the profits of the company
have not been able to rise in that proportion (Weygandt, Kimmel and Kieso, 2015).
The reason for decrease in the ratio is increase in manufacturing cost and operating
expenses of the entity. Harvey have also increased its retained earnings which resulted in
significant increase in capital employed. It advised that company should reduce its expenses
in order to generate higher ROCE.
4
Paraphrase This Document
Need a fresh take? Get an instant paraphrase of this document with our AI Paraphraser
Financial position analysis
The financial position of the company is calculated of the basis of their assets and
liabilities as well as it also includes shareholders equity. To understand the value if the
venture, different investor looks at the organisation's financial position. It can be analysed by
evaluating the different financial ratio of the company. It is the mathematical comparison of
the financial statement categories and accounts. It helps the company's different stakeholders
such as their creditors, shareholders, investors, customers, suppliers as well as it helps the
organisation manage their company internally that how the business is performing and where
it need improvements. Financial ratios are the tool which is used to find the business
standing and if it is compared to past years, the firm can able to know that they are at the
growing stage or not (Caglayan and Demir, 2014). Different financial ratios are as follows:
Liquidity ratio
It helps the organisation to find that they are able to pay their both current liabilities
and their long-term liabilities which has further become the current liabilities. These ratios
communicate the cash level of the venture and how they can turn their recentre assets to pay
of their liabilities. It shows the ability of the organisation to easily convert their assets into
cash. It includes different ratio, that are as follows:
Current ratio: It shows the ability of the company to pay the current liabilities from their
current assets. Quick assets are that which is converted into cash within the 90 working days
such as cash, cash equivalents, marketable securities and short run investments. Formula for
calculating the current ratio is current assets by current liabilities.
Current ratio of Harvey Homes Plc
For 2015
1500+ 39+ 56/ 60+ 471+ 19 = 1595/500 = 3.19 :1
For 2016
1808+36+135/ 44+566+24 = 1979/634 = 2.9 :1
5
1 2
2.75
2.8
2.85
2.9
2.95
3
3.05
3.1
3.15
Current ratio
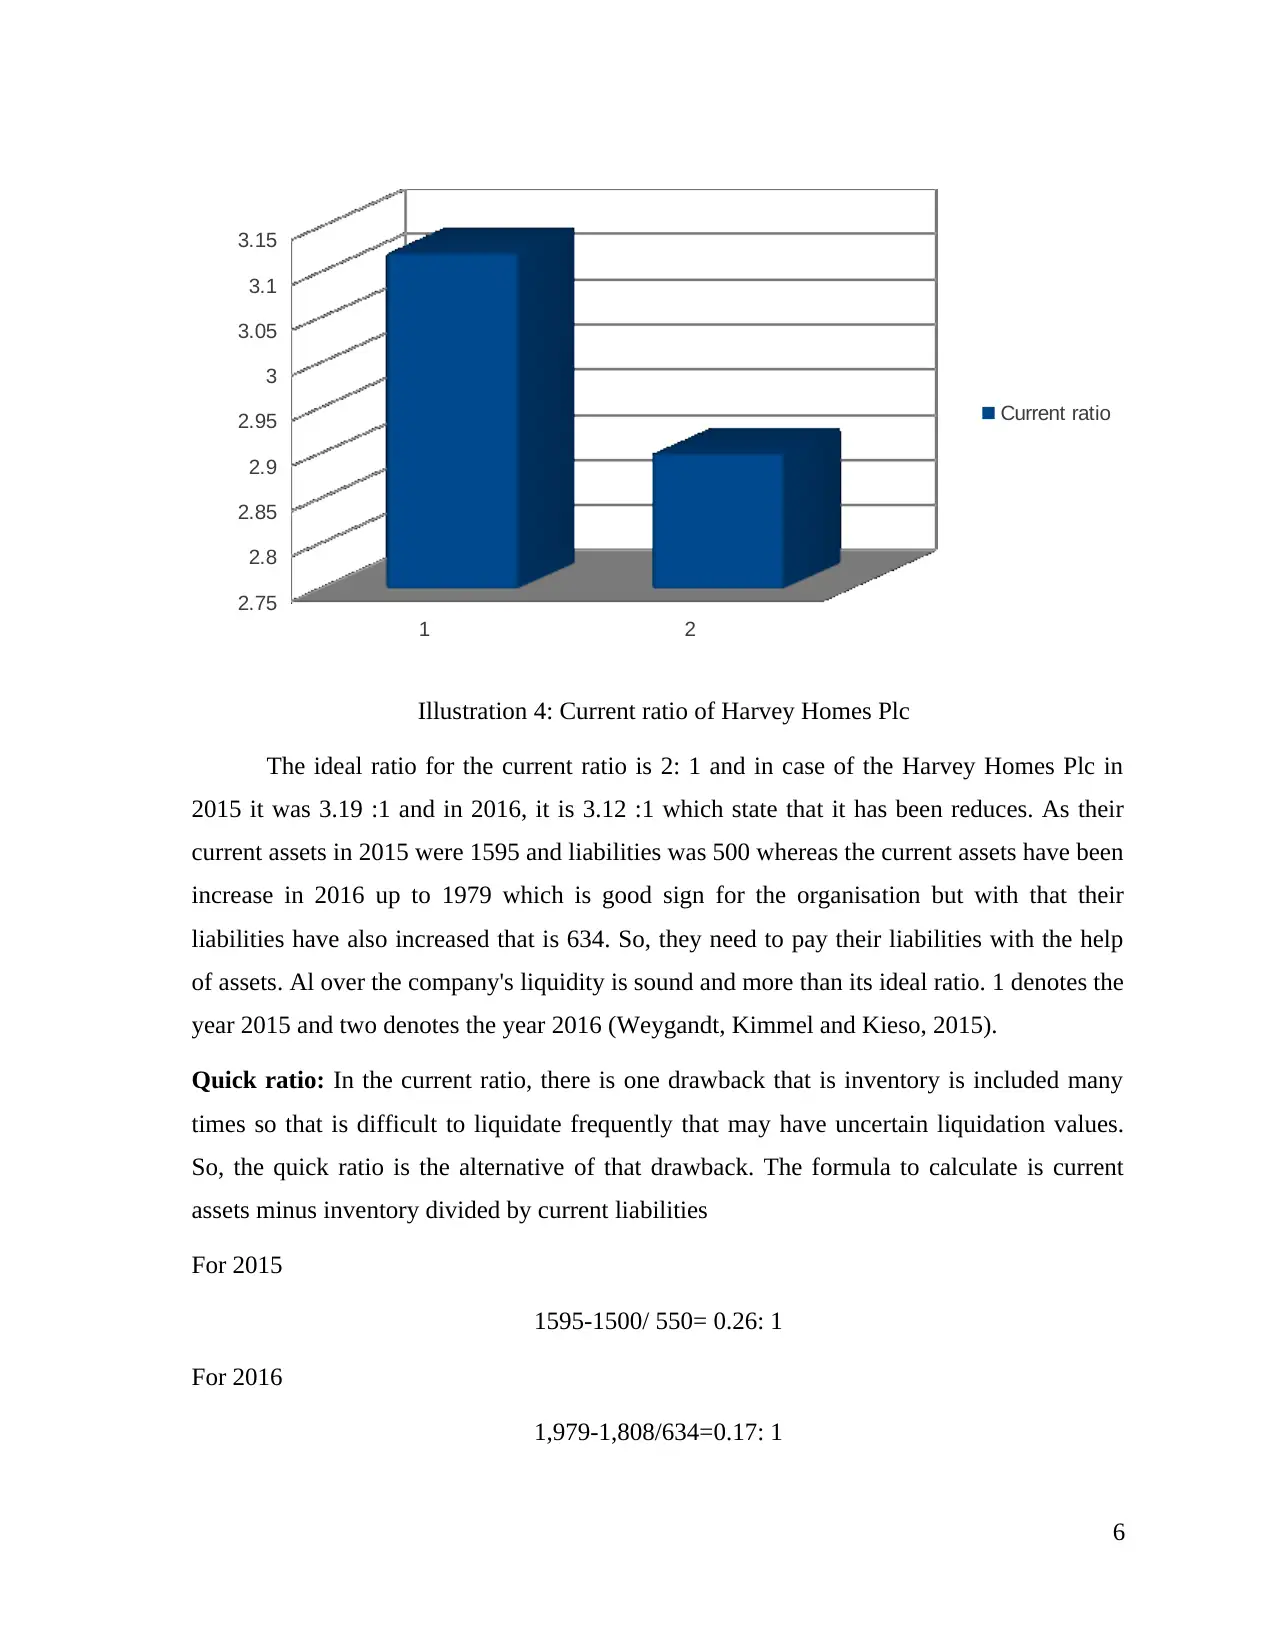
Illustration 4: Current ratio of Harvey Homes Plc
The ideal ratio for the current ratio is 2: 1 and in case of the Harvey Homes Plc in
2015 it was 3.19 :1 and in 2016, it is 3.12 :1 which state that it has been reduces. As their
current assets in 2015 were 1595 and liabilities was 500 whereas the current assets have been
increase in 2016 up to 1979 which is good sign for the organisation but with that their
liabilities have also increased that is 634. So, they need to pay their liabilities with the help
of assets. Al over the company's liquidity is sound and more than its ideal ratio. 1 denotes the
year 2015 and two denotes the year 2016 (Weygandt, Kimmel and Kieso, 2015).
Quick ratio: In the current ratio, there is one drawback that is inventory is included many
times so that is difficult to liquidate frequently that may have uncertain liquidation values.
So, the quick ratio is the alternative of that drawback. The formula to calculate is current
assets minus inventory divided by current liabilities
For 2015
1595-1500/ 550= 0.26: 1
For 2016
1,979-1,808/634=0.17: 1
6
2.75
2.8
2.85
2.9
2.95
3
3.05
3.1
3.15
Current ratio
Illustration 4: Current ratio of Harvey Homes Plc
The ideal ratio for the current ratio is 2: 1 and in case of the Harvey Homes Plc in
2015 it was 3.19 :1 and in 2016, it is 3.12 :1 which state that it has been reduces. As their
current assets in 2015 were 1595 and liabilities was 500 whereas the current assets have been
increase in 2016 up to 1979 which is good sign for the organisation but with that their
liabilities have also increased that is 634. So, they need to pay their liabilities with the help
of assets. Al over the company's liquidity is sound and more than its ideal ratio. 1 denotes the
year 2015 and two denotes the year 2016 (Weygandt, Kimmel and Kieso, 2015).
Quick ratio: In the current ratio, there is one drawback that is inventory is included many
times so that is difficult to liquidate frequently that may have uncertain liquidation values.
So, the quick ratio is the alternative of that drawback. The formula to calculate is current
assets minus inventory divided by current liabilities
For 2015
1595-1500/ 550= 0.26: 1
For 2016
1,979-1,808/634=0.17: 1
6
⊘ This is a preview!⊘
Do you want full access?
Subscribe today to unlock all pages.
Trusted by 1+ million students worldwide
1 2
0
0.05
0.1
0.15
0.2
0.25
0.3
Quick ratio
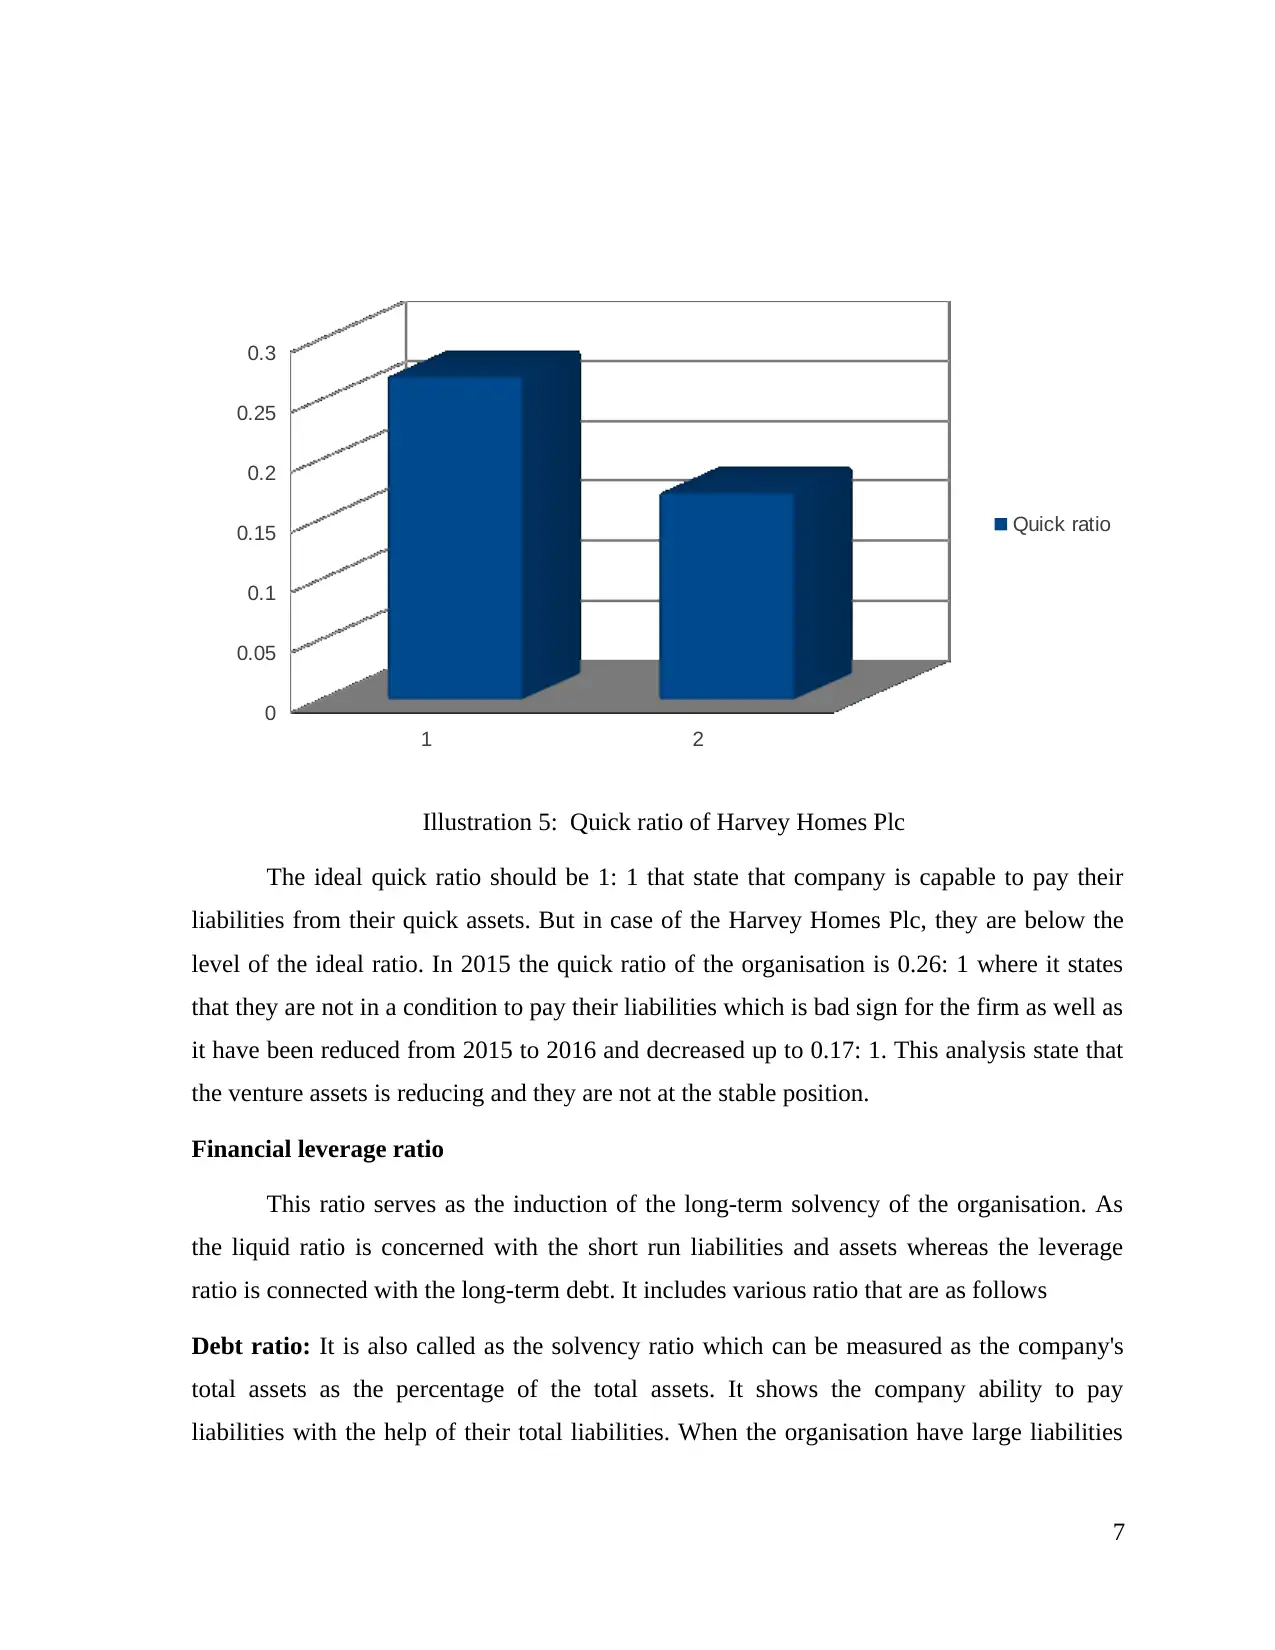
Illustration 5: Quick ratio of Harvey Homes Plc
The ideal quick ratio should be 1: 1 that state that company is capable to pay their
liabilities from their quick assets. But in case of the Harvey Homes Plc, they are below the
level of the ideal ratio. In 2015 the quick ratio of the organisation is 0.26: 1 where it states
that they are not in a condition to pay their liabilities which is bad sign for the firm as well as
it have been reduced from 2015 to 2016 and decreased up to 0.17: 1. This analysis state that
the venture assets is reducing and they are not at the stable position.
Financial leverage ratio
This ratio serves as the induction of the long-term solvency of the organisation. As
the liquid ratio is concerned with the short run liabilities and assets whereas the leverage
ratio is connected with the long-term debt. It includes various ratio that are as follows
Debt ratio: It is also called as the solvency ratio which can be measured as the company's
total assets as the percentage of the total assets. It shows the company ability to pay
liabilities with the help of their total liabilities. When the organisation have large liabilities
7
0
0.05
0.1
0.15
0.2
0.25
0.3
Quick ratio
Illustration 5: Quick ratio of Harvey Homes Plc
The ideal quick ratio should be 1: 1 that state that company is capable to pay their
liabilities from their quick assets. But in case of the Harvey Homes Plc, they are below the
level of the ideal ratio. In 2015 the quick ratio of the organisation is 0.26: 1 where it states
that they are not in a condition to pay their liabilities which is bad sign for the firm as well as
it have been reduced from 2015 to 2016 and decreased up to 0.17: 1. This analysis state that
the venture assets is reducing and they are not at the stable position.
Financial leverage ratio
This ratio serves as the induction of the long-term solvency of the organisation. As
the liquid ratio is concerned with the short run liabilities and assets whereas the leverage
ratio is connected with the long-term debt. It includes various ratio that are as follows
Debt ratio: It is also called as the solvency ratio which can be measured as the company's
total assets as the percentage of the total assets. It shows the company ability to pay
liabilities with the help of their total liabilities. When the organisation have large liabilities
7
Paraphrase This Document
Need a fresh take? Get an instant paraphrase of this document with our AI Paraphraser
over their assets that states that the company is at risk stage, it is calculated as the total debt/
total liabilities (Arnold, 2013).
Debt ratio of the Harvey Homes Plc
2015
1,644/795= 2.06: 1
2016
2046 /1,029= 1.98: 1
1 2
1.94
1.96
1.98
2
2.02
2.04
2.06
2.08
Debt ratio
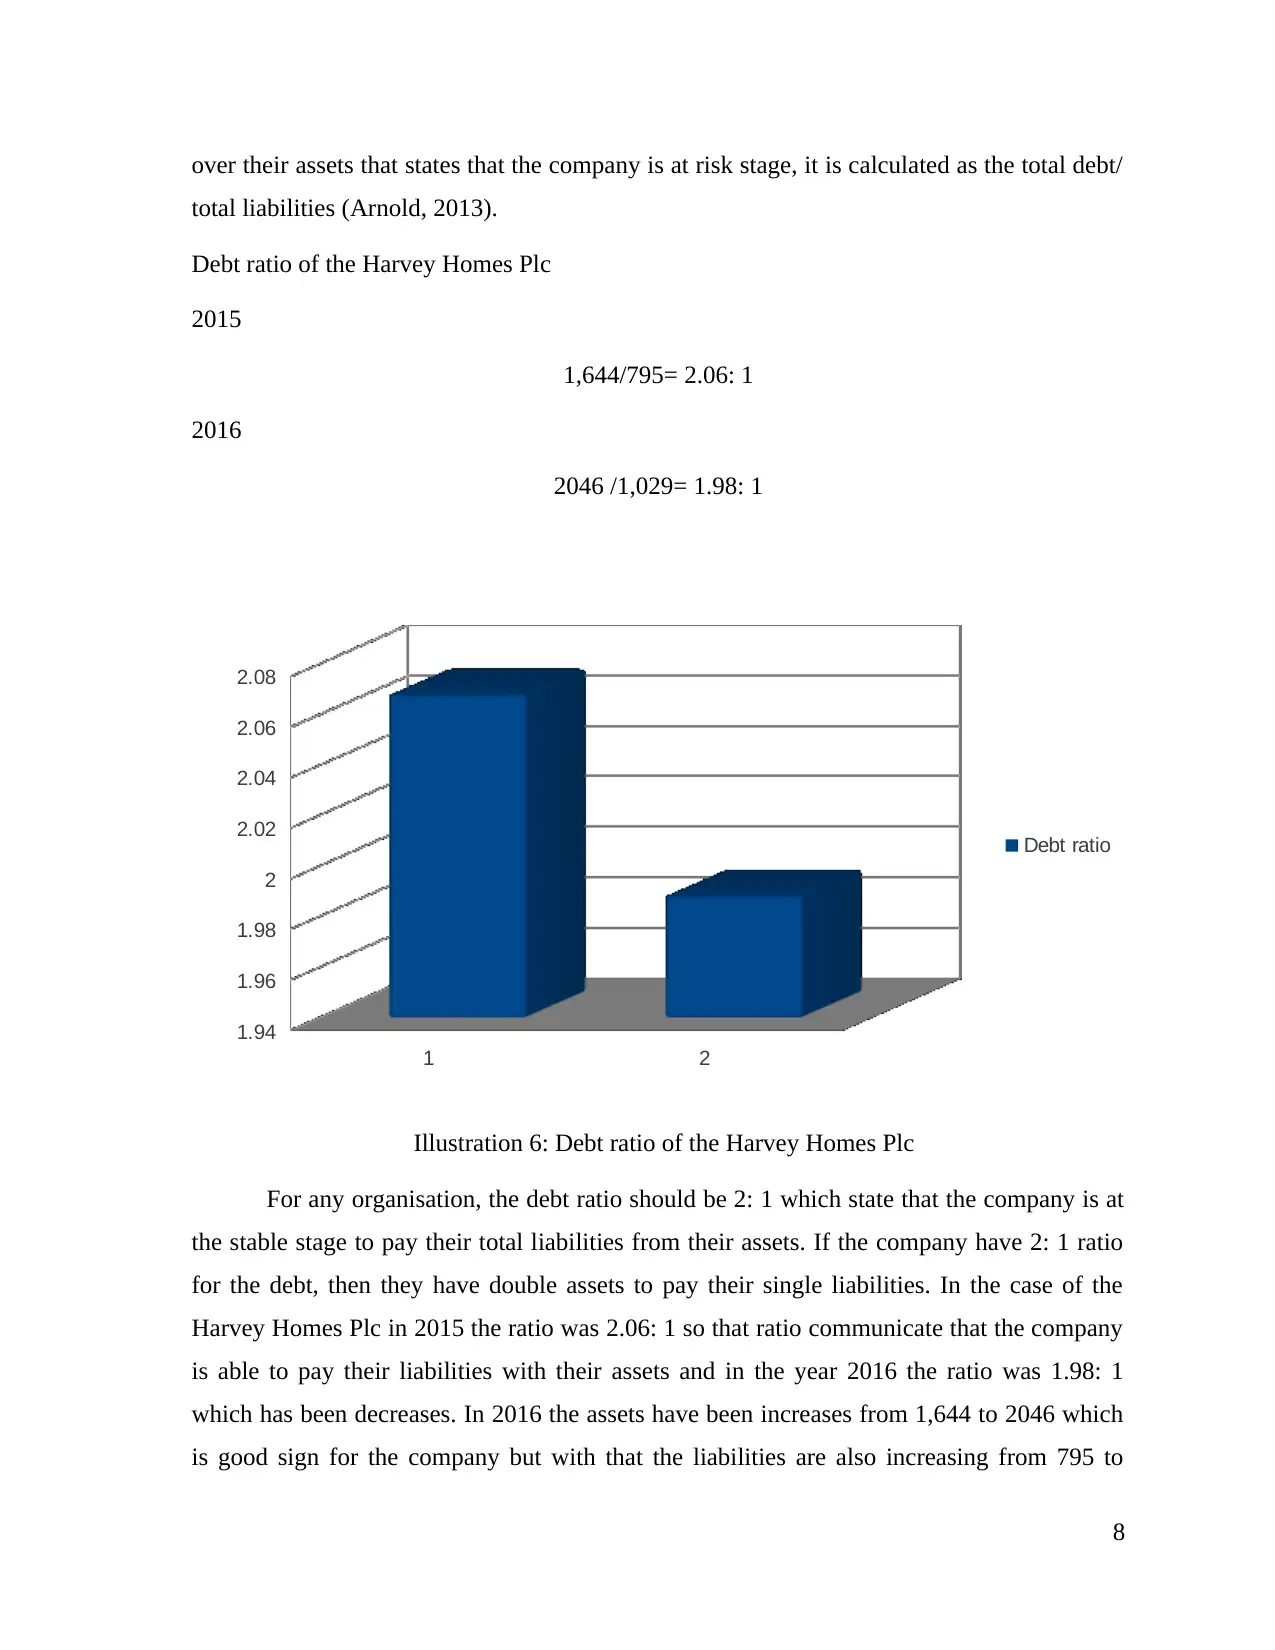
Illustration 6: Debt ratio of the Harvey Homes Plc
For any organisation, the debt ratio should be 2: 1 which state that the company is at
the stable stage to pay their total liabilities from their assets. If the company have 2: 1 ratio
for the debt, then they have double assets to pay their single liabilities. In the case of the
Harvey Homes Plc in 2015 the ratio was 2.06: 1 so that ratio communicate that the company
is able to pay their liabilities with their assets and in the year 2016 the ratio was 1.98: 1
which has been decreases. In 2016 the assets have been increases from 1,644 to 2046 which
is good sign for the company but with that the liabilities are also increasing from 795 to
8
total liabilities (Arnold, 2013).
Debt ratio of the Harvey Homes Plc
2015
1,644/795= 2.06: 1
2016
2046 /1,029= 1.98: 1
1 2
1.94
1.96
1.98
2
2.02
2.04
2.06
2.08
Debt ratio
Illustration 6: Debt ratio of the Harvey Homes Plc
For any organisation, the debt ratio should be 2: 1 which state that the company is at
the stable stage to pay their total liabilities from their assets. If the company have 2: 1 ratio
for the debt, then they have double assets to pay their single liabilities. In the case of the
Harvey Homes Plc in 2015 the ratio was 2.06: 1 so that ratio communicate that the company
is able to pay their liabilities with their assets and in the year 2016 the ratio was 1.98: 1
which has been decreases. In 2016 the assets have been increases from 1,644 to 2046 which
is good sign for the company but with that the liabilities are also increasing from 795 to
8
1,029. So, they need to make that organisation such sound that the can able to increase their
assets so that they can able to pay increasing liabilities.
Analysis of cash flow statement
Cash flow from operating activities
Cash flow from investing activities
Cash flow from financing activities
-50
0
50
100
150
200
Cash flows
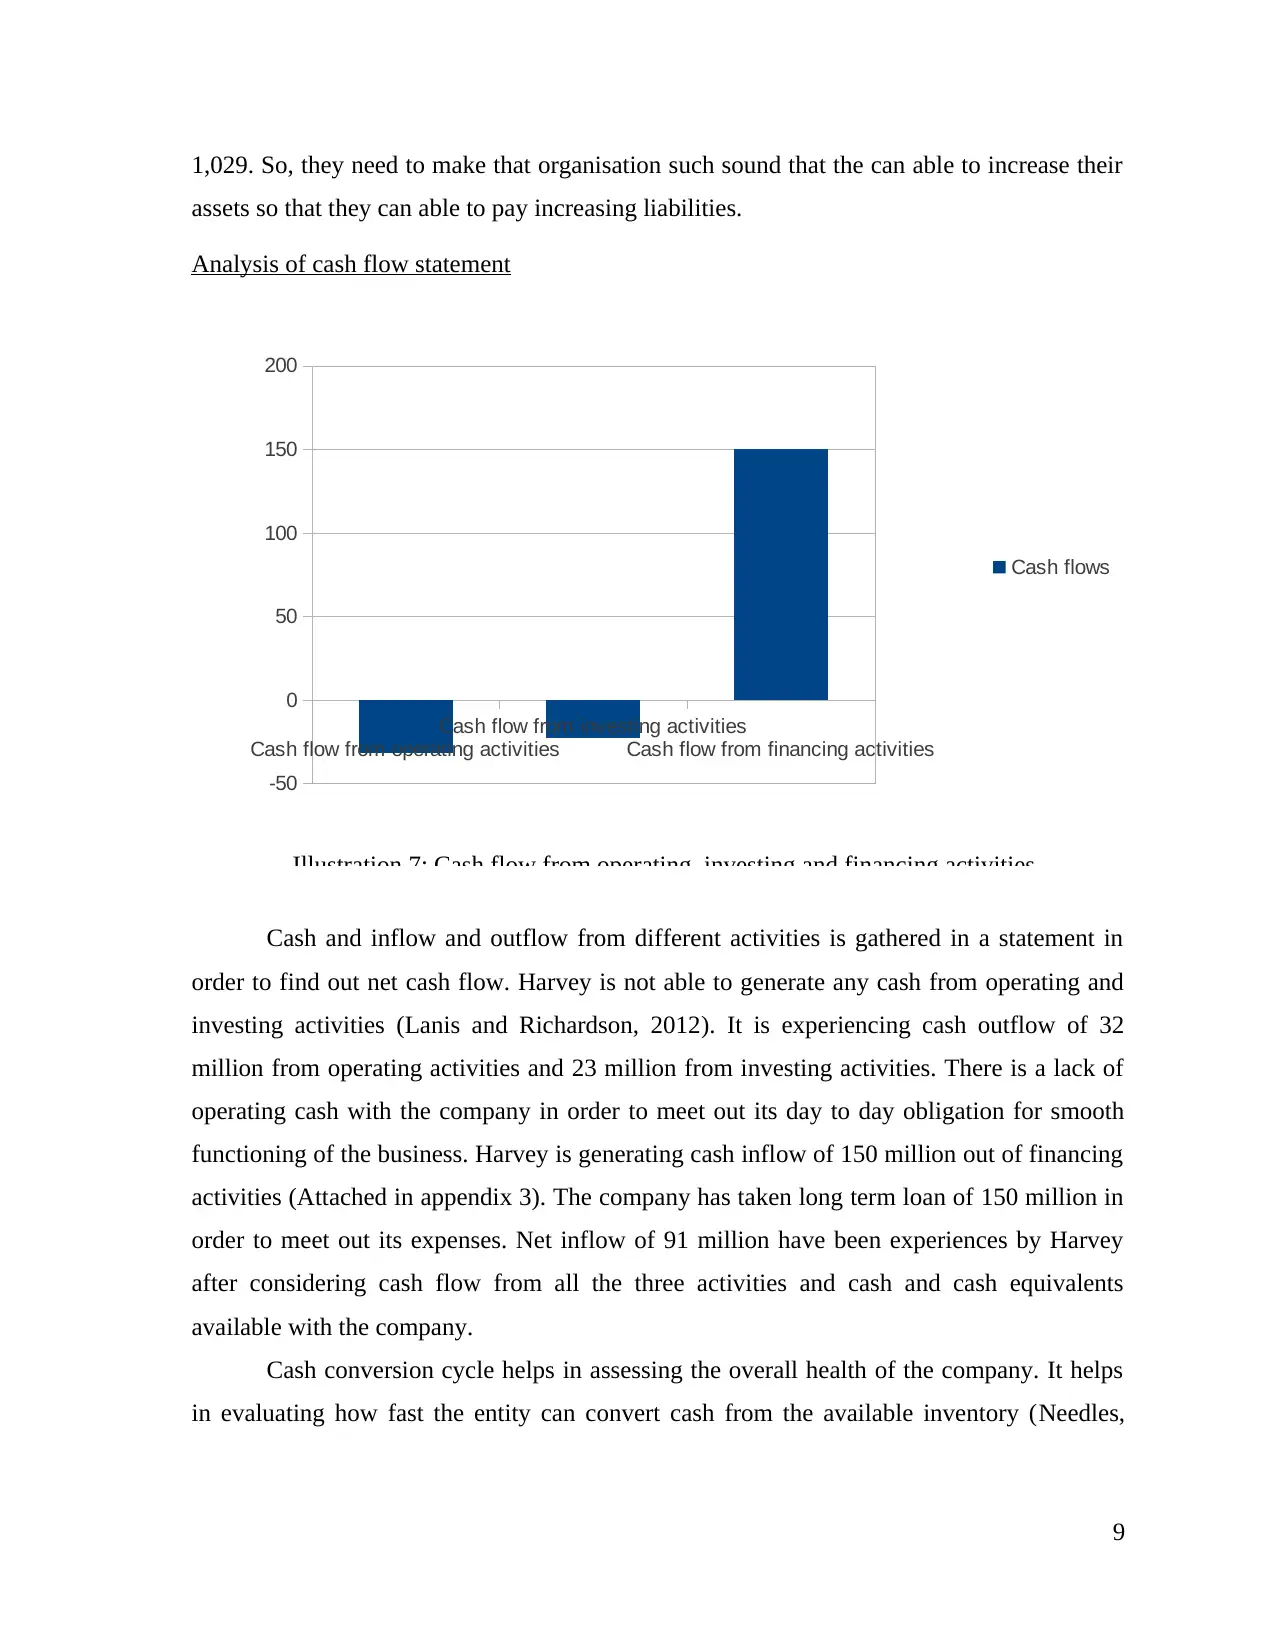
Illustration 7: Cash flow from operating, investing and financing activities
Cash and inflow and outflow from different activities is gathered in a statement in
order to find out net cash flow. Harvey is not able to generate any cash from operating and
investing activities (Lanis and Richardson, 2012). It is experiencing cash outflow of 32
million from operating activities and 23 million from investing activities. There is a lack of
operating cash with the company in order to meet out its day to day obligation for smooth
functioning of the business. Harvey is generating cash inflow of 150 million out of financing
activities (Attached in appendix 3). The company has taken long term loan of 150 million in
order to meet out its expenses. Net inflow of 91 million have been experiences by Harvey
after considering cash flow from all the three activities and cash and cash equivalents
available with the company.
Cash conversion cycle helps in assessing the overall health of the company. It helps
in evaluating how fast the entity can convert cash from the available inventory (Needles,
9
assets so that they can able to pay increasing liabilities.
Analysis of cash flow statement
Cash flow from operating activities
Cash flow from investing activities
Cash flow from financing activities
-50
0
50
100
150
200
Cash flows
Illustration 7: Cash flow from operating, investing and financing activities
Cash and inflow and outflow from different activities is gathered in a statement in
order to find out net cash flow. Harvey is not able to generate any cash from operating and
investing activities (Lanis and Richardson, 2012). It is experiencing cash outflow of 32
million from operating activities and 23 million from investing activities. There is a lack of
operating cash with the company in order to meet out its day to day obligation for smooth
functioning of the business. Harvey is generating cash inflow of 150 million out of financing
activities (Attached in appendix 3). The company has taken long term loan of 150 million in
order to meet out its expenses. Net inflow of 91 million have been experiences by Harvey
after considering cash flow from all the three activities and cash and cash equivalents
available with the company.
Cash conversion cycle helps in assessing the overall health of the company. It helps
in evaluating how fast the entity can convert cash from the available inventory (Needles,
9
⊘ This is a preview!⊘
Do you want full access?
Subscribe today to unlock all pages.
Trusted by 1+ million students worldwide
1 out of 23
Related Documents


Your All-in-One AI-Powered Toolkit for Academic Success.
+13062052269
info@desklib.com
Available 24*7 on WhatsApp / Email
![[object Object]](/_next/static/media/star-bottom.7253800d.svg)
Unlock your academic potential
Copyright © 2020–2026 A2Z Services. All Rights Reserved. Developed and managed by ZUCOL.