Financial Management Analysis of Harvey Norman's Performance
VerifiedAdded on 2020/06/06
|11
|2088
|117
Report
AI Summary
This report presents a comprehensive financial analysis of Harvey Norman, a prominent retail company specializing in furniture and electronics. It begins with an introduction outlining the scope, followed by an in-depth examination of debt valuation, including short-term and long-term debt, industry consistency, and the cost of debt. The analysis then transitions to share valuation, assessing the cost of equity using the CAPM model, comparing the company's performance with industry benchmarks, evaluating the PE ratio, and discussing the reasonableness of the valuation models. The report further delves into the cost of capital, calculating the weighted average cost of capital (WACC), explaining the company's tax rate, and discussing the inclusion of current liabilities. Market analysis compares the firm's performance to the industry and explores analyst perceptions. The conclusion summarizes the findings and highlights areas for improvement, such as restructuring debt and equity to mitigate business risks. The report utilizes tables, figures, and references to support its analysis, providing a detailed overview of Harvey Norman's financial position and market standing.
FINANCIAL MANAGEMENT
ANALYSIS
ANALYSIS
Paraphrase This Document
Need a fresh take? Get an instant paraphrase of this document with our AI Paraphraser
TABLE OF CONTENTS
INTRODUCTION...........................................................................................................................1
Debt valuation..................................................................................................................................1
(1)Short term and long term debt used by firms..........................................................................1
(2) Consistency of debt structure with industry...........................................................................1
(3) Impact of industry on proportion of long and short term loan of business firm....................1
(4) Harwey Norman cost of debt.................................................................................................1
Share valuation................................................................................................................................1
(1)What is your company cost of equity......................................................................................1
(2) Comparison of performance...................................................................................................2
(3) Company PE ratio evaluation................................................................................................3
(4) Reasonable values of model...................................................................................................4
(5) Additional data and information requirement for valuing company stock............................4
Cost of capital..................................................................................................................................4
(1)Calculation of weighted average cost of capital of company.................................................4
(2) Explaination of company tax rate..........................................................................................5
(3)Why is there any difference between cost of equity and debt................................................5
(4) Inclusion of current liability as cost of capital.......................................................................5
(5) WACC value and its application............................................................................................5
(6) Projects and use of WACC....................................................................................................5
(7)Defining and explaining capital structure...............................................................................6
(8)Optimal capital structure and factors that can imbalance it....................................................6
Market analysis................................................................................................................................6
(1)Comparison of firm performance to industry.........................................................................6
(2) Perception of analyst about Harvey Norman.........................................................................6
(3) Items different for company...................................................................................................6
CONCLUSION................................................................................................................................6
Table of Index
Table 1Company PE ratio and valuation.........................................................................................3
Table 2Calculation of CAPM..........................................................................................................4
Table 3Enterprise value...................................................................................................................4
Table 4Debt and equity weight in capital structure as well as WACC...........................................4
Figure 1Sales revenue of Harwey Norman......................................................................................2
Figure 2EPS of Harwey Norman.....................................................................................................2
Figure 3Dividend chart of Harwey Norman....................................................................................3
⊘ This is a preview!⊘
Do you want full access?
Subscribe today to unlock all pages.
Trusted by 1+ million students worldwide
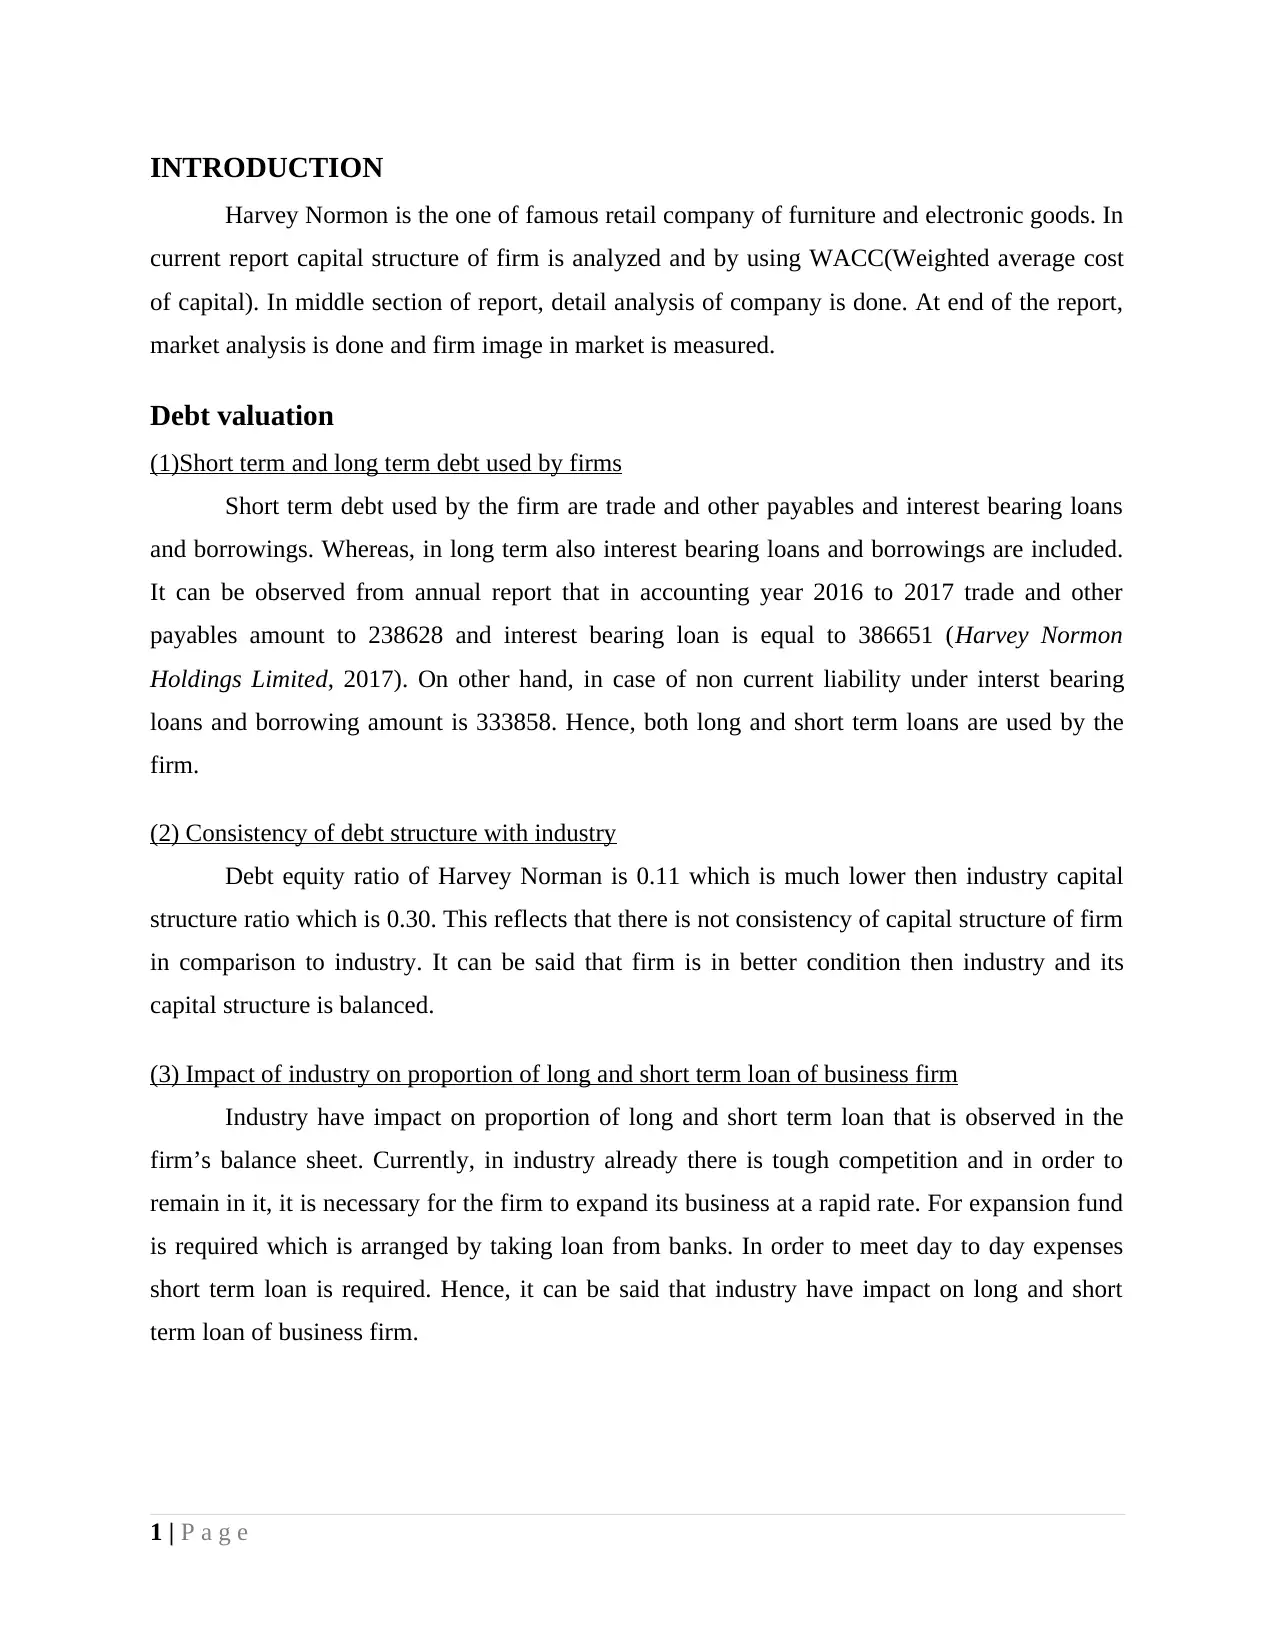
INTRODUCTION
Harvey Normon is the one of famous retail company of furniture and electronic goods. In
current report capital structure of firm is analyzed and by using WACC(Weighted average cost
of capital). In middle section of report, detail analysis of company is done. At end of the report,
market analysis is done and firm image in market is measured.
Debt valuation
(1)Short term and long term debt used by firms
Short term debt used by the firm are trade and other payables and interest bearing loans
and borrowings. Whereas, in long term also interest bearing loans and borrowings are included.
It can be observed from annual report that in accounting year 2016 to 2017 trade and other
payables amount to 238628 and interest bearing loan is equal to 386651 (Harvey Normon
Holdings Limited, 2017). On other hand, in case of non current liability under interst bearing
loans and borrowing amount is 333858. Hence, both long and short term loans are used by the
firm.
(2) Consistency of debt structure with industry
Debt equity ratio of Harvey Norman is 0.11 which is much lower then industry capital
structure ratio which is 0.30. This reflects that there is not consistency of capital structure of firm
in comparison to industry. It can be said that firm is in better condition then industry and its
capital structure is balanced.
(3) Impact of industry on proportion of long and short term loan of business firm
Industry have impact on proportion of long and short term loan that is observed in the
firm’s balance sheet. Currently, in industry already there is tough competition and in order to
remain in it, it is necessary for the firm to expand its business at a rapid rate. For expansion fund
is required which is arranged by taking loan from banks. In order to meet day to day expenses
short term loan is required. Hence, it can be said that industry have impact on long and short
term loan of business firm.
1 | P a g e
Paraphrase This Document
Need a fresh take? Get an instant paraphrase of this document with our AI Paraphraser
(4) Harwey Norman cost of debt
Cost of debt of the business firm is 20072 which is the amount of interest that is paid by
the business firm on its loan to banks. Cost of debt is usually considered as amount that is
computed by charging interest percentage of principle amount.
Share valuation
(1)What is your company cost of equity
Cost of equity is 11% as it is the rate of return that company need to give to its investors
for risk they are taking in business. Cost of equity is computed for the business firm by using
CAPM or capital asset pricing model.
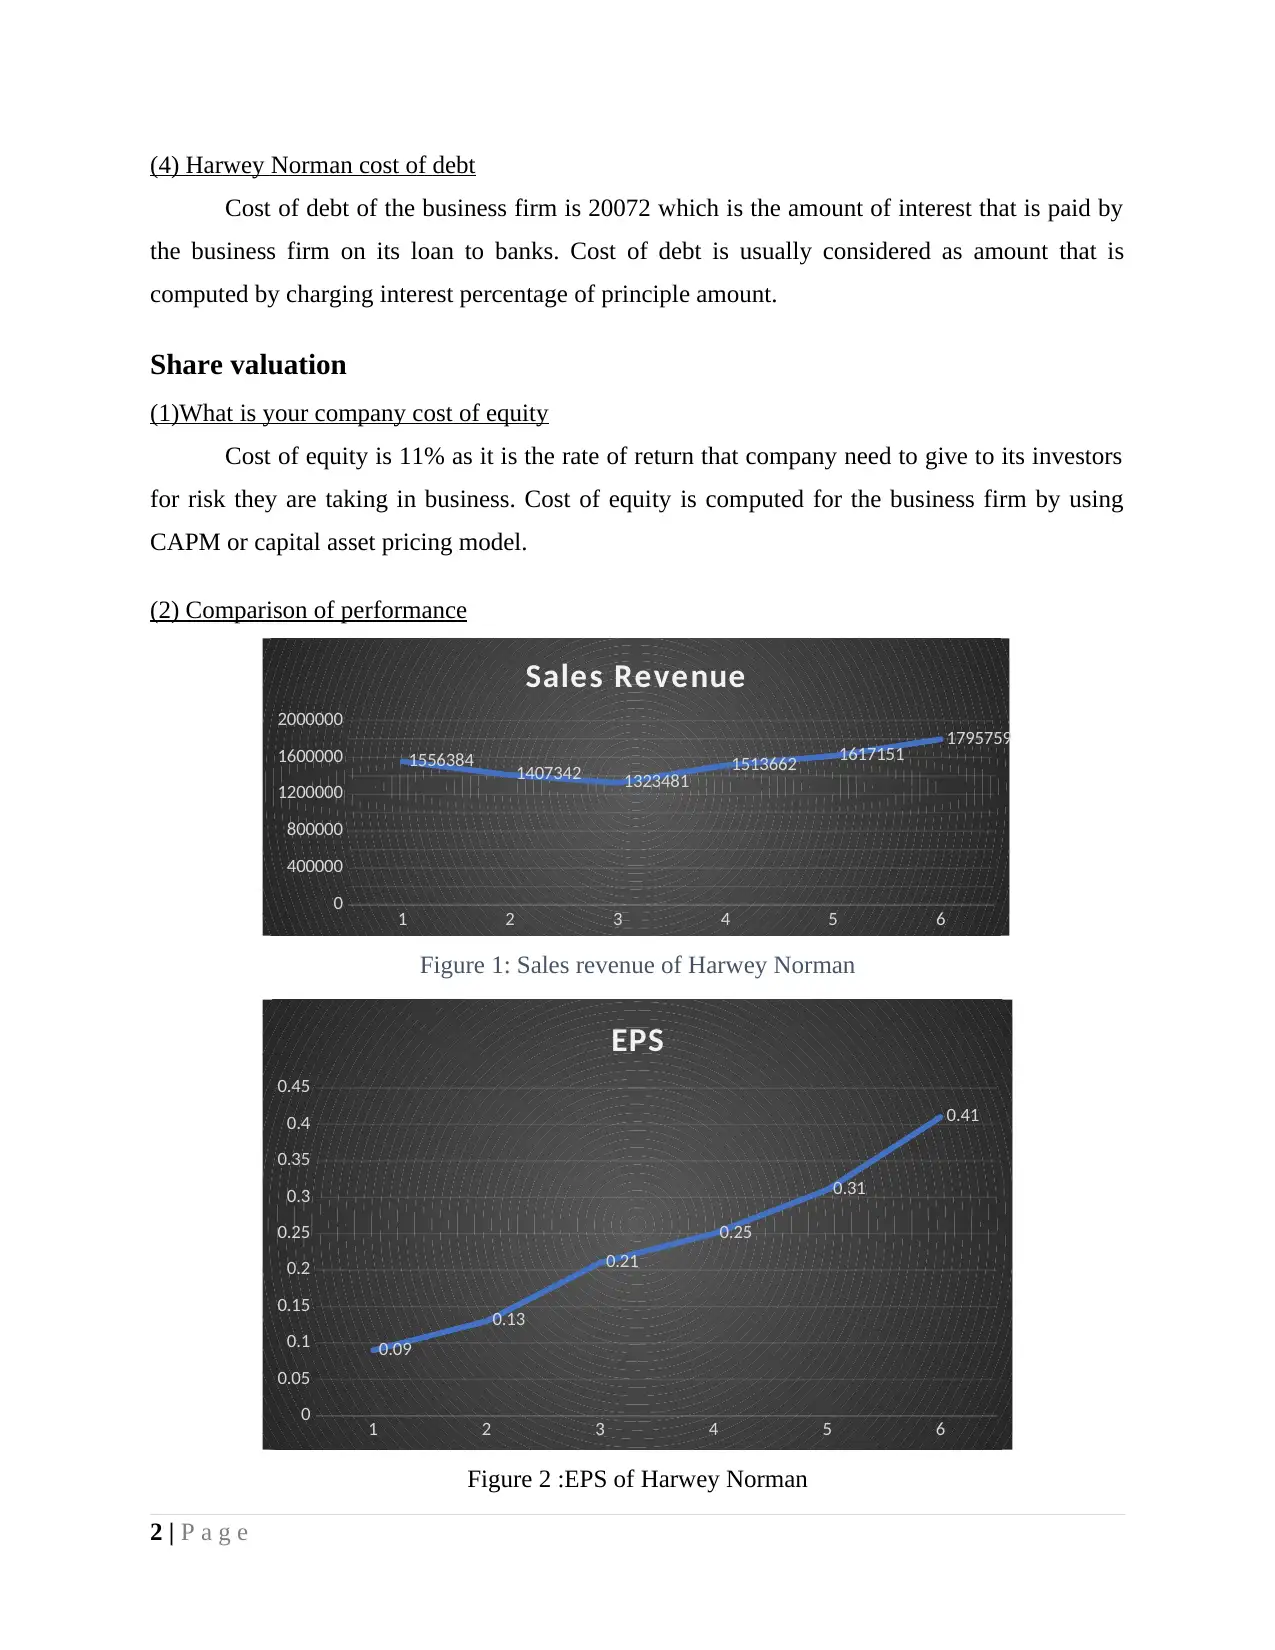
(2) Comparison of performance
1 2 3 4 5 6
0
400000
800000
1200000
1600000
2000000
1556384 1407342 1323481 1513662 1617151 1795759
Sales Revenue
Figure 1: Sales revenue of Harwey Norman
1 2 3 4 5 6
0
0.05
0.1
0.15
0.2
0.25
0.3
0.35
0.4
0.45
0.09
0.13
0.21
0.25
0.31
0.41
EPS
Figure 2 :EPS of Harwey Norman
2 | P a g e
Cost of debt of the business firm is 20072 which is the amount of interest that is paid by
the business firm on its loan to banks. Cost of debt is usually considered as amount that is
computed by charging interest percentage of principle amount.
Share valuation
(1)What is your company cost of equity
Cost of equity is 11% as it is the rate of return that company need to give to its investors
for risk they are taking in business. Cost of equity is computed for the business firm by using
CAPM or capital asset pricing model.
(2) Comparison of performance
1 2 3 4 5 6
0
400000
800000
1200000
1600000
2000000
1556384 1407342 1323481 1513662 1617151 1795759
Sales Revenue
Figure 1: Sales revenue of Harwey Norman
1 2 3 4 5 6
0
0.05
0.1
0.15
0.2
0.25
0.3
0.35
0.4
0.45
0.09
0.13
0.21
0.25
0.31
0.41
EPS
Figure 2 :EPS of Harwey Norman
2 | P a g e
1 2 3 4 5 6
0
0.05
0.1
0.15
0.2
0.25
0.3
0.35
0.4
0.45
0.5
0.15
0.12
0.15
0.24
0.34
0.43
Dividend
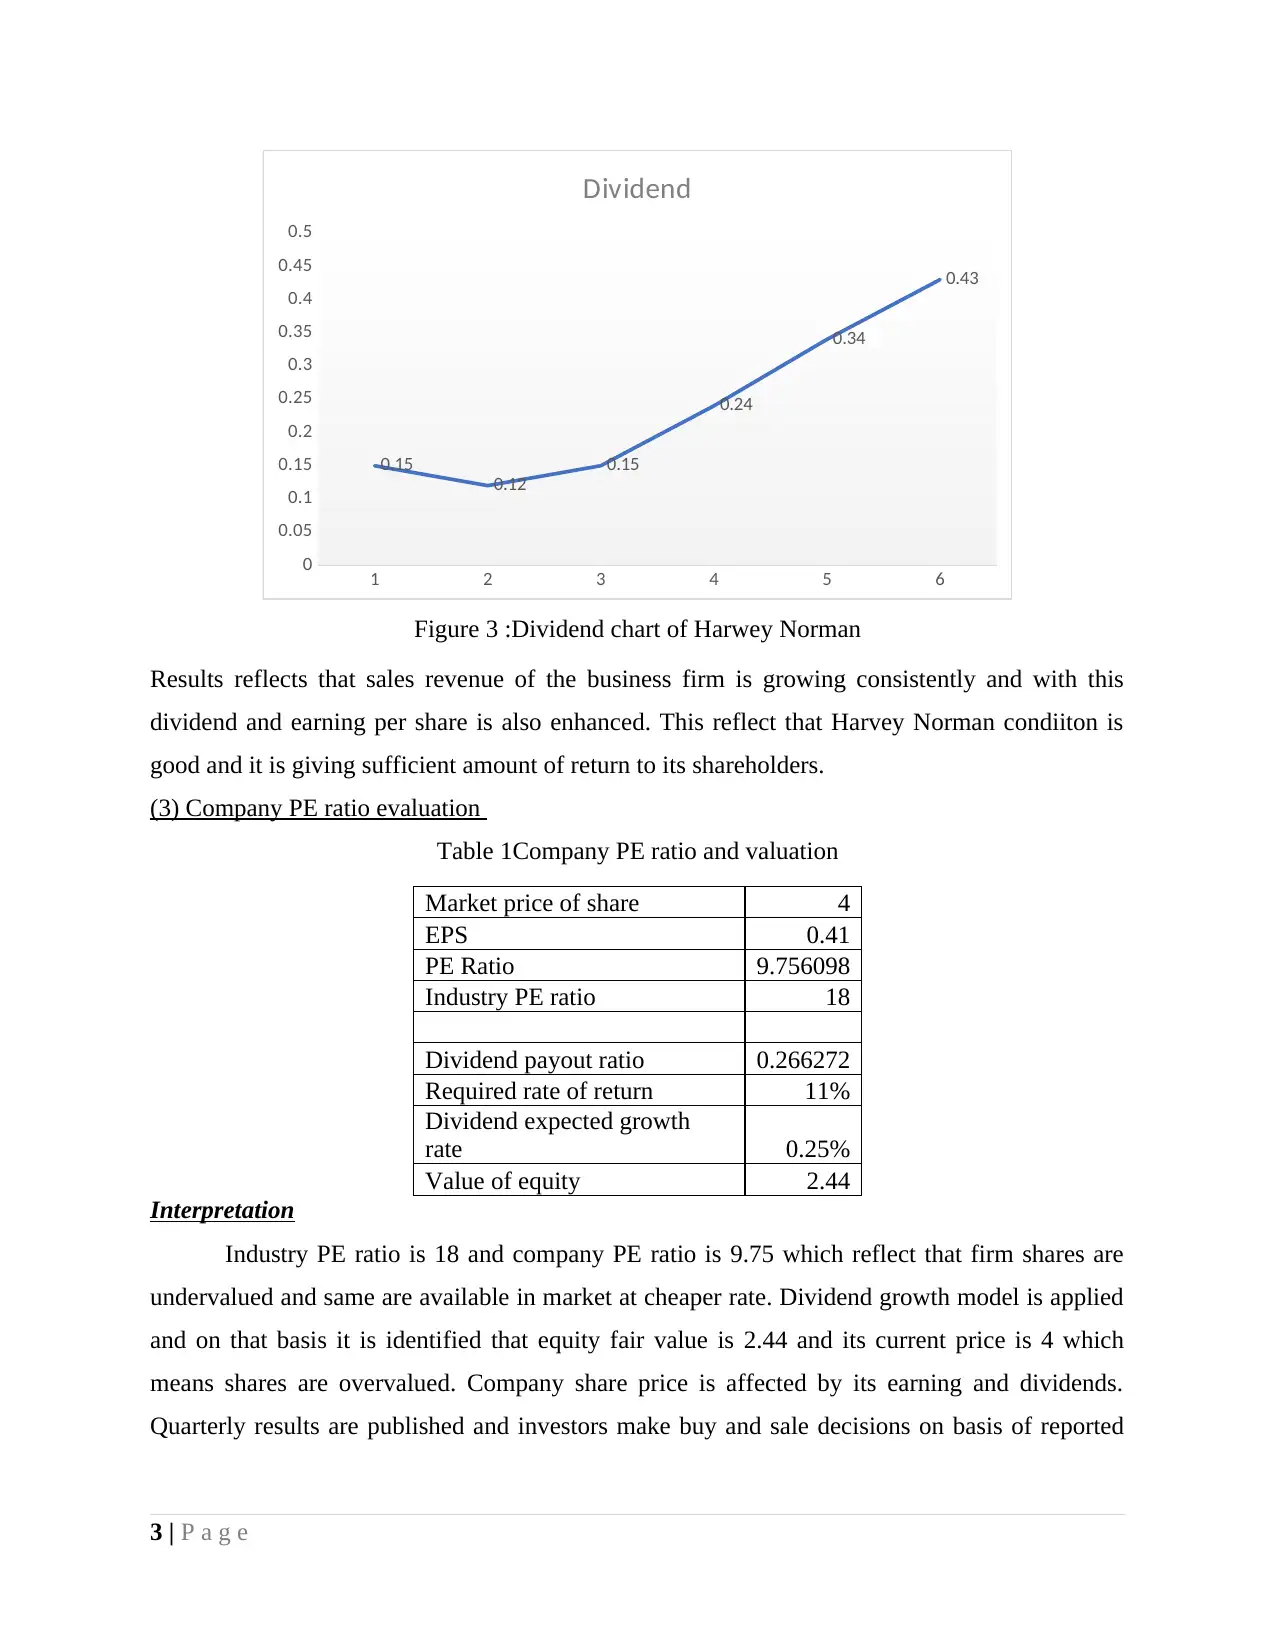
Figure 3 :Dividend chart of Harwey Norman
Results reflects that sales revenue of the business firm is growing consistently and with this
dividend and earning per share is also enhanced. This reflect that Harvey Norman condiiton is
good and it is giving sufficient amount of return to its shareholders.
(3) Company PE ratio evaluation
Table 1Company PE ratio and valuation
Market price of share 4
EPS 0.41
PE Ratio 9.756098
Industry PE ratio 18
Dividend payout ratio 0.266272
Required rate of return 11%
Dividend expected growth
rate 0.25%
Value of equity 2.44
Interpretation
Industry PE ratio is 18 and company PE ratio is 9.75 which reflect that firm shares are
undervalued and same are available in market at cheaper rate. Dividend growth model is applied
and on that basis it is identified that equity fair value is 2.44 and its current price is 4 which
means shares are overvalued. Company share price is affected by its earning and dividends.
Quarterly results are published and investors make buy and sale decisions on basis of reported
3 | P a g e
0
0.05
0.1
0.15
0.2
0.25
0.3
0.35
0.4
0.45
0.5
0.15
0.12
0.15
0.24
0.34
0.43
Dividend
Figure 3 :Dividend chart of Harwey Norman
Results reflects that sales revenue of the business firm is growing consistently and with this
dividend and earning per share is also enhanced. This reflect that Harvey Norman condiiton is
good and it is giving sufficient amount of return to its shareholders.
(3) Company PE ratio evaluation
Table 1Company PE ratio and valuation
Market price of share 4
EPS 0.41
PE Ratio 9.756098
Industry PE ratio 18
Dividend payout ratio 0.266272
Required rate of return 11%
Dividend expected growth
rate 0.25%
Value of equity 2.44
Interpretation
Industry PE ratio is 18 and company PE ratio is 9.75 which reflect that firm shares are
undervalued and same are available in market at cheaper rate. Dividend growth model is applied
and on that basis it is identified that equity fair value is 2.44 and its current price is 4 which
means shares are overvalued. Company share price is affected by its earning and dividends.
Quarterly results are published and investors make buy and sale decisions on basis of reported
3 | P a g e
⊘ This is a preview!⊘
Do you want full access?
Subscribe today to unlock all pages.
Trusted by 1+ million students worldwide
earnings not dividend. Hence, income is the factor that most affect share price and is covered by
PE ratio model.
(4) Reasonable values of model
On comparison of both model PE value seems reasonable a compared to market price of
stock as it reflect firm shares are undervalued (Bodie, 2013). Currently, firm is receving stiff
competition from its rivals and it is difficult for it maintain market share in business. From this,
point of view firm performance is below market and shares are undervalued as reflected by PE
ratio. Hence, PE ratio value seems more reasonable from this point of view in respect to market
price.
(5) Additional data and information requirement for valuing company stock
For valuation of company stock some of the information that are more required are cash
flows facts or values and cost of capital information. By using these facts stocks can be valued in
proper manner by using discounted cash flow model. Discounted cash flow model often used
along with PE ratio for valuation of company.
Cost of capital
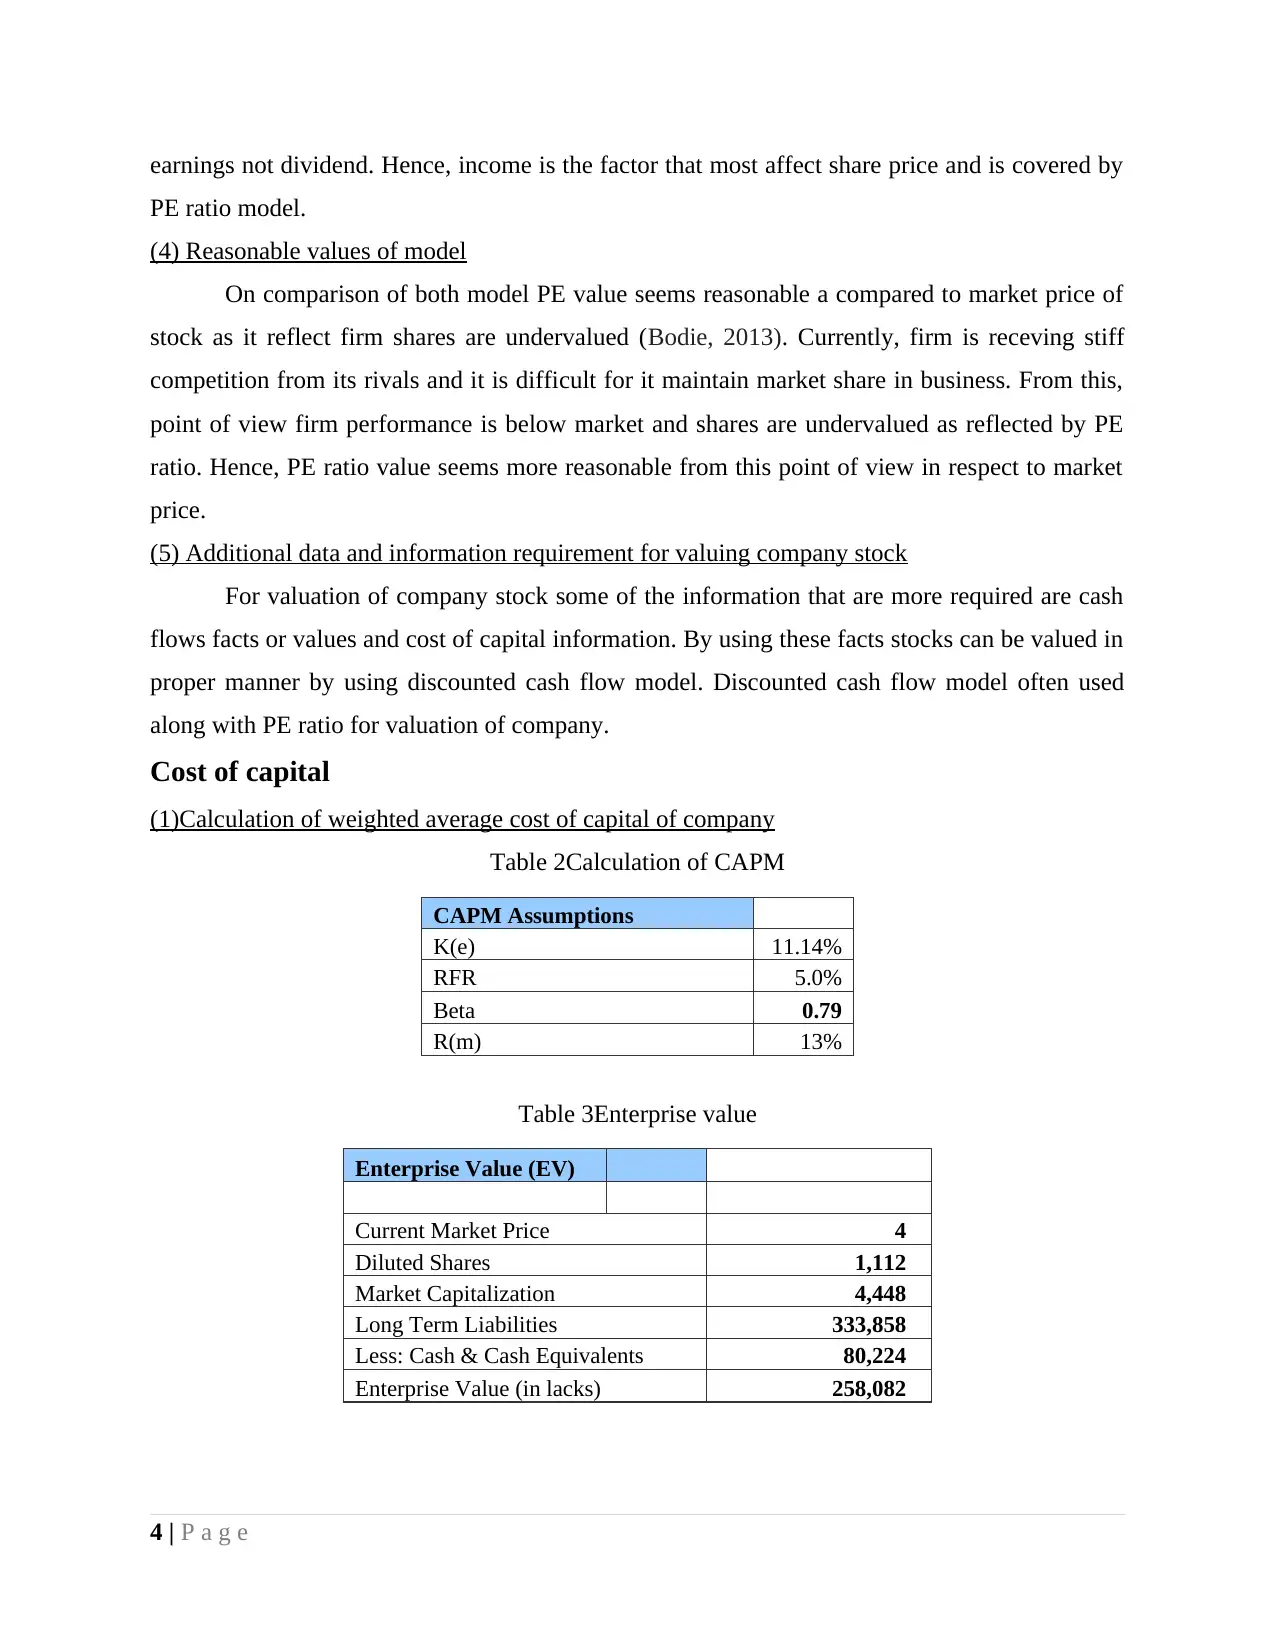
(1)Calculation of weighted average cost of capital of company
Table 2Calculation of CAPM
CAPM Assumptions
K(e) 11.14%
RFR 5.0%
Beta 0.79
R(m) 13%
Table 3Enterprise value
Enterprise Value (EV)
Current Market Price 4
Diluted Shares 1,112
Market Capitalization 4,448
Long Term Liabilities 333,858
Less: Cash & Cash Equivalents 80,224
Enterprise Value (in lacks) 258,082
4 | P a g e
PE ratio model.
(4) Reasonable values of model
On comparison of both model PE value seems reasonable a compared to market price of
stock as it reflect firm shares are undervalued (Bodie, 2013). Currently, firm is receving stiff
competition from its rivals and it is difficult for it maintain market share in business. From this,
point of view firm performance is below market and shares are undervalued as reflected by PE
ratio. Hence, PE ratio value seems more reasonable from this point of view in respect to market
price.
(5) Additional data and information requirement for valuing company stock
For valuation of company stock some of the information that are more required are cash
flows facts or values and cost of capital information. By using these facts stocks can be valued in
proper manner by using discounted cash flow model. Discounted cash flow model often used
along with PE ratio for valuation of company.
Cost of capital
(1)Calculation of weighted average cost of capital of company
Table 2Calculation of CAPM
CAPM Assumptions
K(e) 11.14%
RFR 5.0%
Beta 0.79
R(m) 13%
Table 3Enterprise value
Enterprise Value (EV)
Current Market Price 4
Diluted Shares 1,112
Market Capitalization 4,448
Long Term Liabilities 333,858
Less: Cash & Cash Equivalents 80,224
Enterprise Value (in lacks) 258,082
4 | P a g e
Paraphrase This Document
Need a fresh take? Get an instant paraphrase of this document with our AI Paraphraser
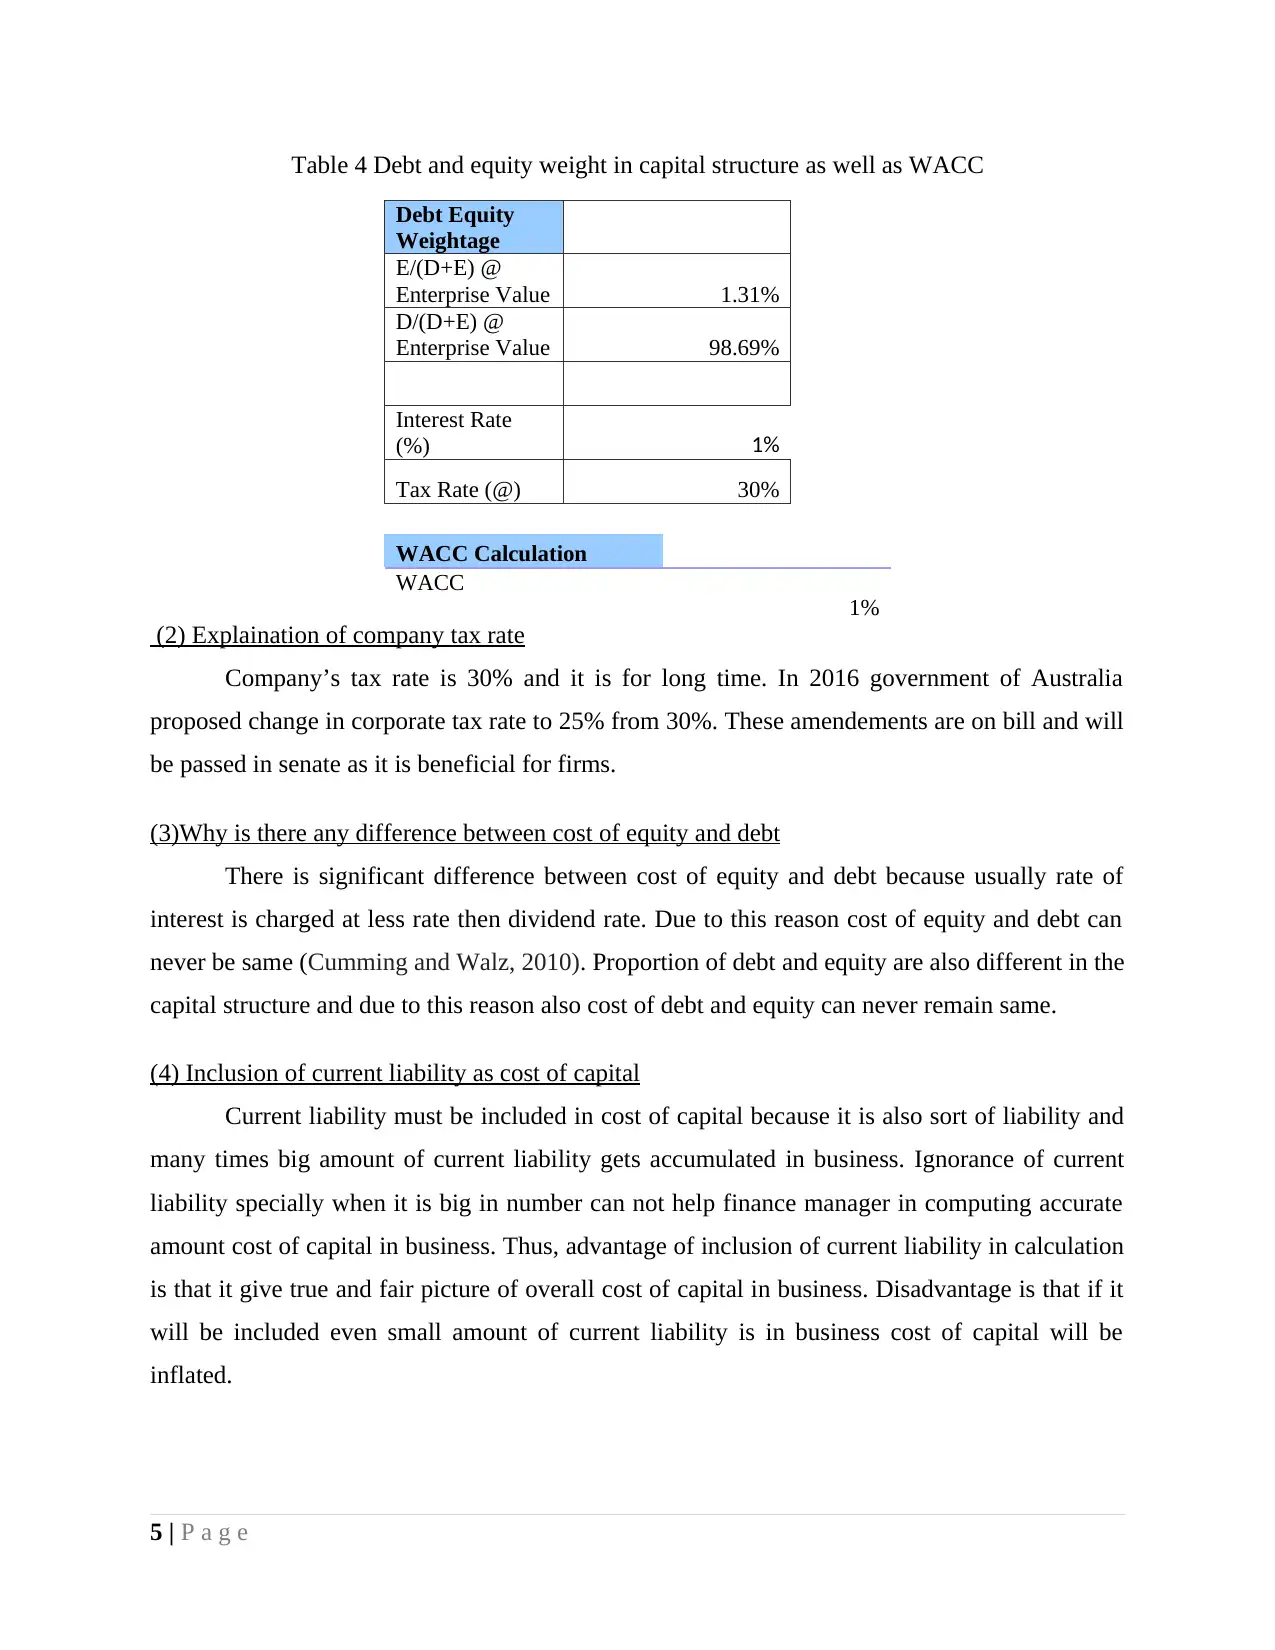
Table 4 Debt and equity weight in capital structure as well as WACC
Debt Equity
Weightage
E/(D+E) @
Enterprise Value 1.31%
D/(D+E) @
Enterprise Value 98.69%
Interest Rate
(%) 1%
Tax Rate (@) 30%
WACC Calculation
WACC
1%
(2) Explaination of company tax rate
Company’s tax rate is 30% and it is for long time. In 2016 government of Australia
proposed change in corporate tax rate to 25% from 30%. These amendements are on bill and will
be passed in senate as it is beneficial for firms.
(3)Why is there any difference between cost of equity and debt
There is significant difference between cost of equity and debt because usually rate of
interest is charged at less rate then dividend rate. Due to this reason cost of equity and debt can
never be same (Cumming and Walz, 2010). Proportion of debt and equity are also different in the
capital structure and due to this reason also cost of debt and equity can never remain same.
(4) Inclusion of current liability as cost of capital
Current liability must be included in cost of capital because it is also sort of liability and
many times big amount of current liability gets accumulated in business. Ignorance of current
liability specially when it is big in number can not help finance manager in computing accurate
amount cost of capital in business. Thus, advantage of inclusion of current liability in calculation
is that it give true and fair picture of overall cost of capital in business. Disadvantage is that if it
will be included even small amount of current liability is in business cost of capital will be
inflated.
5 | P a g e
(5) WACC value and its application
Results are reflecting that weighted average cost of capital is 1% which is very low for
the firm. It can also be seen that there is relatively very low proportion of debt in the firm capital
structure. It is used by investment banks for equity valuation.
(6) Projects and use of WACC
Currently firm is working on Westgate project as it has stores in Westgate are where
construction of residential properties is carried out. Millenia store is another project on which
firm is working. WACC is used to compute overall cost of capital and to discount cash flows of
these projects.
(7)Defining and explaining capital structure
Capital structure refers to mix of debt and equity in the capital structure. Company’s
capital structure is not consistent to industry and it is also not balanced as debt equity ratio is
0.11.
(8)Optimal capital structure and factors that can imbalance it
Optimal capital structure is one where at appropriate debt and equity mix cost of capital
is minimum. Change in economic condition of nation can imbalance it.
Market analysis
(1)Comparison of firm performance to industry
In comparison to industry firm is giving similar performance as competition increased in
industry. Hence, firm need to develop unique business strategy in order to solve problem.
(2) Perception of analyst about Harvey Norman
Analysts have perception that firm can give tough competition to Amazon in comparison
to other retailers as its sales is increasing consistently in the business. There are number of strong
points of the business firm and due to these reasons there is positive perception among analysts
about firm (Harvey Normon sales surge, 2017). I am fully agreed with comment because sales of
Harvey increased by 6% which is good and if this performance remain consistent it can give
tough competiton to rivals.
(3) Items different for company
6 | P a g e
⊘ This is a preview!⊘
Do you want full access?
Subscribe today to unlock all pages.
Trusted by 1+ million students worldwide
Item that is different for company is its capital structure as it is totally imbalanced as debt
cover 90% of capital structure.
CONCLUSION
On the basis of above discussion it is concluded that Harvey Normon is in better
condition as its sales are increasing consistently and it is ahead of rivals. It need to restructure its
debt and equity so that risk in busines can be minimized.
7 | P a g e
cover 90% of capital structure.
CONCLUSION
On the basis of above discussion it is concluded that Harvey Normon is in better
condition as its sales are increasing consistently and it is ahead of rivals. It need to restructure its
debt and equity so that risk in busines can be minimized.
7 | P a g e
Paraphrase This Document
Need a fresh take? Get an instant paraphrase of this document with our AI Paraphraser
REFERENCES
Books and Journals
Bodie, Z., 2013. Investments. McGraw-Hill.
Cumming, D. and Walz, U., 2010. Private equity returns and disclosure around the
world. Journal of International Business Studies. 41(4). pp.727-754.
Online
Harvey Normon Holdings Limited. 2017. [Online]. Available through:<
file:///C:/Users/user/Desktop/01902066.pdf>. [Accessed on 14th Octomber 2017].
Harvey Normon sales surge. 2017. [Online]. Available through:<
http://www.theaustralian.com.au/business/companies/harvey-norman-sales-surge/news-
story/176234b0f243f7be6c9d30864b197169>. [Accessed on 14th Octomber 2017].
8 | P a g e
1 out of 11
Related Documents


Your All-in-One AI-Powered Toolkit for Academic Success.
+13062052269
info@desklib.com
Available 24*7 on WhatsApp / Email
![[object Object]](/_next/static/media/star-bottom.7253800d.svg)
Unlock your academic potential
Copyright © 2020–2026 A2Z Services. All Rights Reserved. Developed and managed by ZUCOL.