Curtin University FNCE3000: Accounting Financial Analysis Report
VerifiedAdded on 2023/01/03
|17
|4832
|53
Report
AI Summary
This report provides a comprehensive financial analysis of Harvey Norman, a major Australian retail group. It begins with a shareholder analysis, exploring the understanding of the business, types of investors, and chairman's message. The report then delves into risk-return analysis, covering risk disclosures, returns to shareholders, and capital projects. It also calculates the cost of capital using CAPM and WACC, and compares the results with the dividend growth model. A significant portion of the report is dedicated to financial statement analysis, including the computation of ratios, time series analysis, and cross-section analysis. The report provides a detailed evaluation of Harvey Norman's financial performance, along with a discussion of its strengths, weaknesses, and future prospects.
Running head: ACCOUNTING FINANCIAL ANALYSIS REPORT
Accounting financial analysis report
Name of the student
Name of the university
Student ID
Author note
Accounting financial analysis report
Name of the student
Name of the university
Student ID
Author note
Paraphrase This Document
Need a fresh take? Get an instant paraphrase of this document with our AI Paraphraser
1ACCOUNTING FINANCIAL ANALYSIS REPORT
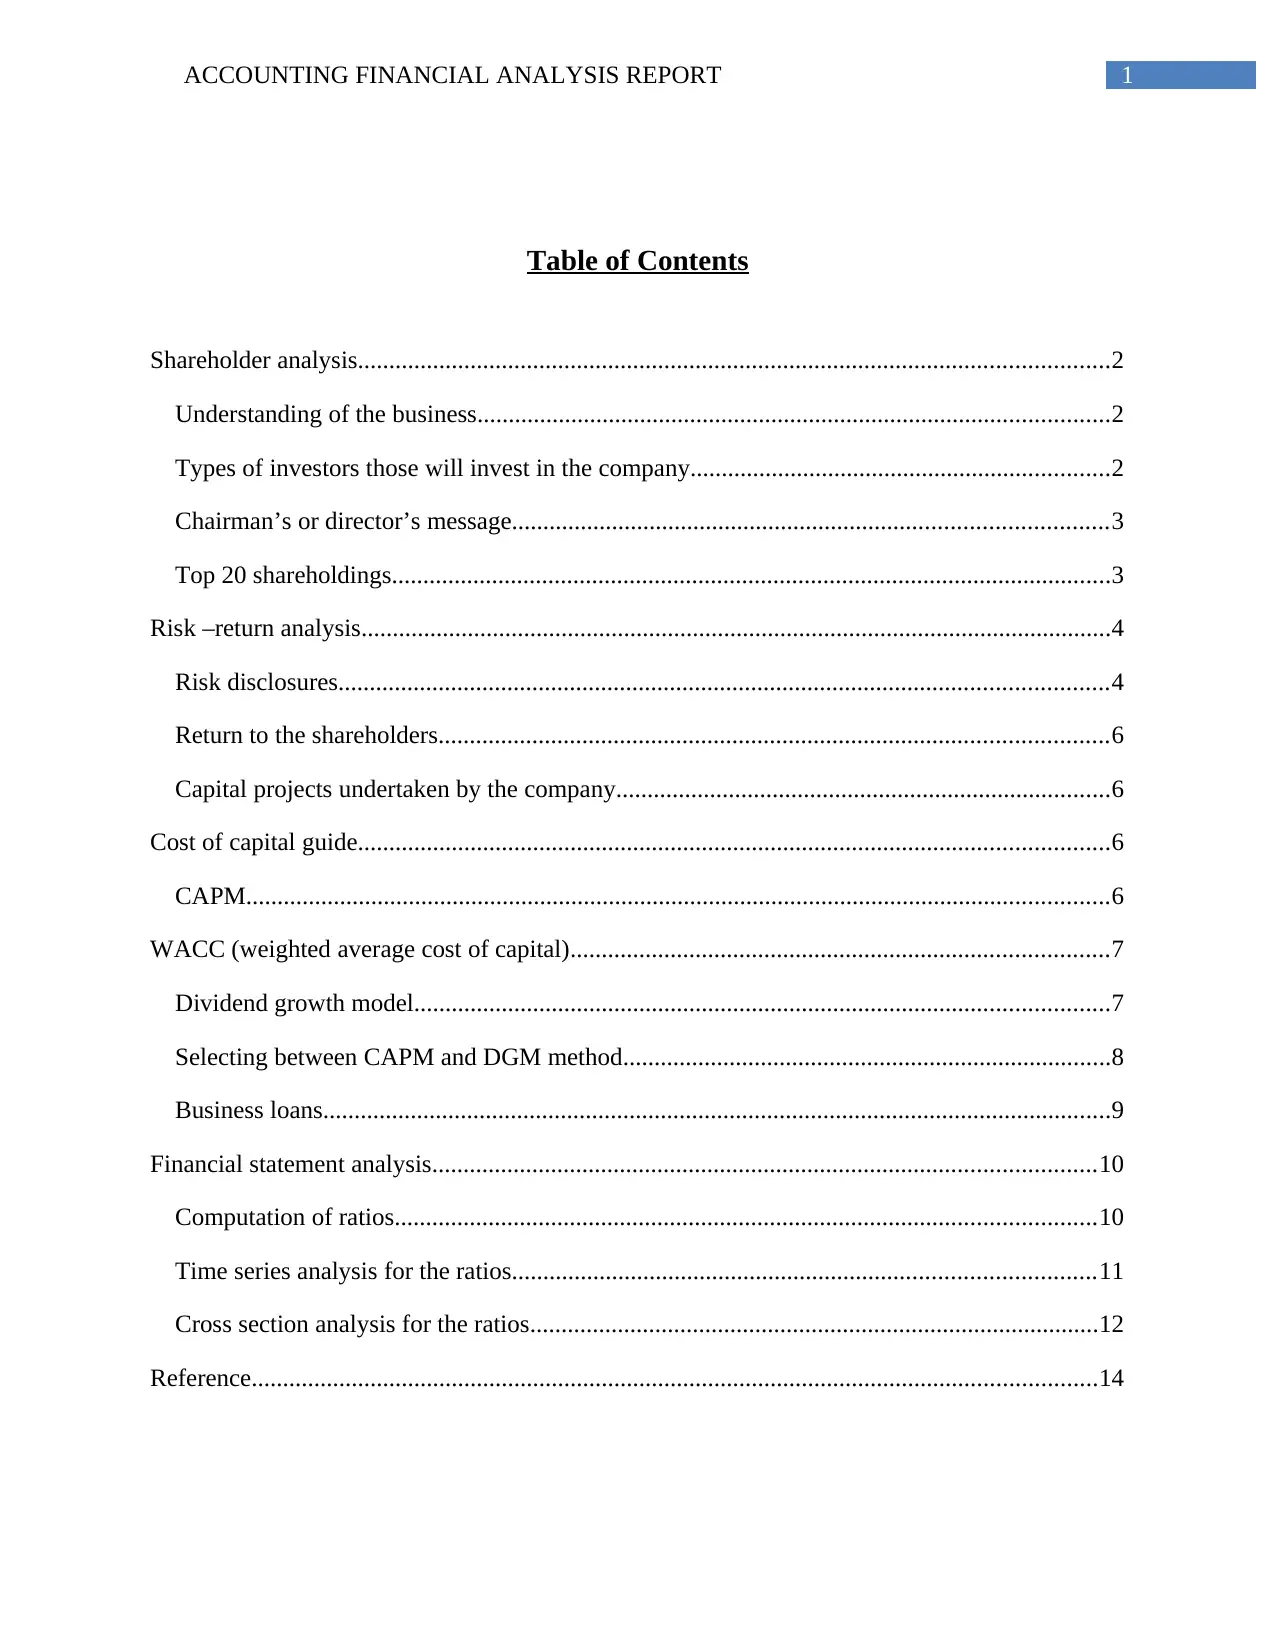
Table of Contents
Shareholder analysis........................................................................................................................2
Understanding of the business.....................................................................................................2
Types of investors those will invest in the company...................................................................2
Chairman’s or director’s message...............................................................................................3
Top 20 shareholdings...................................................................................................................3
Risk –return analysis........................................................................................................................4
Risk disclosures...........................................................................................................................4
Return to the shareholders...........................................................................................................6
Capital projects undertaken by the company...............................................................................6
Cost of capital guide........................................................................................................................6
CAPM..........................................................................................................................................6
WACC (weighted average cost of capital)......................................................................................7
Dividend growth model...............................................................................................................7
Selecting between CAPM and DGM method..............................................................................8
Business loans..............................................................................................................................9
Financial statement analysis..........................................................................................................10
Computation of ratios................................................................................................................10
Time series analysis for the ratios.............................................................................................11
Cross section analysis for the ratios...........................................................................................12
Reference.......................................................................................................................................14
2ACCOUNTING FINANCIAL ANALYSIS REPORT
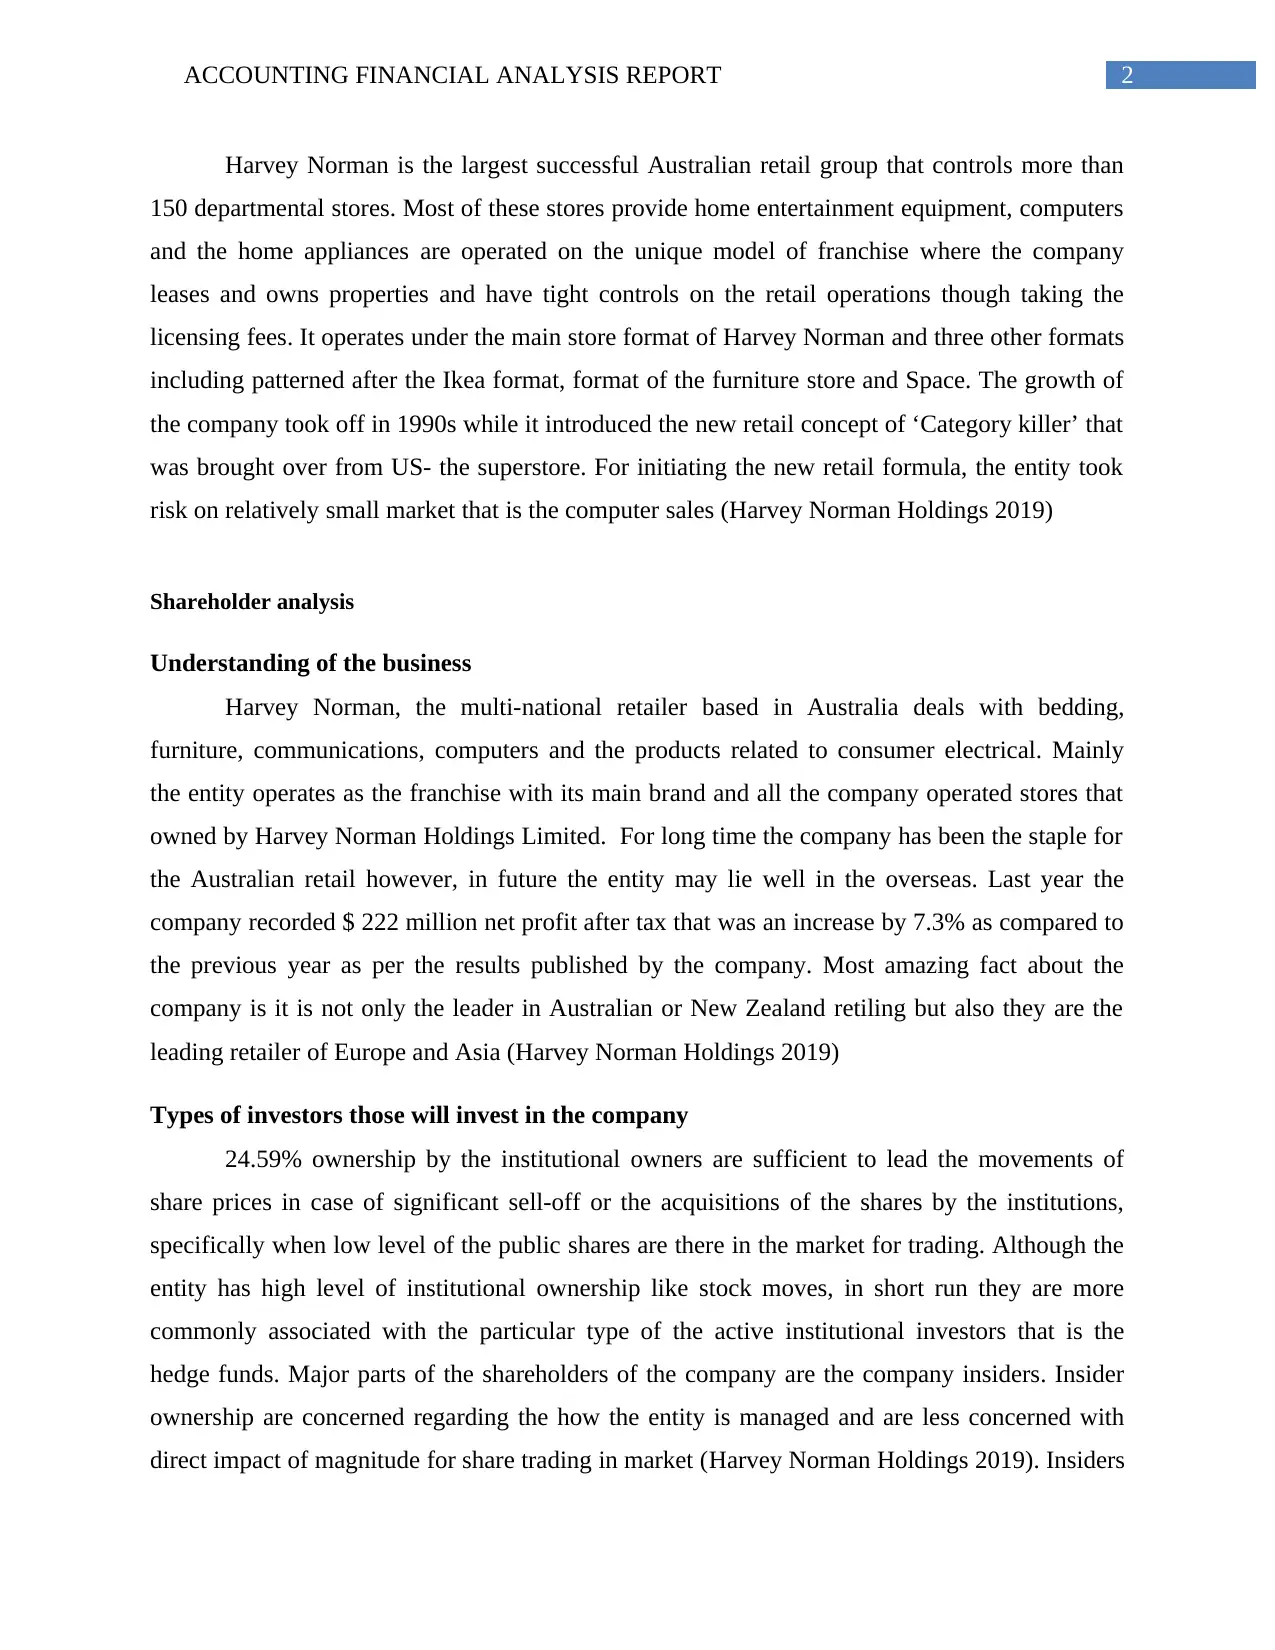
Harvey Norman is the largest successful Australian retail group that controls more than
150 departmental stores. Most of these stores provide home entertainment equipment, computers
and the home appliances are operated on the unique model of franchise where the company
leases and owns properties and have tight controls on the retail operations though taking the
licensing fees. It operates under the main store format of Harvey Norman and three other formats
including patterned after the Ikea format, format of the furniture store and Space. The growth of
the company took off in 1990s while it introduced the new retail concept of ‘Category killer’ that
was brought over from US- the superstore. For initiating the new retail formula, the entity took
risk on relatively small market that is the computer sales (Harvey Norman Holdings 2019)
Shareholder analysis
Understanding of the business
Harvey Norman, the multi-national retailer based in Australia deals with bedding,
furniture, communications, computers and the products related to consumer electrical. Mainly
the entity operates as the franchise with its main brand and all the company operated stores that
owned by Harvey Norman Holdings Limited. For long time the company has been the staple for
the Australian retail however, in future the entity may lie well in the overseas. Last year the
company recorded $ 222 million net profit after tax that was an increase by 7.3% as compared to
the previous year as per the results published by the company. Most amazing fact about the
company is it is not only the leader in Australian or New Zealand retiling but also they are the
leading retailer of Europe and Asia (Harvey Norman Holdings 2019)
Types of investors those will invest in the company
24.59% ownership by the institutional owners are sufficient to lead the movements of
share prices in case of significant sell-off or the acquisitions of the shares by the institutions,
specifically when low level of the public shares are there in the market for trading. Although the
entity has high level of institutional ownership like stock moves, in short run they are more
commonly associated with the particular type of the active institutional investors that is the
hedge funds. Major parts of the shareholders of the company are the company insiders. Insider
ownership are concerned regarding the how the entity is managed and are less concerned with
direct impact of magnitude for share trading in market (Harvey Norman Holdings 2019). Insiders
⊘ This is a preview!⊘
Do you want full access?
Subscribe today to unlock all pages.
Trusted by 1+ million students worldwide
3ACCOUNTING FINANCIAL ANALYSIS REPORT
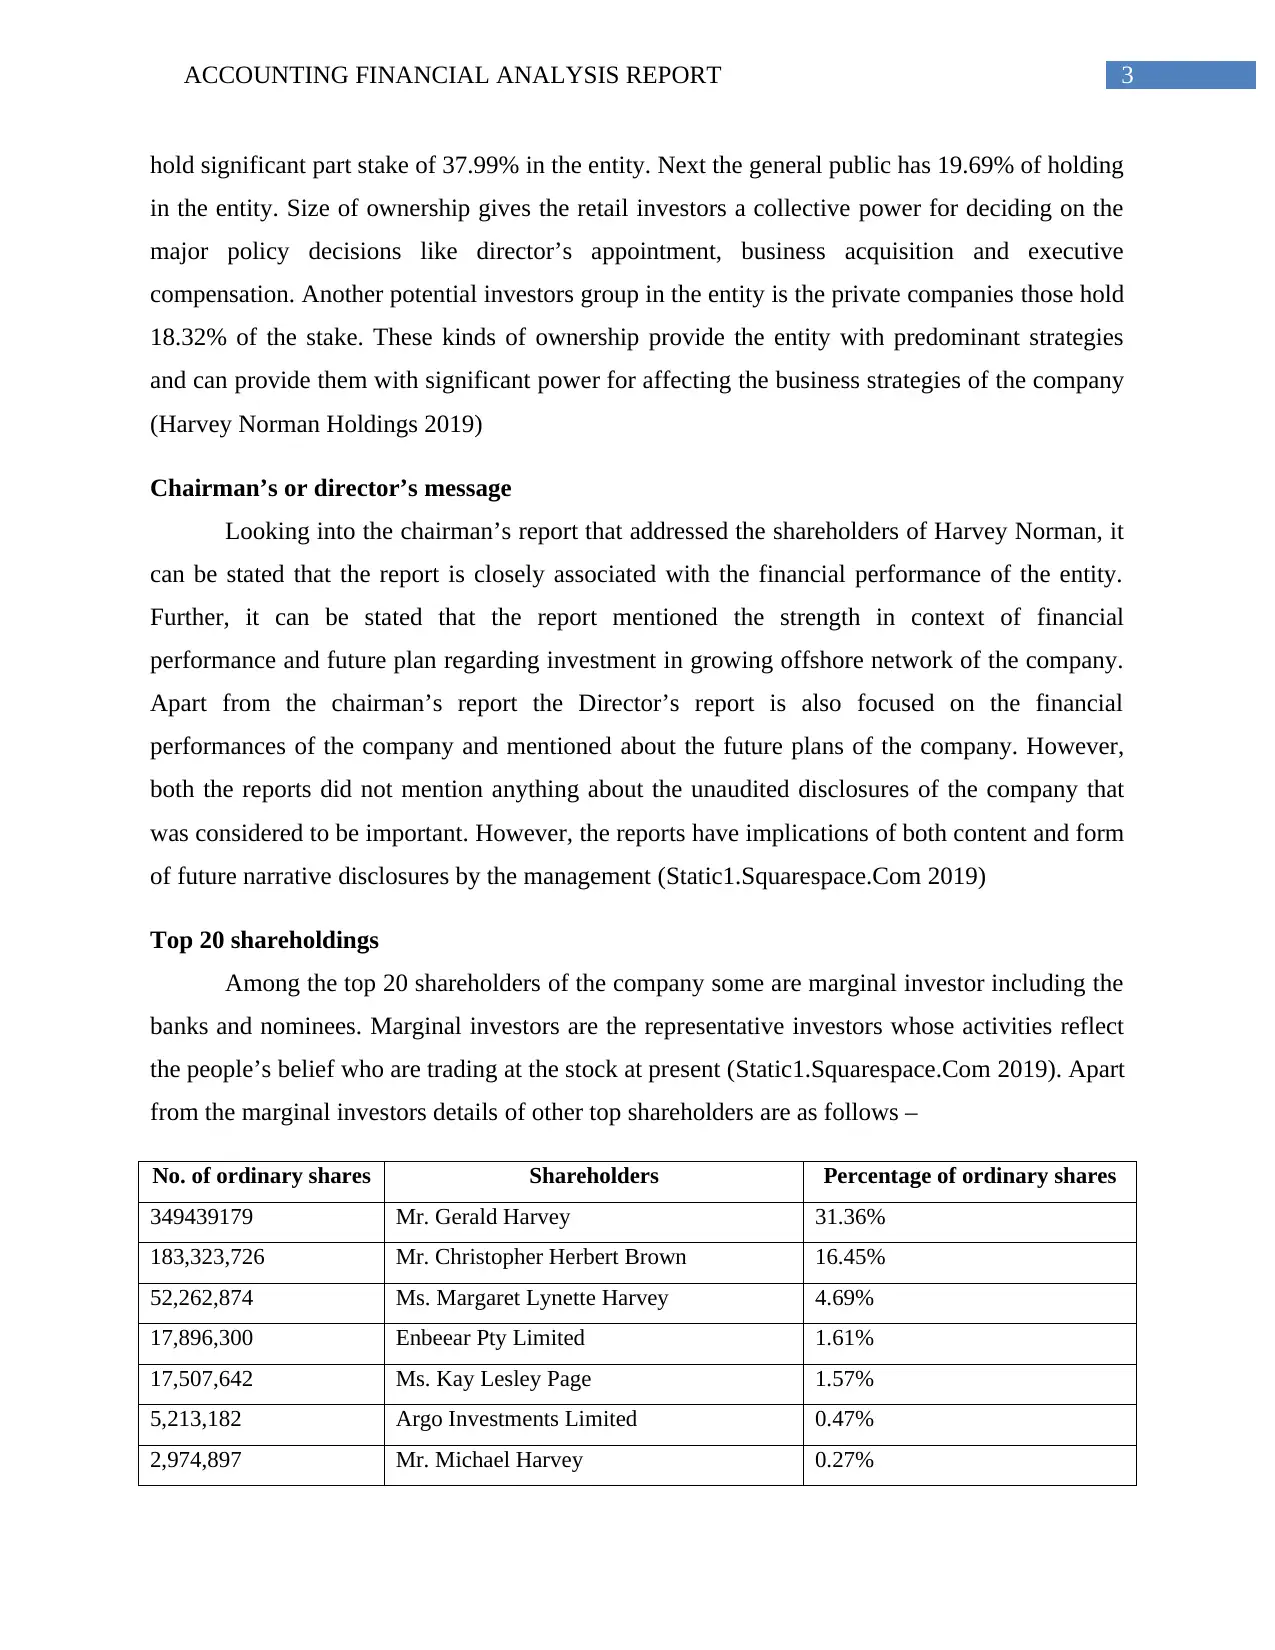
hold significant part stake of 37.99% in the entity. Next the general public has 19.69% of holding
in the entity. Size of ownership gives the retail investors a collective power for deciding on the
major policy decisions like director’s appointment, business acquisition and executive
compensation. Another potential investors group in the entity is the private companies those hold
18.32% of the stake. These kinds of ownership provide the entity with predominant strategies
and can provide them with significant power for affecting the business strategies of the company
(Harvey Norman Holdings 2019)
Chairman’s or director’s message
Looking into the chairman’s report that addressed the shareholders of Harvey Norman, it
can be stated that the report is closely associated with the financial performance of the entity.
Further, it can be stated that the report mentioned the strength in context of financial
performance and future plan regarding investment in growing offshore network of the company.
Apart from the chairman’s report the Director’s report is also focused on the financial
performances of the company and mentioned about the future plans of the company. However,
both the reports did not mention anything about the unaudited disclosures of the company that
was considered to be important. However, the reports have implications of both content and form
of future narrative disclosures by the management (Static1.Squarespace.Com 2019)
Top 20 shareholdings
Among the top 20 shareholders of the company some are marginal investor including the
banks and nominees. Marginal investors are the representative investors whose activities reflect
the people’s belief who are trading at the stock at present (Static1.Squarespace.Com 2019). Apart
from the marginal investors details of other top shareholders are as follows –
No. of ordinary shares Shareholders Percentage of ordinary shares
349439179 Mr. Gerald Harvey 31.36%
183,323,726 Mr. Christopher Herbert Brown 16.45%
52,262,874 Ms. Margaret Lynette Harvey 4.69%
17,896,300 Enbeear Pty Limited 1.61%
17,507,642 Ms. Kay Lesley Page 1.57%
5,213,182 Argo Investments Limited 0.47%
2,974,897 Mr. Michael Harvey 0.27%
Paraphrase This Document
Need a fresh take? Get an instant paraphrase of this document with our AI Paraphraser
4ACCOUNTING FINANCIAL ANALYSIS REPORT
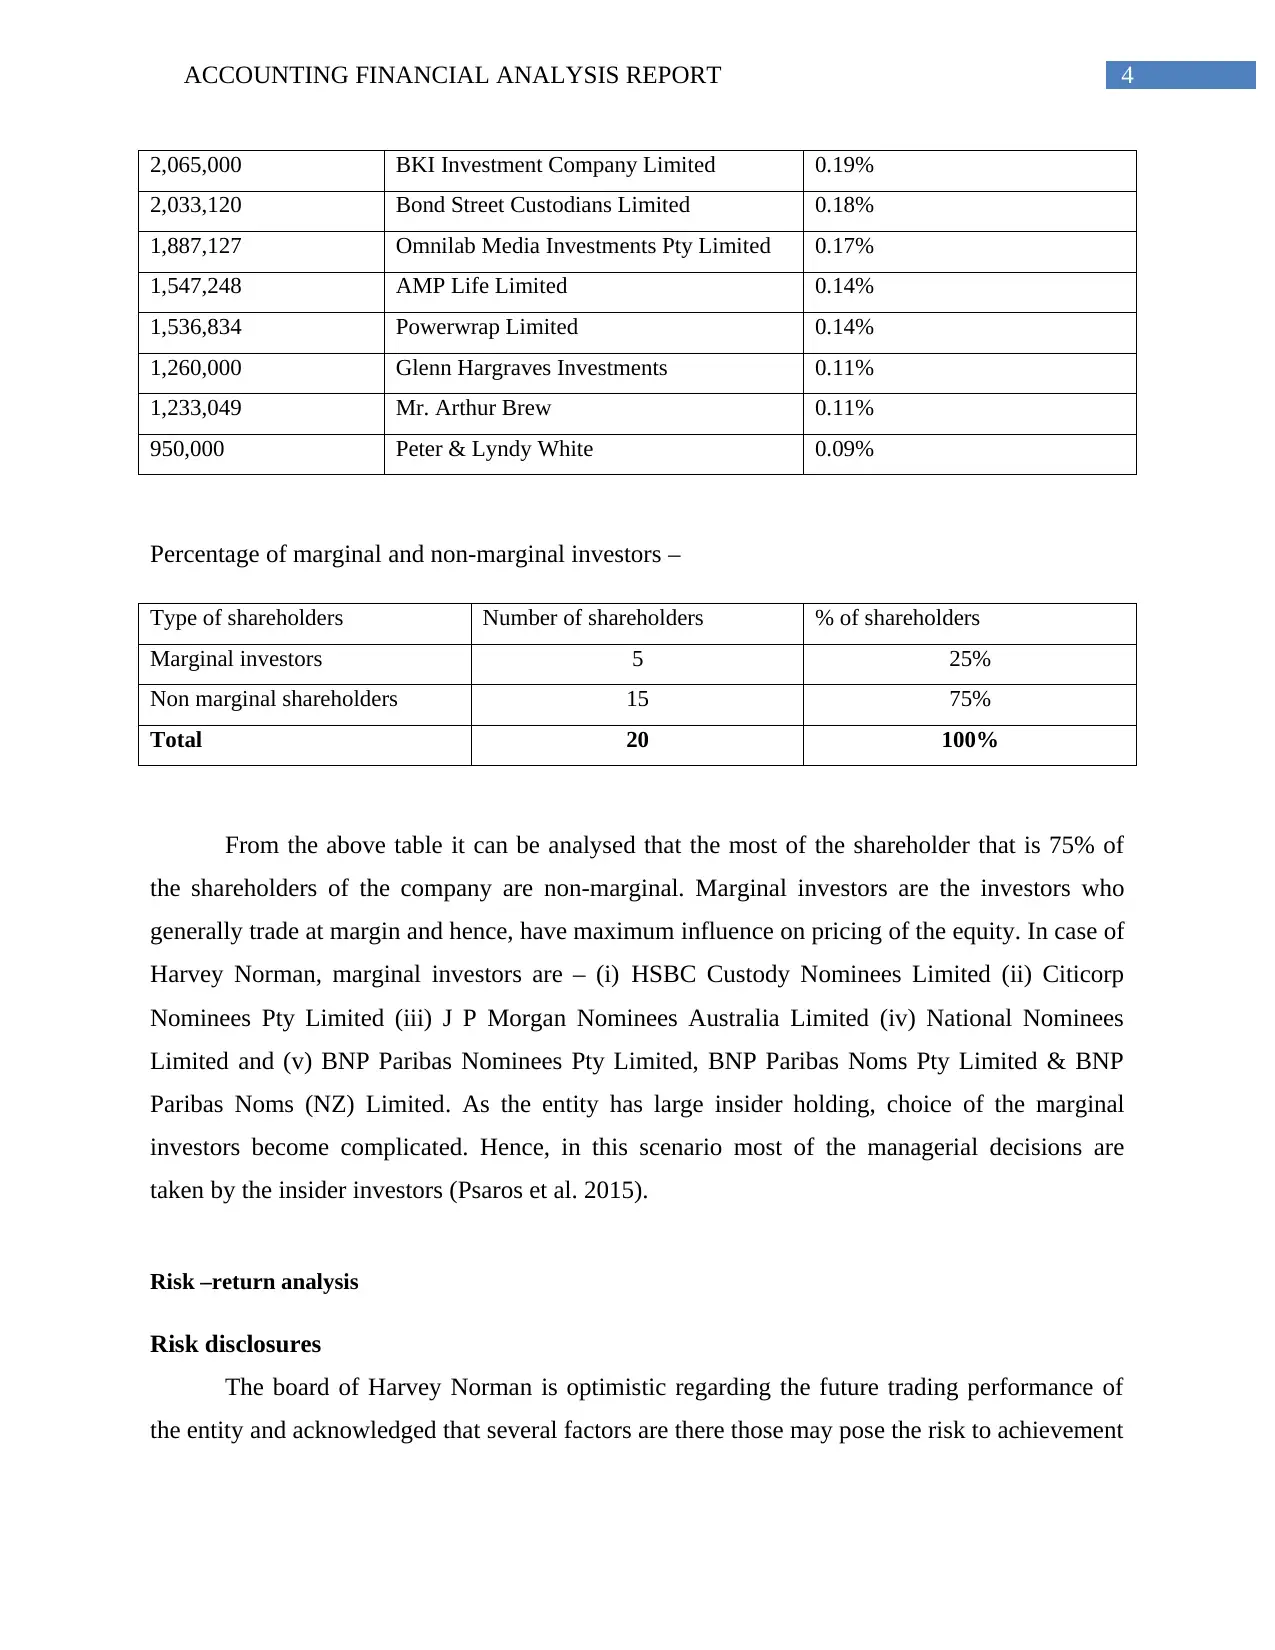
2,065,000 BKI Investment Company Limited 0.19%
2,033,120 Bond Street Custodians Limited 0.18%
1,887,127 Omnilab Media Investments Pty Limited 0.17%
1,547,248 AMP Life Limited 0.14%
1,536,834 Powerwrap Limited 0.14%
1,260,000 Glenn Hargraves Investments 0.11%
1,233,049 Mr. Arthur Brew 0.11%
950,000 Peter & Lyndy White 0.09%
Percentage of marginal and non-marginal investors –
Type of shareholders Number of shareholders % of shareholders
Marginal investors 5 25%
Non marginal shareholders 15 75%
Total 20 100%
From the above table it can be analysed that the most of the shareholder that is 75% of
the shareholders of the company are non-marginal. Marginal investors are the investors who
generally trade at margin and hence, have maximum influence on pricing of the equity. In case of
Harvey Norman, marginal investors are – (i) HSBC Custody Nominees Limited (ii) Citicorp
Nominees Pty Limited (iii) J P Morgan Nominees Australia Limited (iv) National Nominees
Limited and (v) BNP Paribas Nominees Pty Limited, BNP Paribas Noms Pty Limited & BNP
Paribas Noms (NZ) Limited. As the entity has large insider holding, choice of the marginal
investors become complicated. Hence, in this scenario most of the managerial decisions are
taken by the insider investors (Psaros et al. 2015).
Risk –return analysis
Risk disclosures
The board of Harvey Norman is optimistic regarding the future trading performance of
the entity and acknowledged that several factors are there those may pose the risk to achievement
5ACCOUNTING FINANCIAL ANALYSIS REPORT
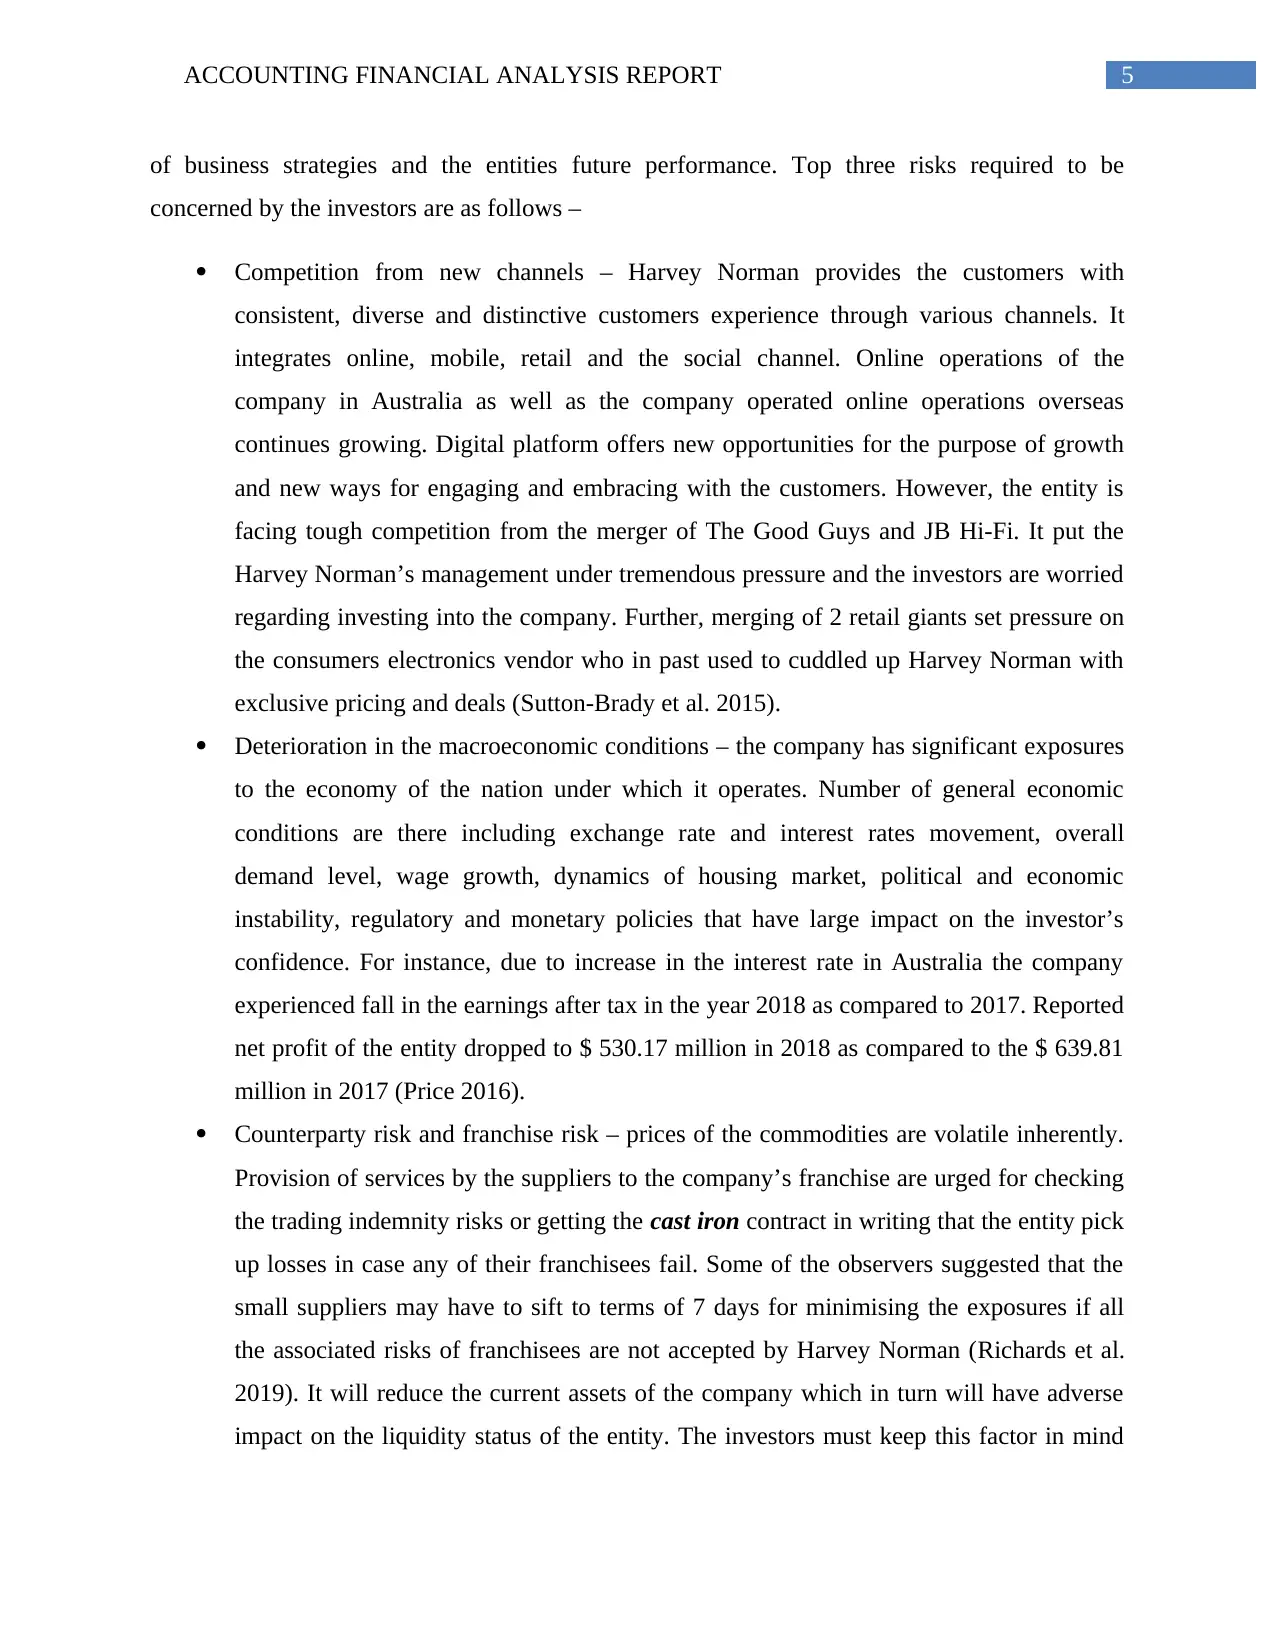
of business strategies and the entities future performance. Top three risks required to be
concerned by the investors are as follows –
Competition from new channels – Harvey Norman provides the customers with
consistent, diverse and distinctive customers experience through various channels. It
integrates online, mobile, retail and the social channel. Online operations of the
company in Australia as well as the company operated online operations overseas
continues growing. Digital platform offers new opportunities for the purpose of growth
and new ways for engaging and embracing with the customers. However, the entity is
facing tough competition from the merger of The Good Guys and JB Hi-Fi. It put the
Harvey Norman’s management under tremendous pressure and the investors are worried
regarding investing into the company. Further, merging of 2 retail giants set pressure on
the consumers electronics vendor who in past used to cuddled up Harvey Norman with
exclusive pricing and deals (Sutton-Brady et al. 2015).
Deterioration in the macroeconomic conditions – the company has significant exposures
to the economy of the nation under which it operates. Number of general economic
conditions are there including exchange rate and interest rates movement, overall
demand level, wage growth, dynamics of housing market, political and economic
instability, regulatory and monetary policies that have large impact on the investor’s
confidence. For instance, due to increase in the interest rate in Australia the company
experienced fall in the earnings after tax in the year 2018 as compared to 2017. Reported
net profit of the entity dropped to $ 530.17 million in 2018 as compared to the $ 639.81
million in 2017 (Price 2016).
Counterparty risk and franchise risk – prices of the commodities are volatile inherently.
Provision of services by the suppliers to the company’s franchise are urged for checking
the trading indemnity risks or getting the cast iron contract in writing that the entity pick
up losses in case any of their franchisees fail. Some of the observers suggested that the
small suppliers may have to sift to terms of 7 days for minimising the exposures if all
the associated risks of franchisees are not accepted by Harvey Norman (Richards et al.
2019). It will reduce the current assets of the company which in turn will have adverse
impact on the liquidity status of the entity. The investors must keep this factor in mind
⊘ This is a preview!⊘
Do you want full access?
Subscribe today to unlock all pages.
Trusted by 1+ million students worldwide
6ACCOUNTING FINANCIAL ANALYSIS REPORT
before investing into the company as deterioration of liquidity status may raise question
on the long term sustainability of the entity (Zakaria et al. 2014).
Return to the shareholders
Opening stock price on 1st July 2017 was $ 3.7147 and the closing price on 30th June 2018
was $ 3.0119. Hence, return on stock price was ($ 3.0119 - $ 3.7147) = - $ 0.7028. Dividend
paid by the company was $ 0.12 each during October 2017 and April 2018. Hence, total returns
= (- $ 0.7028 + $ 0.12 +$ 0.12) = - $ 0.4628 (Harvey Norman Holdings 2019)
On the other hand, if the market return for the one year is considered taking into account
the return provided by All Ordinaries Stock, it can be found that the opening stock price on 1st
July 2017 was $ 5773.90 and the closing price on 30th June 2018 was $ 6366.20. Hence, return
on stock price was $ 6366.20 - $ 5773.90) = - $ 592.3. Hence, it can be recognised that while the
market is providing positive return during the period under concern, Harvey Norman is providing
negative return to its shareholders (Finance.Yahoo.Com 2019)
Capital projects undertaken by the company
During the period under concern the company started the Harvey Norman project for
harnessing the corporate governanceship for highlighting the achievements of the Australian
sportsmanship and providing them with the assistance for achieving the goals and assisting in
creating new pathway for the young women in getting themselves involved in the sports they
love (Harvey Norman Holdings 2019)
Cost of capital guide
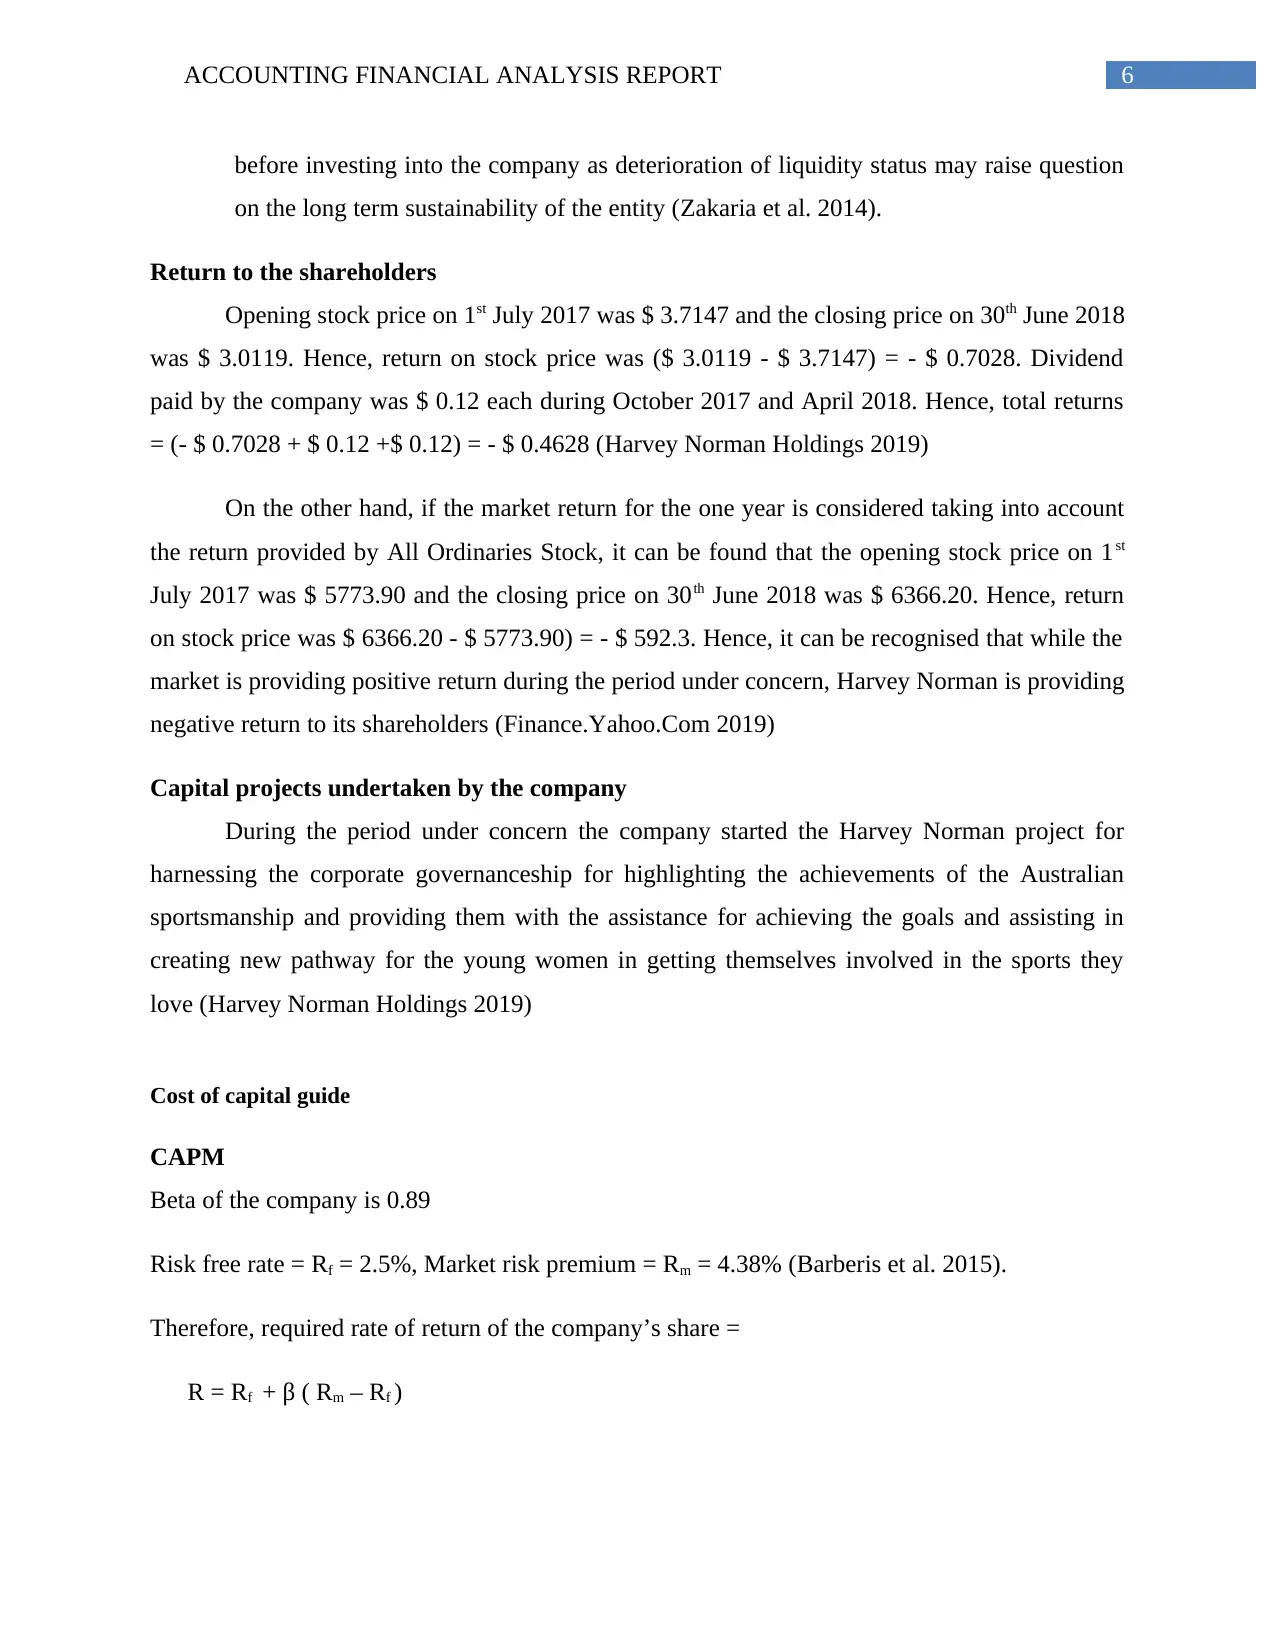
CAPM
Beta of the company is 0.89
Risk free rate = Rf = 2.5%, Market risk premium = Rm = 4.38% (Barberis et al. 2015).
Therefore, required rate of return of the company’s share =
R = Rf + β ( Rm – Rf )
before investing into the company as deterioration of liquidity status may raise question
on the long term sustainability of the entity (Zakaria et al. 2014).
Return to the shareholders
Opening stock price on 1st July 2017 was $ 3.7147 and the closing price on 30th June 2018
was $ 3.0119. Hence, return on stock price was ($ 3.0119 - $ 3.7147) = - $ 0.7028. Dividend
paid by the company was $ 0.12 each during October 2017 and April 2018. Hence, total returns
= (- $ 0.7028 + $ 0.12 +$ 0.12) = - $ 0.4628 (Harvey Norman Holdings 2019)
On the other hand, if the market return for the one year is considered taking into account
the return provided by All Ordinaries Stock, it can be found that the opening stock price on 1st
July 2017 was $ 5773.90 and the closing price on 30th June 2018 was $ 6366.20. Hence, return
on stock price was $ 6366.20 - $ 5773.90) = - $ 592.3. Hence, it can be recognised that while the
market is providing positive return during the period under concern, Harvey Norman is providing
negative return to its shareholders (Finance.Yahoo.Com 2019)
Capital projects undertaken by the company
During the period under concern the company started the Harvey Norman project for
harnessing the corporate governanceship for highlighting the achievements of the Australian
sportsmanship and providing them with the assistance for achieving the goals and assisting in
creating new pathway for the young women in getting themselves involved in the sports they
love (Harvey Norman Holdings 2019)
Cost of capital guide
CAPM
Beta of the company is 0.89
Risk free rate = Rf = 2.5%, Market risk premium = Rm = 4.38% (Barberis et al. 2015).
Therefore, required rate of return of the company’s share =
R = Rf + β ( Rm – Rf )
Paraphrase This Document
Need a fresh take? Get an instant paraphrase of this document with our AI Paraphraser
7ACCOUNTING FINANCIAL ANALYSIS REPORT
Where R = required rate of return, Rf = Risk free rate, Rm = Market risk premium and β =
Beta. Therefore,
R = 2.5% + 0.89* (4.38% – 2.5%) = 4.1732%
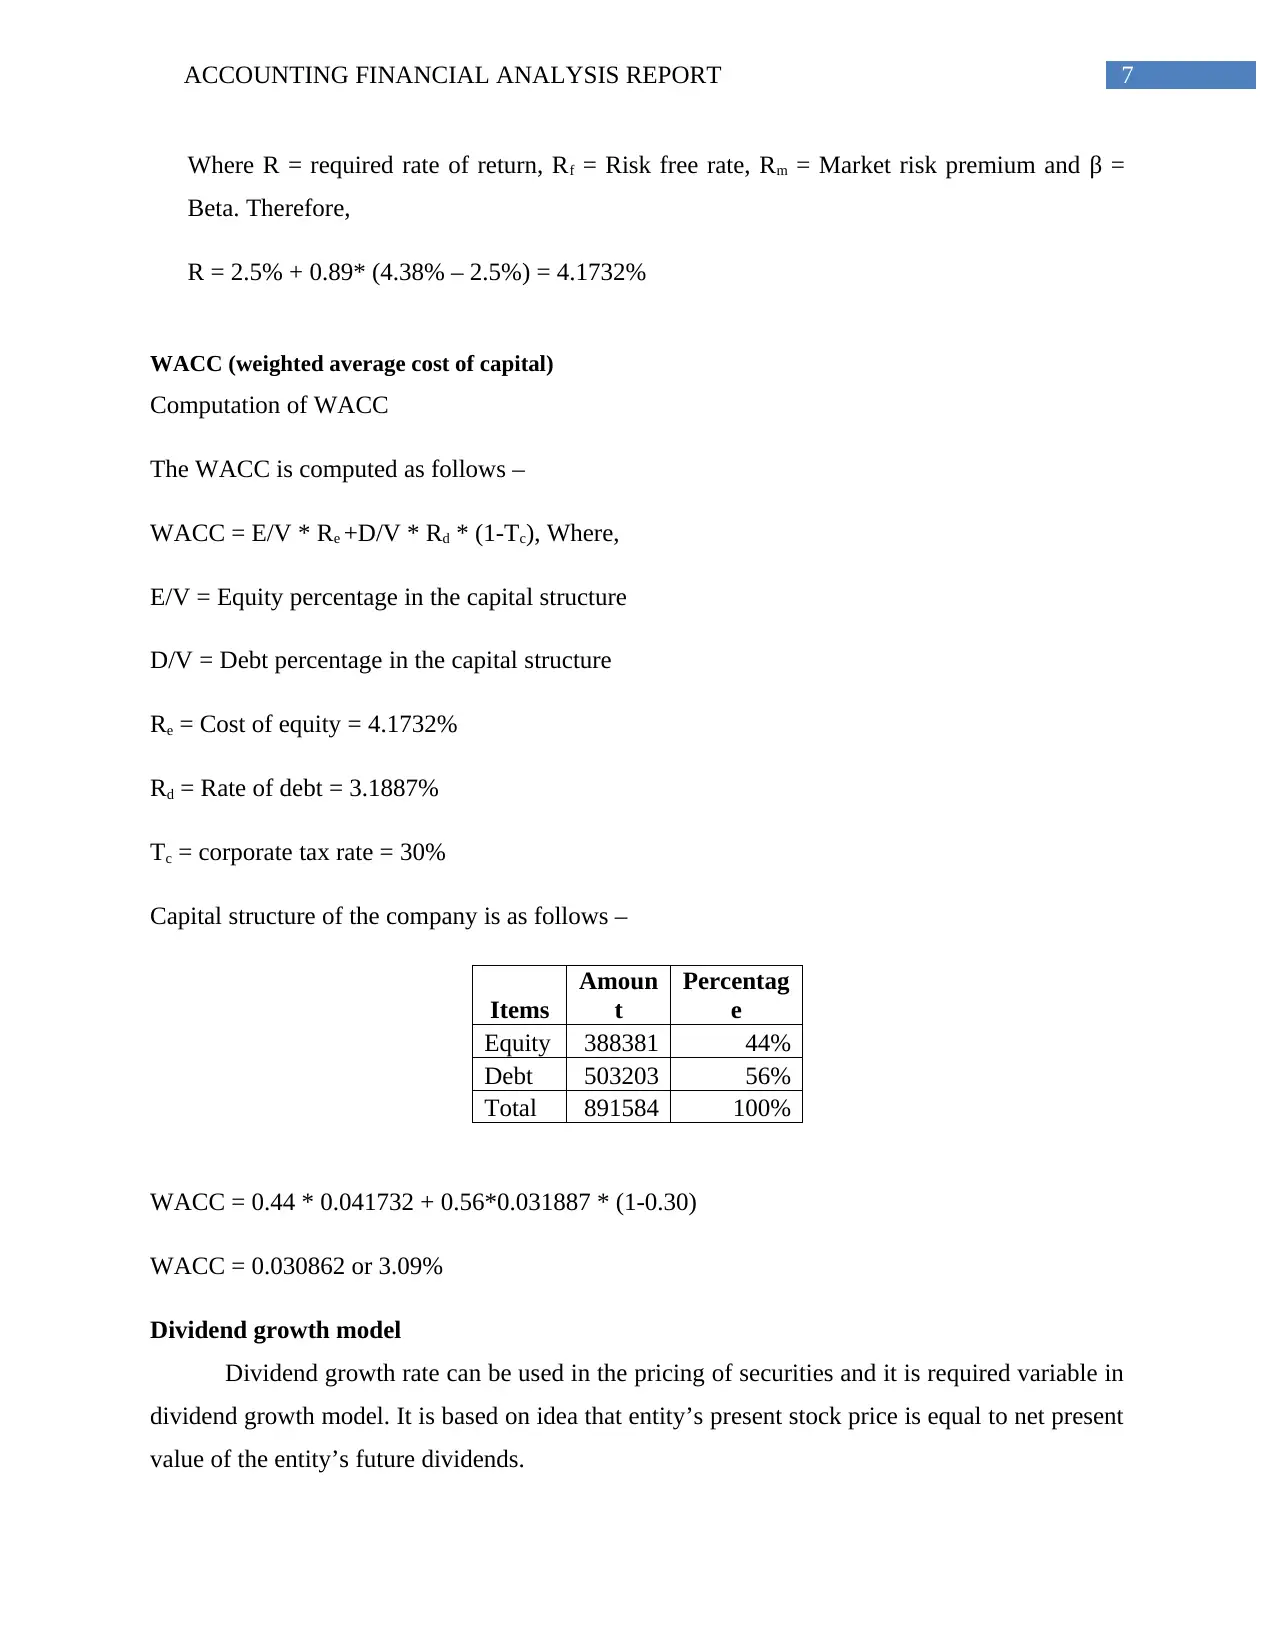
WACC (weighted average cost of capital)
Computation of WACC
The WACC is computed as follows –
WACC = E/V * Re +D/V * Rd * (1-Tc), Where,
E/V = Equity percentage in the capital structure
D/V = Debt percentage in the capital structure
Re = Cost of equity = 4.1732%
Rd = Rate of debt = 3.1887%
Tc = corporate tax rate = 30%
Capital structure of the company is as follows –
Items
Amoun
t
Percentag
e
Equity 388381 44%
Debt 503203 56%
Total 891584 100%
WACC = 0.44 * 0.041732 + 0.56*0.031887 * (1-0.30)
WACC = 0.030862 or 3.09%
Dividend growth model
Dividend growth rate can be used in the pricing of securities and it is required variable in
dividend growth model. It is based on idea that entity’s present stock price is equal to net present
value of the entity’s future dividends.
Where R = required rate of return, Rf = Risk free rate, Rm = Market risk premium and β =
Beta. Therefore,
R = 2.5% + 0.89* (4.38% – 2.5%) = 4.1732%
WACC (weighted average cost of capital)
Computation of WACC
The WACC is computed as follows –
WACC = E/V * Re +D/V * Rd * (1-Tc), Where,
E/V = Equity percentage in the capital structure
D/V = Debt percentage in the capital structure
Re = Cost of equity = 4.1732%
Rd = Rate of debt = 3.1887%
Tc = corporate tax rate = 30%
Capital structure of the company is as follows –
Items
Amoun
t
Percentag
e
Equity 388381 44%
Debt 503203 56%
Total 891584 100%
WACC = 0.44 * 0.041732 + 0.56*0.031887 * (1-0.30)
WACC = 0.030862 or 3.09%
Dividend growth model
Dividend growth rate can be used in the pricing of securities and it is required variable in
dividend growth model. It is based on idea that entity’s present stock price is equal to net present
value of the entity’s future dividends.
8ACCOUNTING FINANCIAL ANALYSIS REPORT
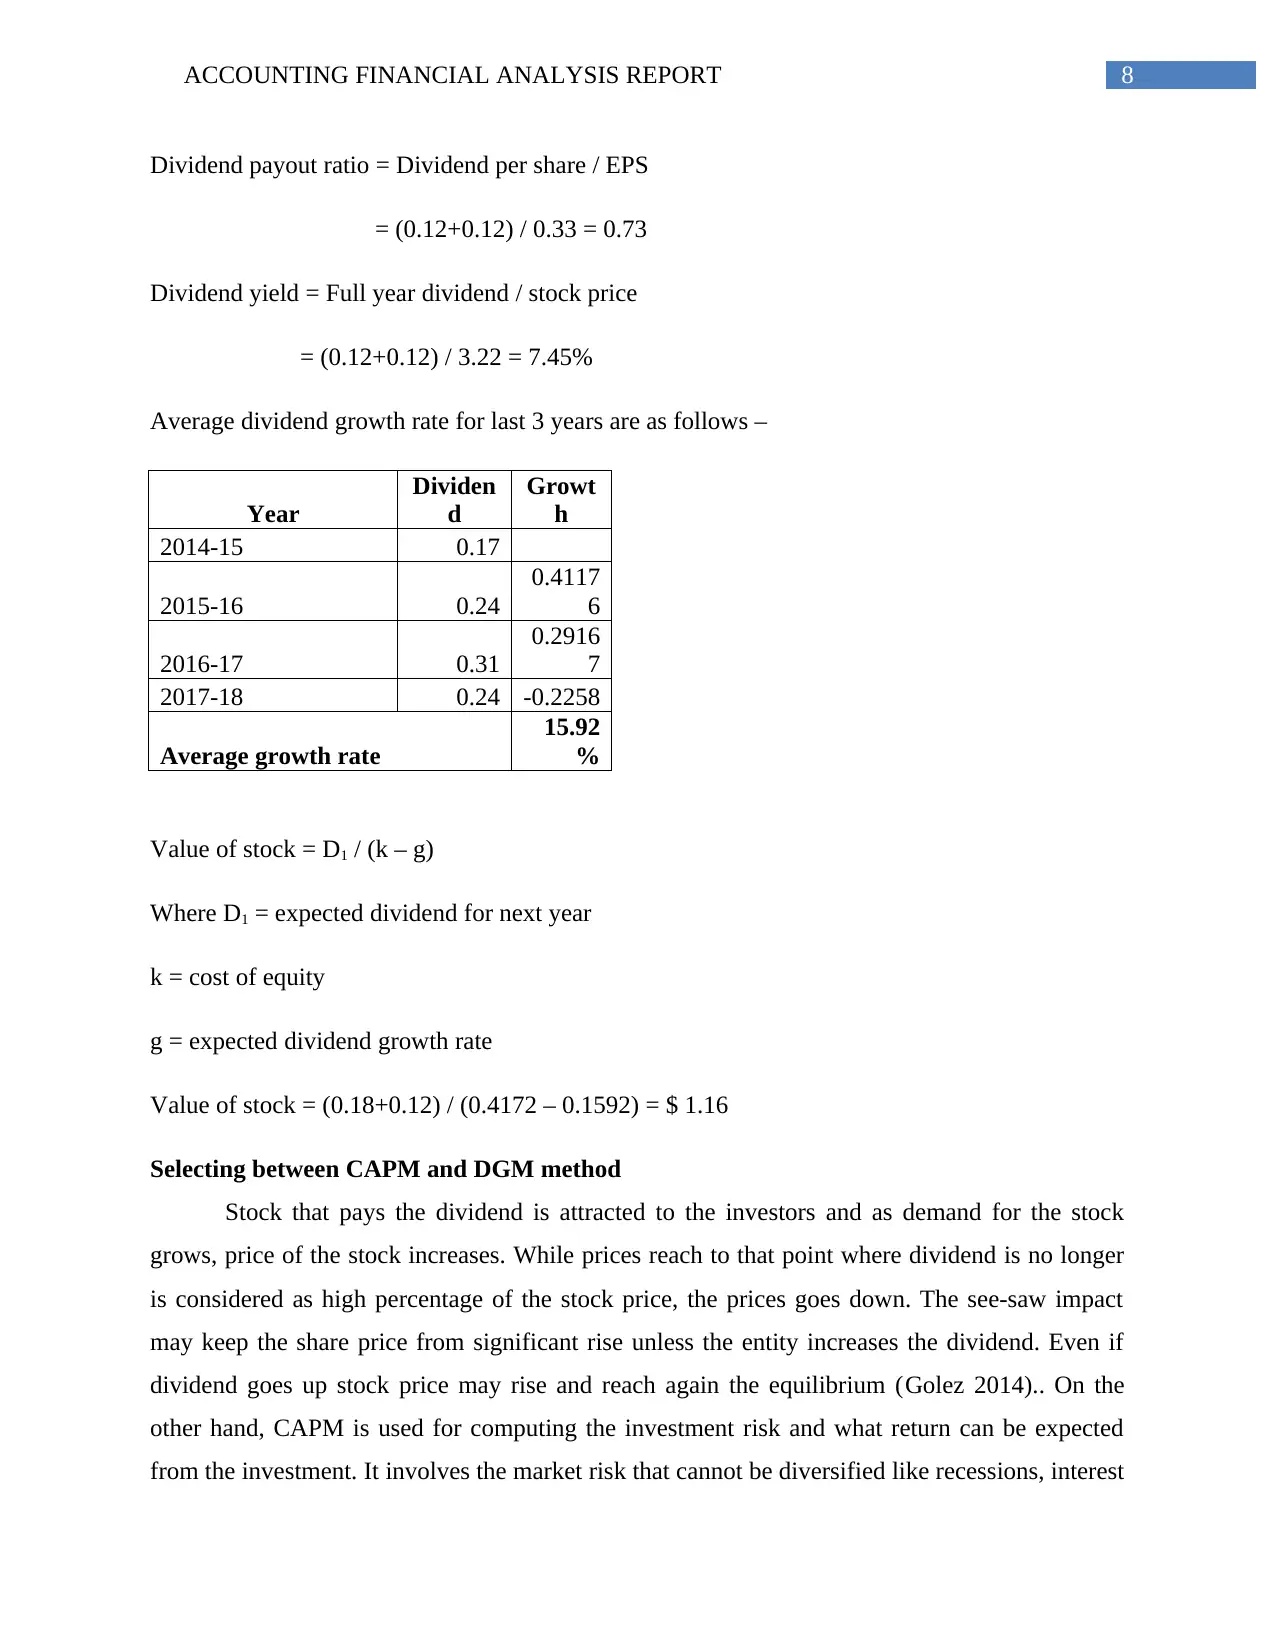
Dividend payout ratio = Dividend per share / EPS
= (0.12+0.12) / 0.33 = 0.73
Dividend yield = Full year dividend / stock price
= (0.12+0.12) / 3.22 = 7.45%
Average dividend growth rate for last 3 years are as follows –
Year
Dividen
d
Growt
h
2014-15 0.17
2015-16 0.24
0.4117
6
2016-17 0.31
0.2916
7
2017-18 0.24 -0.2258
Average growth rate
15.92
%
Value of stock = D1 / (k – g)
Where D1 = expected dividend for next year
k = cost of equity
g = expected dividend growth rate
Value of stock = (0.18+0.12) / (0.4172 – 0.1592) = $ 1.16
Selecting between CAPM and DGM method
Stock that pays the dividend is attracted to the investors and as demand for the stock
grows, price of the stock increases. While prices reach to that point where dividend is no longer
is considered as high percentage of the stock price, the prices goes down. The see-saw impact
may keep the share price from significant rise unless the entity increases the dividend. Even if
dividend goes up stock price may rise and reach again the equilibrium (Golez 2014).. On the
other hand, CAPM is used for computing the investment risk and what return can be expected
from the investment. It involves the market risk that cannot be diversified like recessions, interest
⊘ This is a preview!⊘
Do you want full access?
Subscribe today to unlock all pages.
Trusted by 1+ million students worldwide
9ACCOUNTING FINANCIAL ANALYSIS REPORT
rates and political issues. Apart from that it further involves risks related to individual stocks that
represents component of return on stock and it is not associated with the movements in the
general market (Zabarankin et al. 2014). Hence, if both are compared, it is seemed that the DGM
method is more appropriate as it involves the decision of the company at which percentage it will
provide dividend. However, in CAPM some of the systematic risks are involved those are not in
control of the company and hence, it has no control on the cost of equity and pricing.
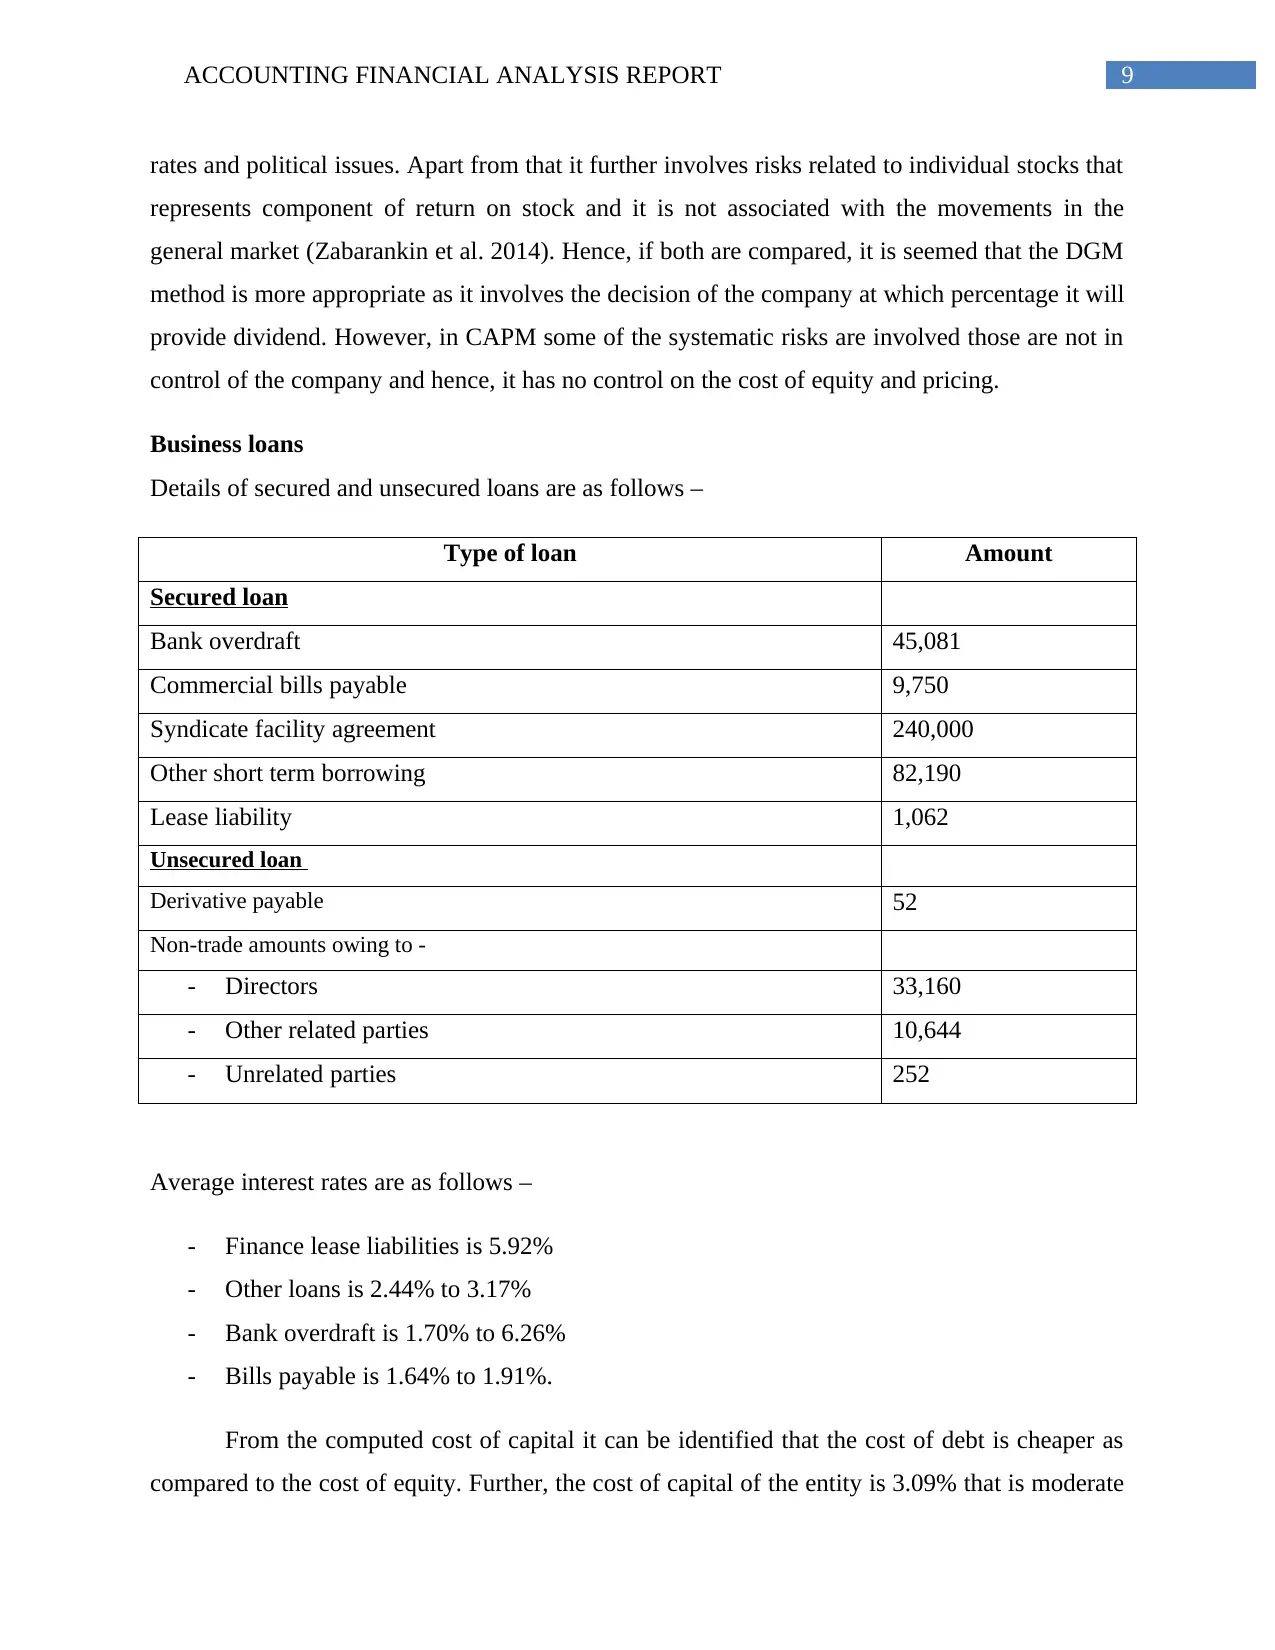
Business loans
Details of secured and unsecured loans are as follows –
Type of loan Amount
Secured loan
Bank overdraft 45,081
Commercial bills payable 9,750
Syndicate facility agreement 240,000
Other short term borrowing 82,190
Lease liability 1,062
Unsecured loan
Derivative payable 52
Non-trade amounts owing to -
- Directors 33,160
- Other related parties 10,644
- Unrelated parties 252
Average interest rates are as follows –
- Finance lease liabilities is 5.92%
- Other loans is 2.44% to 3.17%
- Bank overdraft is 1.70% to 6.26%
- Bills payable is 1.64% to 1.91%.
From the computed cost of capital it can be identified that the cost of debt is cheaper as
compared to the cost of equity. Further, the cost of capital of the entity is 3.09% that is moderate
rates and political issues. Apart from that it further involves risks related to individual stocks that
represents component of return on stock and it is not associated with the movements in the
general market (Zabarankin et al. 2014). Hence, if both are compared, it is seemed that the DGM
method is more appropriate as it involves the decision of the company at which percentage it will
provide dividend. However, in CAPM some of the systematic risks are involved those are not in
control of the company and hence, it has no control on the cost of equity and pricing.
Business loans
Details of secured and unsecured loans are as follows –
Type of loan Amount
Secured loan
Bank overdraft 45,081
Commercial bills payable 9,750
Syndicate facility agreement 240,000
Other short term borrowing 82,190
Lease liability 1,062
Unsecured loan
Derivative payable 52
Non-trade amounts owing to -
- Directors 33,160
- Other related parties 10,644
- Unrelated parties 252
Average interest rates are as follows –
- Finance lease liabilities is 5.92%
- Other loans is 2.44% to 3.17%
- Bank overdraft is 1.70% to 6.26%
- Bills payable is 1.64% to 1.91%.
From the computed cost of capital it can be identified that the cost of debt is cheaper as
compared to the cost of equity. Further, the cost of capital of the entity is 3.09% that is moderate
Paraphrase This Document
Need a fresh take? Get an instant paraphrase of this document with our AI Paraphraser
10ACCOUNTING FINANCIAL ANALYSIS REPORT
considering the market rate. Hence, the company can raise new funds for financing the ongouing
projects.
Financial statement analysis
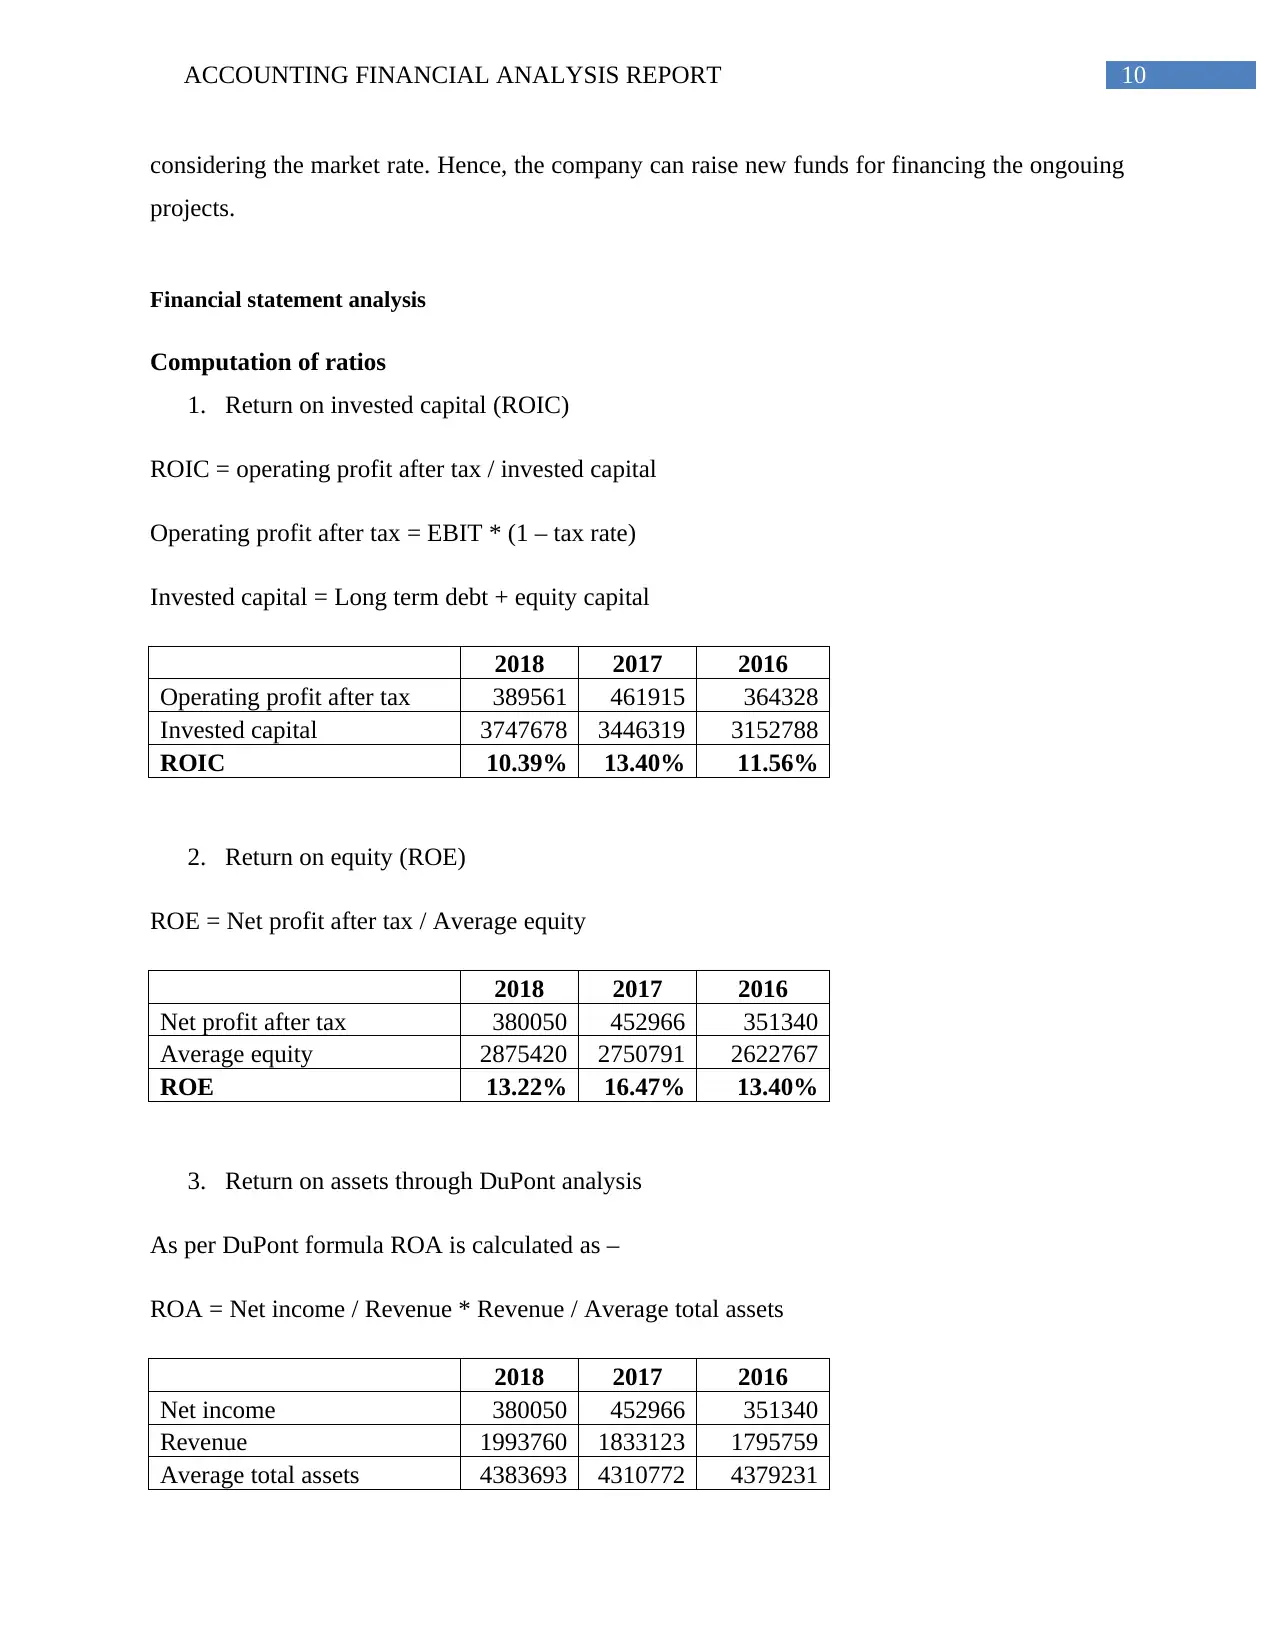
Computation of ratios
1. Return on invested capital (ROIC)
ROIC = operating profit after tax / invested capital
Operating profit after tax = EBIT * (1 – tax rate)
Invested capital = Long term debt + equity capital
2018 2017 2016
Operating profit after tax 389561 461915 364328
Invested capital 3747678 3446319 3152788
ROIC 10.39% 13.40% 11.56%
2. Return on equity (ROE)
ROE = Net profit after tax / Average equity
2018 2017 2016
Net profit after tax 380050 452966 351340
Average equity 2875420 2750791 2622767
ROE 13.22% 16.47% 13.40%
3. Return on assets through DuPont analysis
As per DuPont formula ROA is calculated as –
ROA = Net income / Revenue * Revenue / Average total assets
2018 2017 2016
Net income 380050 452966 351340
Revenue 1993760 1833123 1795759
Average total assets 4383693 4310772 4379231
considering the market rate. Hence, the company can raise new funds for financing the ongouing
projects.
Financial statement analysis
Computation of ratios
1. Return on invested capital (ROIC)
ROIC = operating profit after tax / invested capital
Operating profit after tax = EBIT * (1 – tax rate)
Invested capital = Long term debt + equity capital
2018 2017 2016
Operating profit after tax 389561 461915 364328
Invested capital 3747678 3446319 3152788
ROIC 10.39% 13.40% 11.56%
2. Return on equity (ROE)
ROE = Net profit after tax / Average equity
2018 2017 2016
Net profit after tax 380050 452966 351340
Average equity 2875420 2750791 2622767
ROE 13.22% 16.47% 13.40%
3. Return on assets through DuPont analysis
As per DuPont formula ROA is calculated as –
ROA = Net income / Revenue * Revenue / Average total assets
2018 2017 2016
Net income 380050 452966 351340
Revenue 1993760 1833123 1795759
Average total assets 4383693 4310772 4379231
11ACCOUNTING FINANCIAL ANALYSIS REPORT
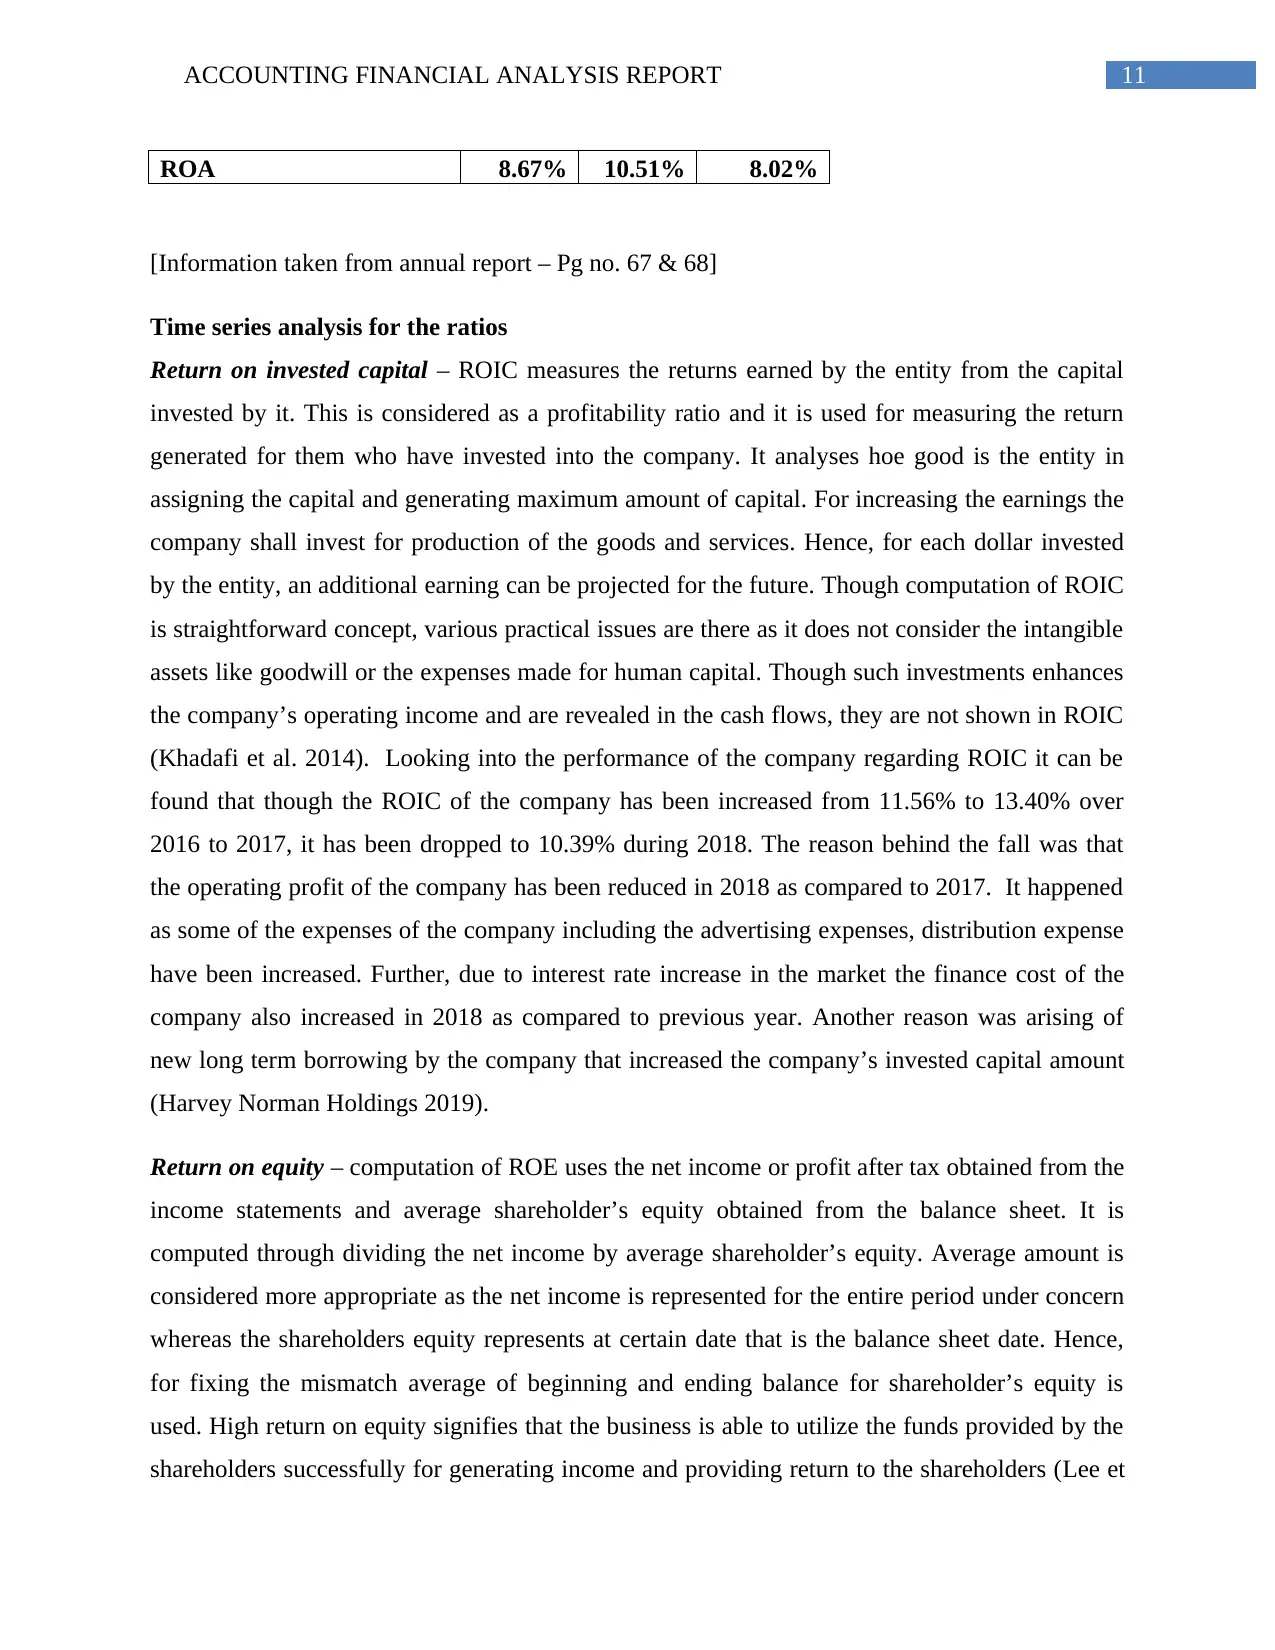
ROA 8.67% 10.51% 8.02%
[Information taken from annual report – Pg no. 67 & 68]
Time series analysis for the ratios
Return on invested capital – ROIC measures the returns earned by the entity from the capital
invested by it. This is considered as a profitability ratio and it is used for measuring the return
generated for them who have invested into the company. It analyses hoe good is the entity in
assigning the capital and generating maximum amount of capital. For increasing the earnings the
company shall invest for production of the goods and services. Hence, for each dollar invested
by the entity, an additional earning can be projected for the future. Though computation of ROIC
is straightforward concept, various practical issues are there as it does not consider the intangible
assets like goodwill or the expenses made for human capital. Though such investments enhances
the company’s operating income and are revealed in the cash flows, they are not shown in ROIC
(Khadafi et al. 2014). Looking into the performance of the company regarding ROIC it can be
found that though the ROIC of the company has been increased from 11.56% to 13.40% over
2016 to 2017, it has been dropped to 10.39% during 2018. The reason behind the fall was that
the operating profit of the company has been reduced in 2018 as compared to 2017. It happened
as some of the expenses of the company including the advertising expenses, distribution expense
have been increased. Further, due to interest rate increase in the market the finance cost of the
company also increased in 2018 as compared to previous year. Another reason was arising of
new long term borrowing by the company that increased the company’s invested capital amount
(Harvey Norman Holdings 2019).
Return on equity – computation of ROE uses the net income or profit after tax obtained from the
income statements and average shareholder’s equity obtained from the balance sheet. It is
computed through dividing the net income by average shareholder’s equity. Average amount is
considered more appropriate as the net income is represented for the entire period under concern
whereas the shareholders equity represents at certain date that is the balance sheet date. Hence,
for fixing the mismatch average of beginning and ending balance for shareholder’s equity is
used. High return on equity signifies that the business is able to utilize the funds provided by the
shareholders successfully for generating income and providing return to the shareholders (Lee et
⊘ This is a preview!⊘
Do you want full access?
Subscribe today to unlock all pages.
Trusted by 1+ million students worldwide
1 out of 17
Related Documents


Your All-in-One AI-Powered Toolkit for Academic Success.
+13062052269
info@desklib.com
Available 24*7 on WhatsApp / Email
![[object Object]](/_next/static/media/star-bottom.7253800d.svg)
Unlock your academic potential
Copyright © 2020–2026 A2Z Services. All Rights Reserved. Developed and managed by ZUCOL.