Financial Performance Analysis: Harvey Norman Holdings Limited Report
VerifiedAdded on 2023/01/04
|14
|3089
|68
Report
AI Summary
This report provides a comprehensive financial analysis of Harvey Norman Holdings Limited, evaluating its performance over a five-year period. The analysis focuses on key financial ratios, including profitability ratios (operating profit margin, net profit margin), operating efficiency ratios (asset turnover, working capital turnover), liquidity and solvency ratios (current ratio, quick ratio), and market performance ratios (earnings per share). The report examines trends, identifies changes in the company's financial performance, and discusses the factors influencing these changes, such as inflation, customer preferences, and foreign exchange fluctuations. The analysis is based on data extracted from the company's annual reports and aims to assess the company's financial standing and provide insights into its performance in the market.
Running head: ANALYSIS AND INTERPRETATION OF THE PERFORMANCE OF
HARVEY NORMAN HOLDINGS LIMITED
ANALYSIS AND INTERPRETATION OF THE PERFORMANCE OF HARVEY
NORMAN HOLDINGS LIMITED
Name of the Student:
Name of the University:
Author Note
HARVEY NORMAN HOLDINGS LIMITED
ANALYSIS AND INTERPRETATION OF THE PERFORMANCE OF HARVEY
NORMAN HOLDINGS LIMITED
Name of the Student:
Name of the University:
Author Note
Paraphrase This Document
Need a fresh take? Get an instant paraphrase of this document with our AI Paraphraser
1
ANALYSIS AND INTERPRETATION OF THE PERFORMANCE OF HARVEY
NORMAN HOLDINGS LIMITED
ANALYSIS AND INTERPRETATION OF THE PERFORMANCE OF HARVEY
NORMAN HOLDINGS LIMITED
2
ANALYSIS AND INTERPRETATION OF THE PERFORMANCE OF HARVEY
NORMAN HOLDINGS LIMITED
Table of Contents
Introduction................................................................................................................................3
Discussion..................................................................................................................................4
Profitability ratio....................................................................................................................4
Operating Efficiency Ratio....................................................................................................6
Liquidity and Solvency ratio..................................................................................................7
Market performance ratio.......................................................................................................9
Conclusion................................................................................................................................10
References................................................................................................................................11
⊘ This is a preview!⊘
Do you want full access?
Subscribe today to unlock all pages.
Trusted by 1+ million students worldwide
3
ANALYSIS AND INTERPRETATION OF THE PERFORMANCE OF HARVEY
NORMAN HOLDINGS LIMITED
Introduction
The report titled “Analysis And Interpretation Of The Performance Of Harvey
Norman Holdings Limited” is prepped to analyse the financial performance of the Harvey
Norman Holding Limited. The report calculates and analyse the financial ratios of the
selected company for the last five years. The report identifies the changes in the performance
of the company in the last five years and the causes of such change. The key financing ratios
that is taken into consideration are liquidity, profitability, and efficiency and performance
ratio. The main objective of the report is to identify the changes made in the financial
performance of the Harvey Norman Holding Limited in last five years and their causes.
The selected company for this report is Harvey Norman Holding Limited. This is
multination company of Australia, listed in the Australian Security Exchange limited. The
head office of the company is situated in New South Wales, Australia. The company involves
in the integrated retail, property, franchise and digital enterprise. The company operates
under the franchise system in Australia and consistently delivers an unparalleled retail
offering to Australian consumers with an extensive product range, technology and market
leadership in key product categories. The company grants the franchises under the three
brand named Harvey Norman, Domayne and Joyce Mayne (Harvey Norman Holdings. 2019).
Apart from the Australia, the company is promissory present in Slovenia and Croatia,
Singapore and Malaysia, Ireland and Northern Ireland and New Zealand with their franchises.
Paraphrase This Document
Need a fresh take? Get an instant paraphrase of this document with our AI Paraphraser
4
ANALYSIS AND INTERPRETATION OF THE PERFORMANCE OF HARVEY
NORMAN HOLDINGS LIMITED
Discussion
Financial Analysis
To analyse the financial performance of the Harvey Norman Holdings Limited the
report perform the ratio analysis of the firm for the last five year. The data used the in
calculation of the financial ratio is taken from the annual report of the company. The
following are the ratios that analyse the financial performance of the firm and the changes
made in the financial performance of the firm in the last five years.
Profitability ratio
The profitability ratio of any firm shows the profit earning capacity of the firm by
using the available resources. This also help to understand the impact of the management
decision in the profitability of the firm. The investors and the other stakeholders used this
information to determine the future performance of the company is respect of the profitability
(O’Neill, Sohal and Teng 2016). Here, the following two-profitability ratio is consider
analysing the profitability of the firm.
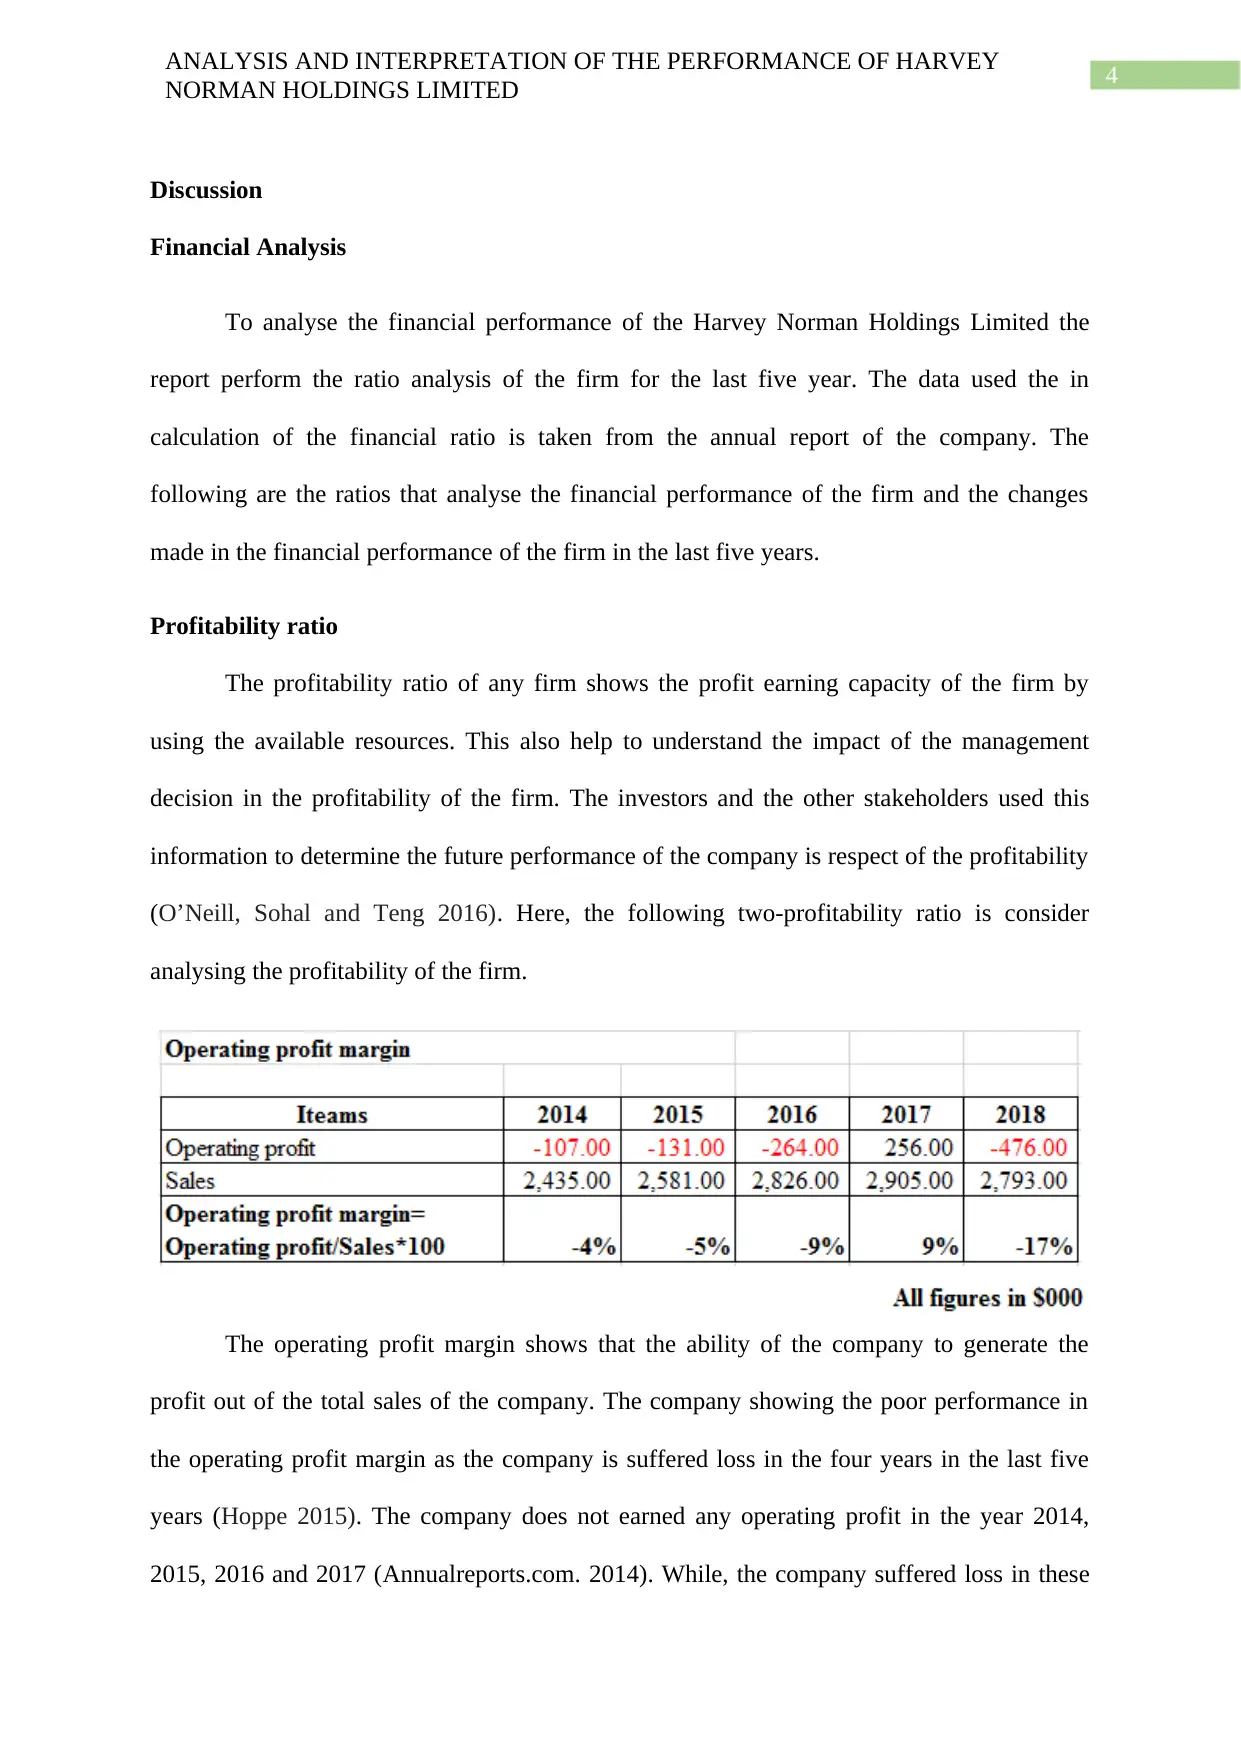
The operating profit margin shows that the ability of the company to generate the
profit out of the total sales of the company. The company showing the poor performance in
the operating profit margin as the company is suffered loss in the four years in the last five
years (Hoppe 2015). The company does not earned any operating profit in the year 2014,
2015, 2016 and 2017 (Annualreports.com. 2014). While, the company suffered loss in these
ANALYSIS AND INTERPRETATION OF THE PERFORMANCE OF HARVEY
NORMAN HOLDINGS LIMITED
Discussion
Financial Analysis
To analyse the financial performance of the Harvey Norman Holdings Limited the
report perform the ratio analysis of the firm for the last five year. The data used the in
calculation of the financial ratio is taken from the annual report of the company. The
following are the ratios that analyse the financial performance of the firm and the changes
made in the financial performance of the firm in the last five years.
Profitability ratio
The profitability ratio of any firm shows the profit earning capacity of the firm by
using the available resources. This also help to understand the impact of the management
decision in the profitability of the firm. The investors and the other stakeholders used this
information to determine the future performance of the company is respect of the profitability
(O’Neill, Sohal and Teng 2016). Here, the following two-profitability ratio is consider
analysing the profitability of the firm.
The operating profit margin shows that the ability of the company to generate the
profit out of the total sales of the company. The company showing the poor performance in
the operating profit margin as the company is suffered loss in the four years in the last five
years (Hoppe 2015). The company does not earned any operating profit in the year 2014,
2015, 2016 and 2017 (Annualreports.com. 2014). While, the company suffered loss in these
5
ANALYSIS AND INTERPRETATION OF THE PERFORMANCE OF HARVEY
NORMAN HOLDINGS LIMITED
years as per the data available in the annual report of the company. So, the gross profit
margin cannot be determined the in those years instead the company has the gross loss
margin in such years. The main reason behind this loss is the high rate of the inflation, which
decreases the purchasing power of the customers. As results the sale of the company is
decreased while the expenses associated with the sale is increased, in result the company
suffered the loss (Wahyu and Mahfud 2018). The 2017 is only years in which the company
earned the operating profit and the margin of the operating profit was 9%. This margin is low
compared to the other company of the same industry but considerable.
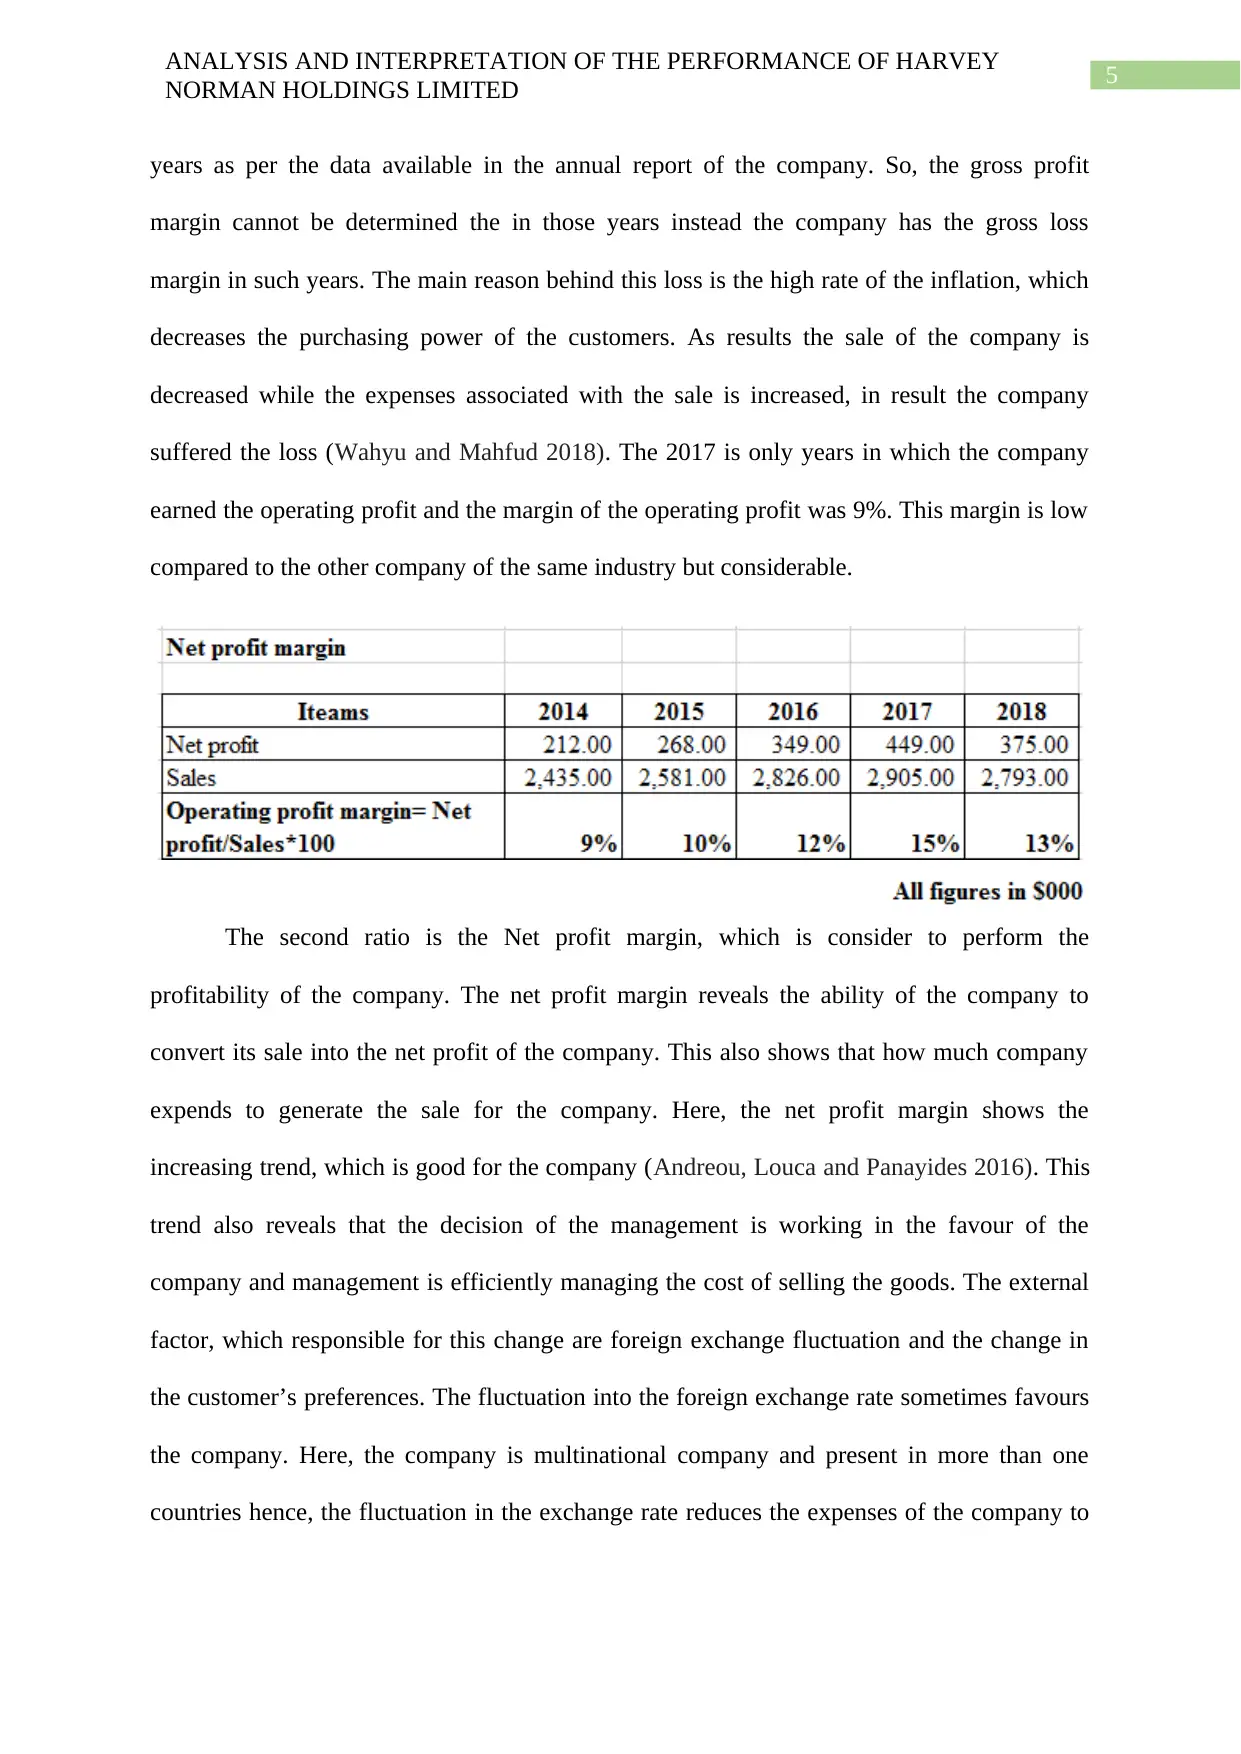
The second ratio is the Net profit margin, which is consider to perform the
profitability of the company. The net profit margin reveals the ability of the company to
convert its sale into the net profit of the company. This also shows that how much company
expends to generate the sale for the company. Here, the net profit margin shows the
increasing trend, which is good for the company (Andreou, Louca and Panayides 2016). This
trend also reveals that the decision of the management is working in the favour of the
company and management is efficiently managing the cost of selling the goods. The external
factor, which responsible for this change are foreign exchange fluctuation and the change in
the customer’s preferences. The fluctuation into the foreign exchange rate sometimes favours
the company. Here, the company is multinational company and present in more than one
countries hence, the fluctuation in the exchange rate reduces the expenses of the company to
ANALYSIS AND INTERPRETATION OF THE PERFORMANCE OF HARVEY
NORMAN HOLDINGS LIMITED
years as per the data available in the annual report of the company. So, the gross profit
margin cannot be determined the in those years instead the company has the gross loss
margin in such years. The main reason behind this loss is the high rate of the inflation, which
decreases the purchasing power of the customers. As results the sale of the company is
decreased while the expenses associated with the sale is increased, in result the company
suffered the loss (Wahyu and Mahfud 2018). The 2017 is only years in which the company
earned the operating profit and the margin of the operating profit was 9%. This margin is low
compared to the other company of the same industry but considerable.
The second ratio is the Net profit margin, which is consider to perform the
profitability of the company. The net profit margin reveals the ability of the company to
convert its sale into the net profit of the company. This also shows that how much company
expends to generate the sale for the company. Here, the net profit margin shows the
increasing trend, which is good for the company (Andreou, Louca and Panayides 2016). This
trend also reveals that the decision of the management is working in the favour of the
company and management is efficiently managing the cost of selling the goods. The external
factor, which responsible for this change are foreign exchange fluctuation and the change in
the customer’s preferences. The fluctuation into the foreign exchange rate sometimes favours
the company. Here, the company is multinational company and present in more than one
countries hence, the fluctuation in the exchange rate reduces the expenses of the company to
⊘ This is a preview!⊘
Do you want full access?
Subscribe today to unlock all pages.
Trusted by 1+ million students worldwide
6
ANALYSIS AND INTERPRETATION OF THE PERFORMANCE OF HARVEY
NORMAN HOLDINGS LIMITED
generate the sale. The other one is that the change in the customer’s preference that increase
the demand of the product offered by the firm among the customers.
Operating Efficiency Ratio
The operating efficiency ratio of the company reveals that how efficiently the
company managing the operations of the firm. This shows the ability of the management to
run the business of the company and efficiency of the management in respect of this. To
measure the efficiency of the Harvey Norman Holdings Limited company, this report
consider the followings efficiency ratios:-
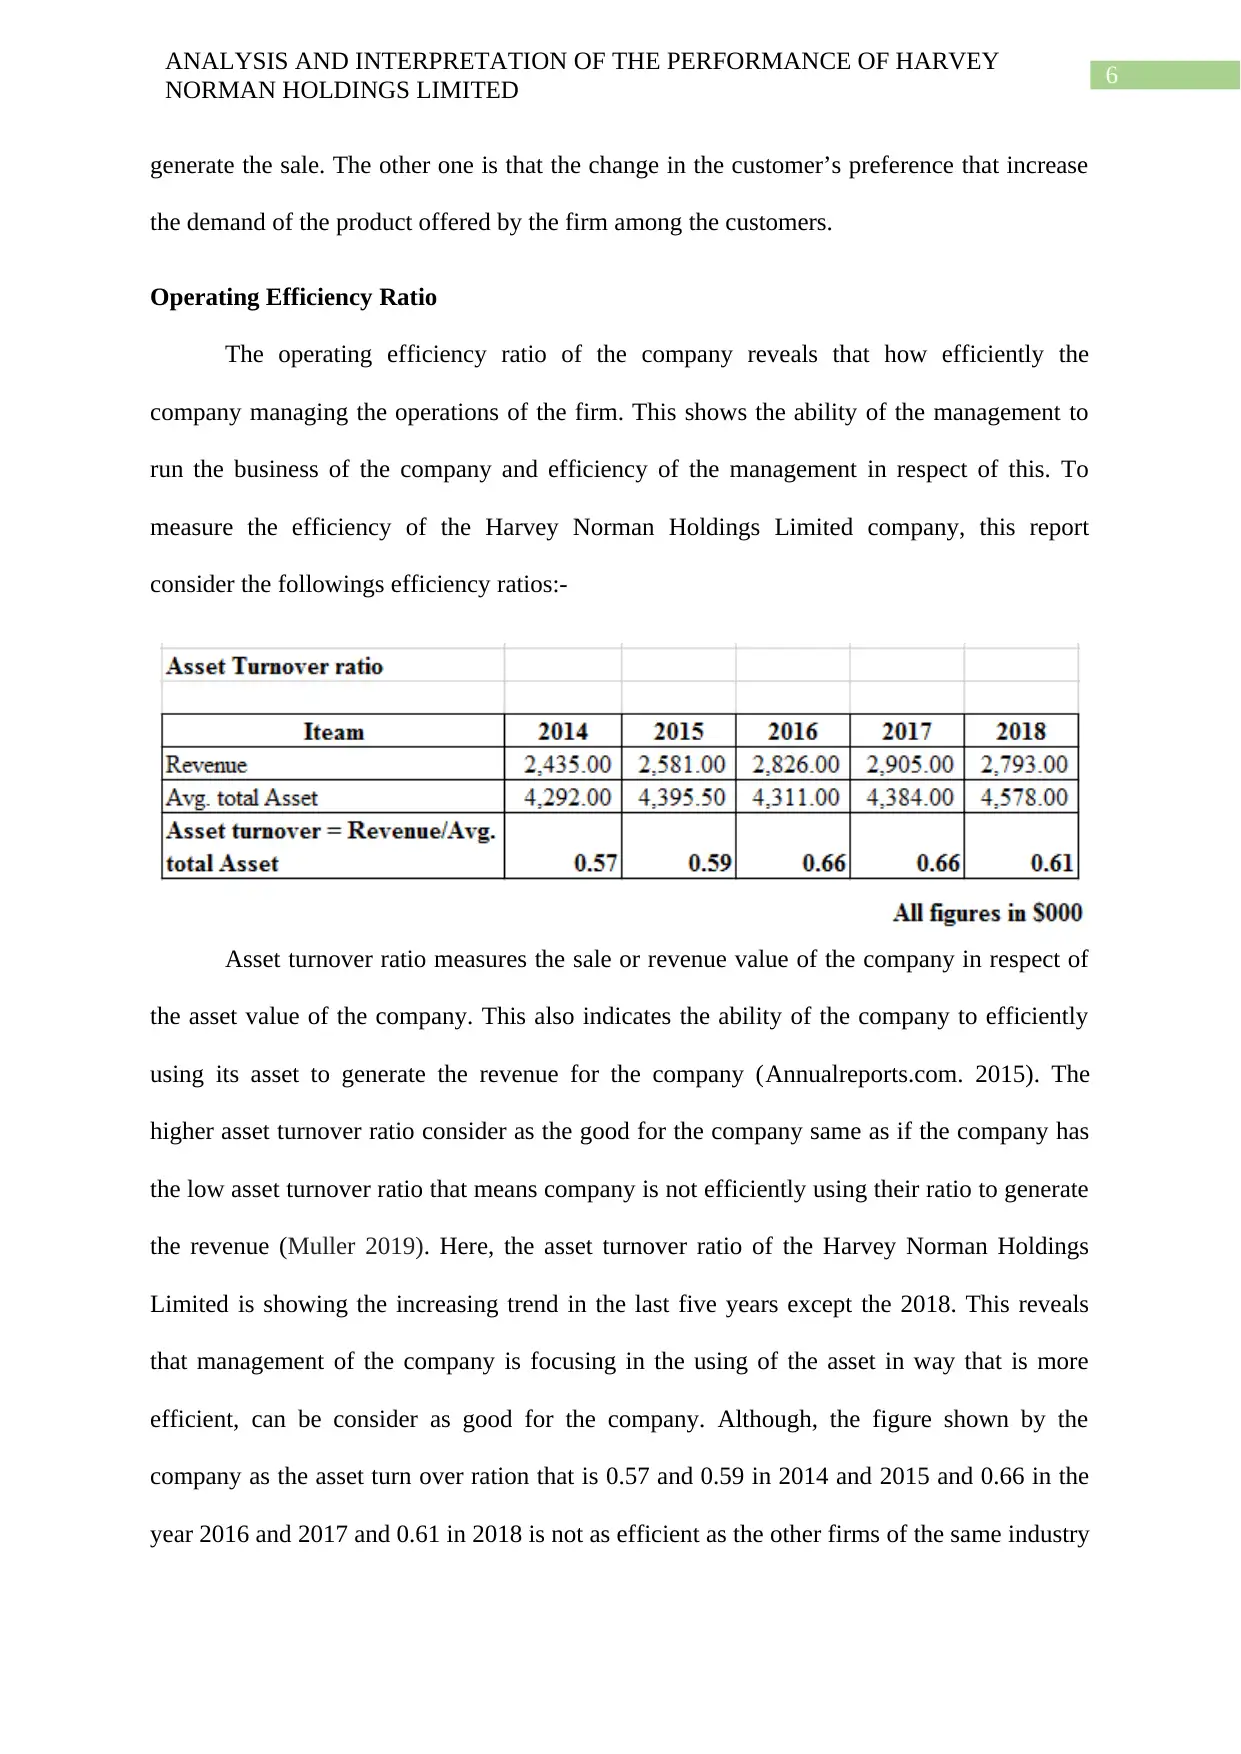
Asset turnover ratio measures the sale or revenue value of the company in respect of
the asset value of the company. This also indicates the ability of the company to efficiently
using its asset to generate the revenue for the company (Annualreports.com. 2015). The
higher asset turnover ratio consider as the good for the company same as if the company has
the low asset turnover ratio that means company is not efficiently using their ratio to generate
the revenue (Muller 2019). Here, the asset turnover ratio of the Harvey Norman Holdings
Limited is showing the increasing trend in the last five years except the 2018. This reveals
that management of the company is focusing in the using of the asset in way that is more
efficient, can be consider as good for the company. Although, the figure shown by the
company as the asset turn over ration that is 0.57 and 0.59 in 2014 and 2015 and 0.66 in the
year 2016 and 2017 and 0.61 in 2018 is not as efficient as the other firms of the same industry
ANALYSIS AND INTERPRETATION OF THE PERFORMANCE OF HARVEY
NORMAN HOLDINGS LIMITED
generate the sale. The other one is that the change in the customer’s preference that increase
the demand of the product offered by the firm among the customers.
Operating Efficiency Ratio
The operating efficiency ratio of the company reveals that how efficiently the
company managing the operations of the firm. This shows the ability of the management to
run the business of the company and efficiency of the management in respect of this. To
measure the efficiency of the Harvey Norman Holdings Limited company, this report
consider the followings efficiency ratios:-
Asset turnover ratio measures the sale or revenue value of the company in respect of
the asset value of the company. This also indicates the ability of the company to efficiently
using its asset to generate the revenue for the company (Annualreports.com. 2015). The
higher asset turnover ratio consider as the good for the company same as if the company has
the low asset turnover ratio that means company is not efficiently using their ratio to generate
the revenue (Muller 2019). Here, the asset turnover ratio of the Harvey Norman Holdings
Limited is showing the increasing trend in the last five years except the 2018. This reveals
that management of the company is focusing in the using of the asset in way that is more
efficient, can be consider as good for the company. Although, the figure shown by the
company as the asset turn over ration that is 0.57 and 0.59 in 2014 and 2015 and 0.66 in the
year 2016 and 2017 and 0.61 in 2018 is not as efficient as the other firms of the same industry
Paraphrase This Document
Need a fresh take? Get an instant paraphrase of this document with our AI Paraphraser
7
ANALYSIS AND INTERPRETATION OF THE PERFORMANCE OF HARVEY
NORMAN HOLDINGS LIMITED
(Annualreports.com. 2018). The decrease it the efficiency of the company in 2018 may be
because of the change in the customer’s preference that decreased the sales of the company
and the inflation rate that reduces the purchasing power of the company.
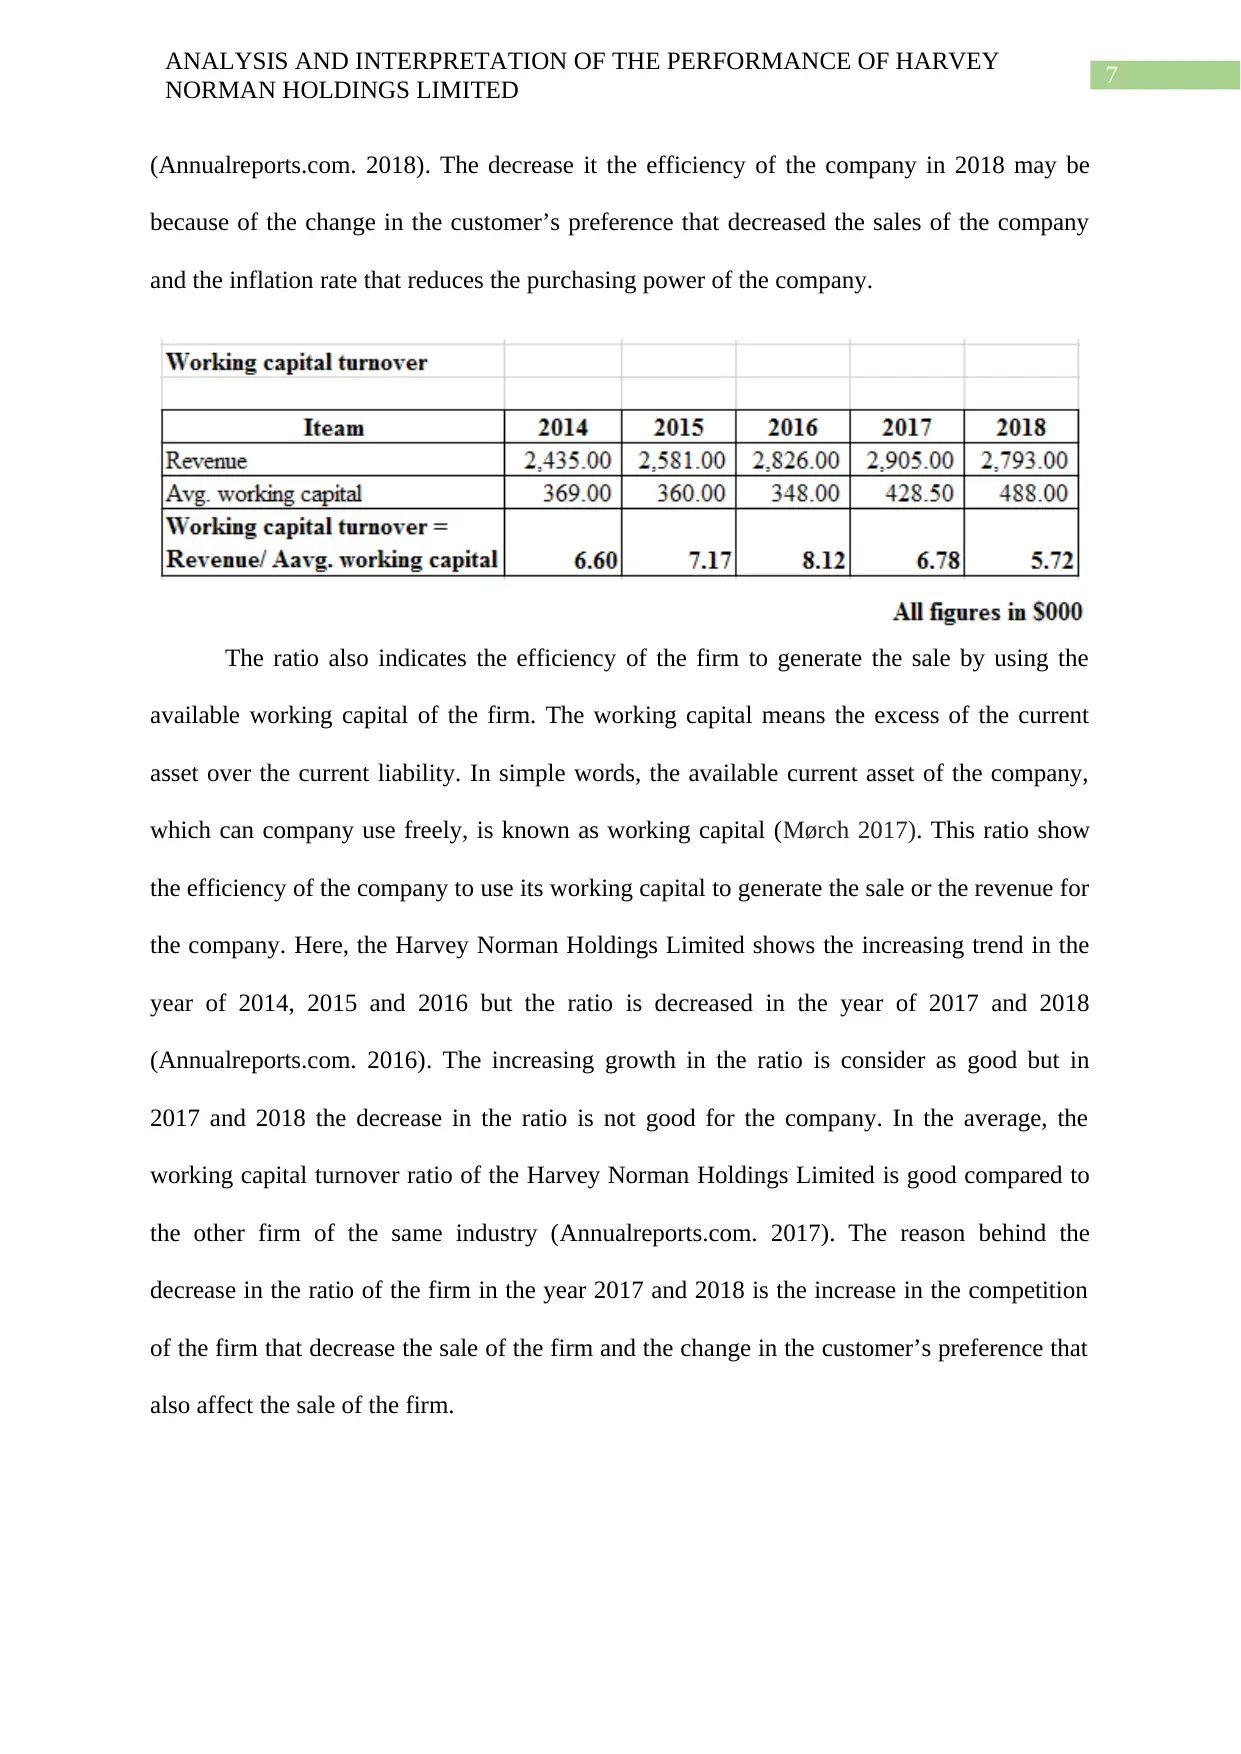
The ratio also indicates the efficiency of the firm to generate the sale by using the
available working capital of the firm. The working capital means the excess of the current
asset over the current liability. In simple words, the available current asset of the company,
which can company use freely, is known as working capital (Mørch 2017). This ratio show
the efficiency of the company to use its working capital to generate the sale or the revenue for
the company. Here, the Harvey Norman Holdings Limited shows the increasing trend in the
year of 2014, 2015 and 2016 but the ratio is decreased in the year of 2017 and 2018
(Annualreports.com. 2016). The increasing growth in the ratio is consider as good but in
2017 and 2018 the decrease in the ratio is not good for the company. In the average, the
working capital turnover ratio of the Harvey Norman Holdings Limited is good compared to
the other firm of the same industry (Annualreports.com. 2017). The reason behind the
decrease in the ratio of the firm in the year 2017 and 2018 is the increase in the competition
of the firm that decrease the sale of the firm and the change in the customer’s preference that
also affect the sale of the firm.
ANALYSIS AND INTERPRETATION OF THE PERFORMANCE OF HARVEY
NORMAN HOLDINGS LIMITED
(Annualreports.com. 2018). The decrease it the efficiency of the company in 2018 may be
because of the change in the customer’s preference that decreased the sales of the company
and the inflation rate that reduces the purchasing power of the company.
The ratio also indicates the efficiency of the firm to generate the sale by using the
available working capital of the firm. The working capital means the excess of the current
asset over the current liability. In simple words, the available current asset of the company,
which can company use freely, is known as working capital (Mørch 2017). This ratio show
the efficiency of the company to use its working capital to generate the sale or the revenue for
the company. Here, the Harvey Norman Holdings Limited shows the increasing trend in the
year of 2014, 2015 and 2016 but the ratio is decreased in the year of 2017 and 2018
(Annualreports.com. 2016). The increasing growth in the ratio is consider as good but in
2017 and 2018 the decrease in the ratio is not good for the company. In the average, the
working capital turnover ratio of the Harvey Norman Holdings Limited is good compared to
the other firm of the same industry (Annualreports.com. 2017). The reason behind the
decrease in the ratio of the firm in the year 2017 and 2018 is the increase in the competition
of the firm that decrease the sale of the firm and the change in the customer’s preference that
also affect the sale of the firm.
8
ANALYSIS AND INTERPRETATION OF THE PERFORMANCE OF HARVEY
NORMAN HOLDINGS LIMITED
Liquidity and Solvency ratio
The liquidity and solvency ratio is also an important aspect of the financial
performance analysis of any firm. This reveals the ability of the company to meet its liability.
This ratio become more important in context of the outsider investors especially the loan
provider of the company (Putra and Kindangen 2016). The loan provider of the company
used this ratio to determine the decision whether they provide the debt to the company or not.
To perform the liquidity and solvency of the company this report consider the following
ratios:-
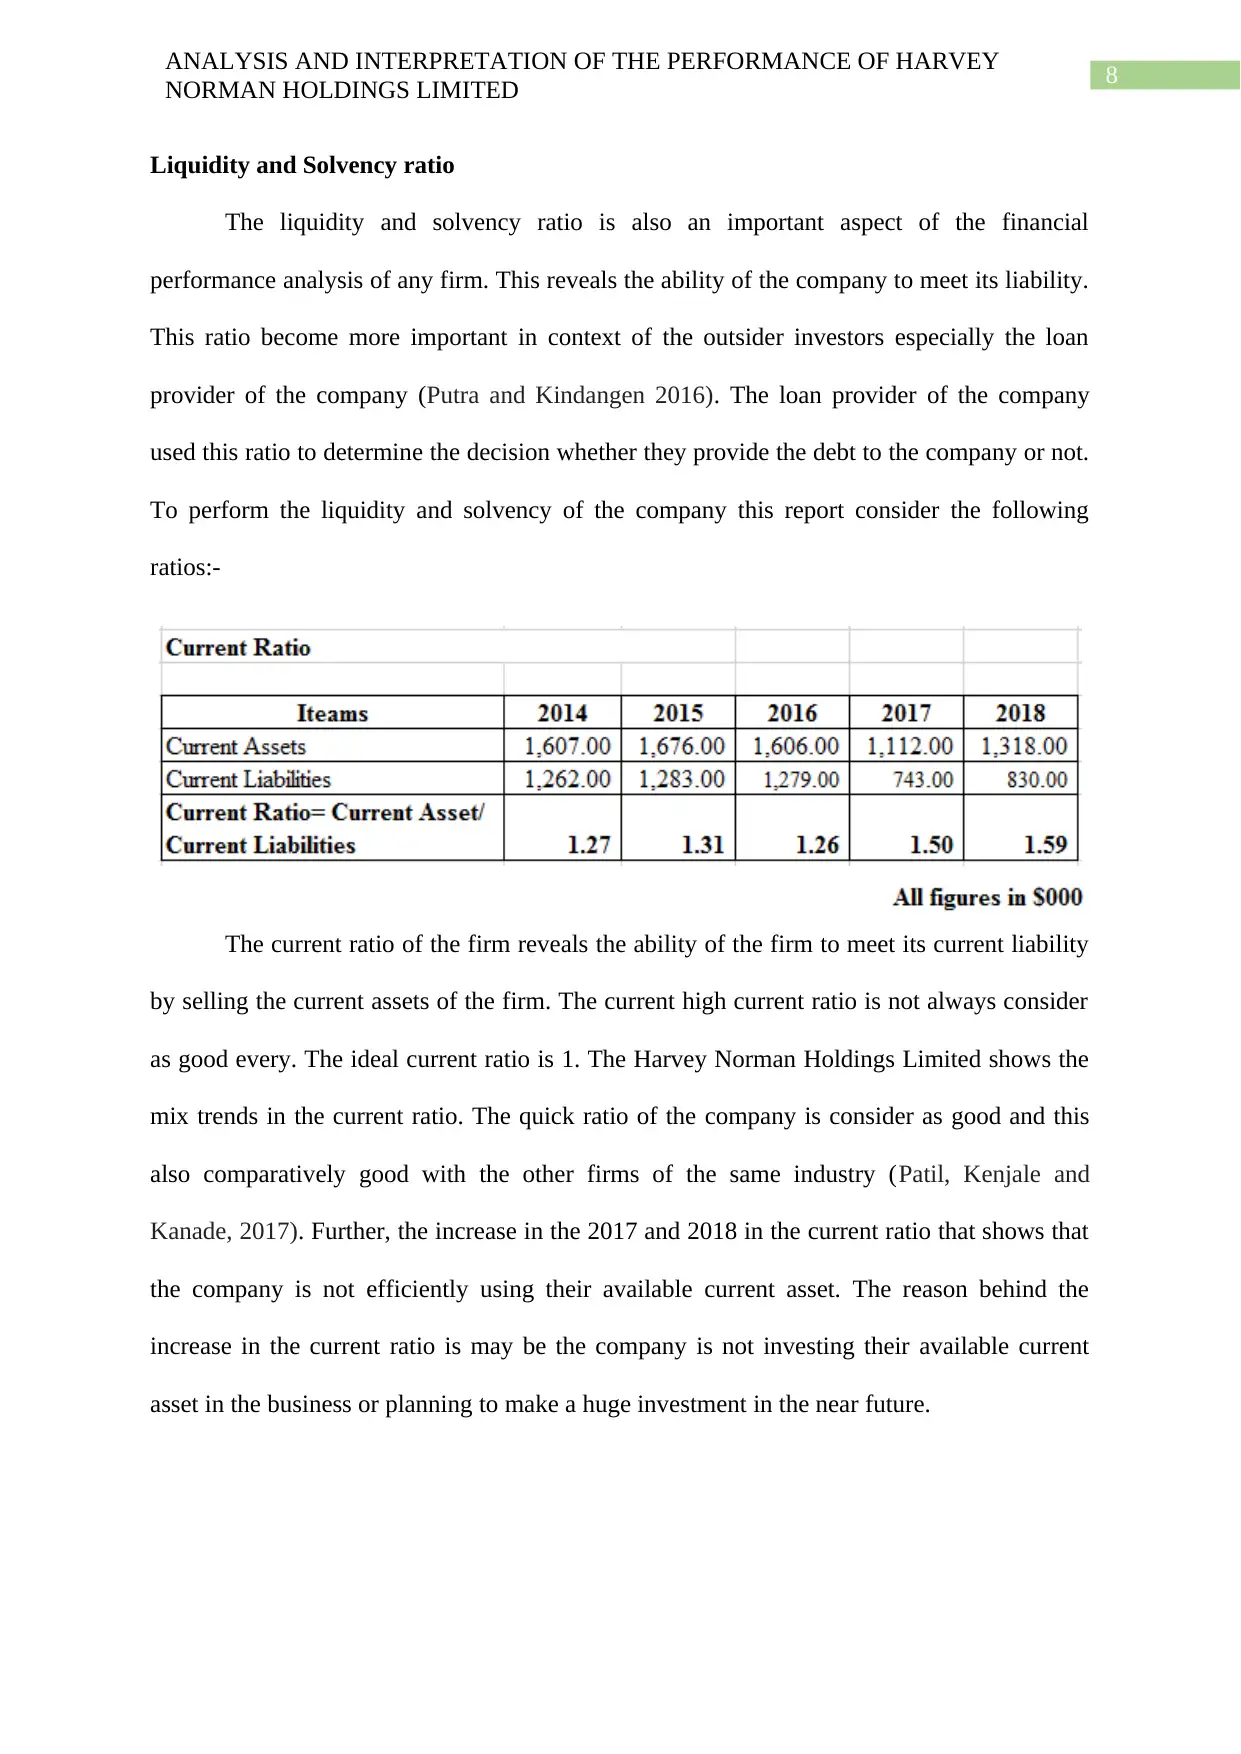
The current ratio of the firm reveals the ability of the firm to meet its current liability
by selling the current assets of the firm. The current high current ratio is not always consider
as good every. The ideal current ratio is 1. The Harvey Norman Holdings Limited shows the
mix trends in the current ratio. The quick ratio of the company is consider as good and this
also comparatively good with the other firms of the same industry (Patil, Kenjale and
Kanade, 2017). Further, the increase in the 2017 and 2018 in the current ratio that shows that
the company is not efficiently using their available current asset. The reason behind the
increase in the current ratio is may be the company is not investing their available current
asset in the business or planning to make a huge investment in the near future.
ANALYSIS AND INTERPRETATION OF THE PERFORMANCE OF HARVEY
NORMAN HOLDINGS LIMITED
Liquidity and Solvency ratio
The liquidity and solvency ratio is also an important aspect of the financial
performance analysis of any firm. This reveals the ability of the company to meet its liability.
This ratio become more important in context of the outsider investors especially the loan
provider of the company (Putra and Kindangen 2016). The loan provider of the company
used this ratio to determine the decision whether they provide the debt to the company or not.
To perform the liquidity and solvency of the company this report consider the following
ratios:-
The current ratio of the firm reveals the ability of the firm to meet its current liability
by selling the current assets of the firm. The current high current ratio is not always consider
as good every. The ideal current ratio is 1. The Harvey Norman Holdings Limited shows the
mix trends in the current ratio. The quick ratio of the company is consider as good and this
also comparatively good with the other firms of the same industry (Patil, Kenjale and
Kanade, 2017). Further, the increase in the 2017 and 2018 in the current ratio that shows that
the company is not efficiently using their available current asset. The reason behind the
increase in the current ratio is may be the company is not investing their available current
asset in the business or planning to make a huge investment in the near future.
⊘ This is a preview!⊘
Do you want full access?
Subscribe today to unlock all pages.
Trusted by 1+ million students worldwide
9
ANALYSIS AND INTERPRETATION OF THE PERFORMANCE OF HARVEY
NORMAN HOLDINGS LIMITED
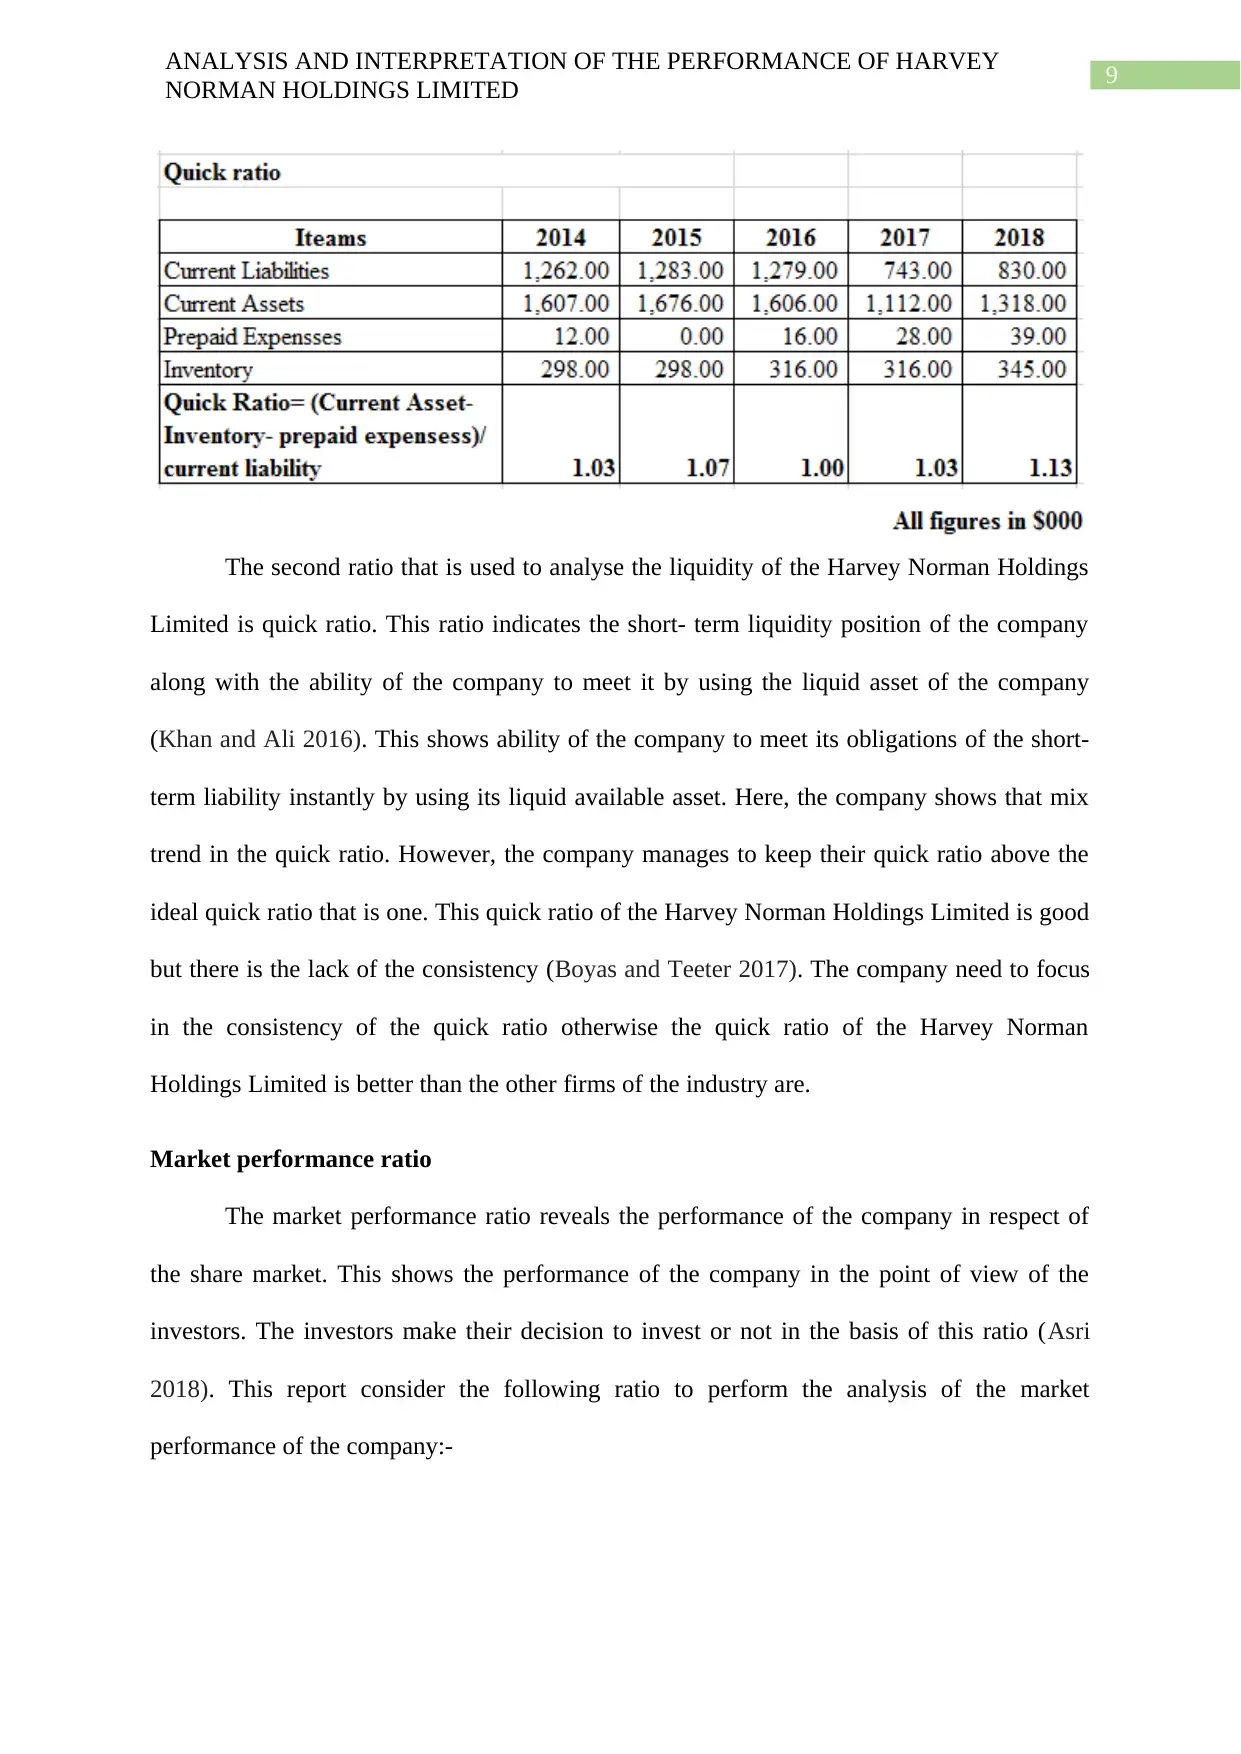
The second ratio that is used to analyse the liquidity of the Harvey Norman Holdings
Limited is quick ratio. This ratio indicates the short- term liquidity position of the company
along with the ability of the company to meet it by using the liquid asset of the company
(Khan and Ali 2016). This shows ability of the company to meet its obligations of the short-
term liability instantly by using its liquid available asset. Here, the company shows that mix
trend in the quick ratio. However, the company manages to keep their quick ratio above the
ideal quick ratio that is one. This quick ratio of the Harvey Norman Holdings Limited is good
but there is the lack of the consistency (Boyas and Teeter 2017). The company need to focus
in the consistency of the quick ratio otherwise the quick ratio of the Harvey Norman
Holdings Limited is better than the other firms of the industry are.
Market performance ratio
The market performance ratio reveals the performance of the company in respect of
the share market. This shows the performance of the company in the point of view of the
investors. The investors make their decision to invest or not in the basis of this ratio (Asri
2018). This report consider the following ratio to perform the analysis of the market
performance of the company:-
ANALYSIS AND INTERPRETATION OF THE PERFORMANCE OF HARVEY
NORMAN HOLDINGS LIMITED
The second ratio that is used to analyse the liquidity of the Harvey Norman Holdings
Limited is quick ratio. This ratio indicates the short- term liquidity position of the company
along with the ability of the company to meet it by using the liquid asset of the company
(Khan and Ali 2016). This shows ability of the company to meet its obligations of the short-
term liability instantly by using its liquid available asset. Here, the company shows that mix
trend in the quick ratio. However, the company manages to keep their quick ratio above the
ideal quick ratio that is one. This quick ratio of the Harvey Norman Holdings Limited is good
but there is the lack of the consistency (Boyas and Teeter 2017). The company need to focus
in the consistency of the quick ratio otherwise the quick ratio of the Harvey Norman
Holdings Limited is better than the other firms of the industry are.
Market performance ratio
The market performance ratio reveals the performance of the company in respect of
the share market. This shows the performance of the company in the point of view of the
investors. The investors make their decision to invest or not in the basis of this ratio (Asri
2018). This report consider the following ratio to perform the analysis of the market
performance of the company:-
Paraphrase This Document
Need a fresh take? Get an instant paraphrase of this document with our AI Paraphraser

10
ANALYSIS AND INTERPRETATION OF THE PERFORMANCE OF HARVEY
NORMAN HOLDINGS LIMITED
The earning per share shows the earning capacity of the firm in per share basis. This
has various importance in the investor’s point of view. In simple words, this help the
investors to determine the earnings of the company in the basis of per share (Sharif, Purohit
and Pillai 2015). The company shows increasing trend in the earning per share, which is good
for the company and help them to attract the investors. In 2018, the earning per share is
decreased may be due to the inflation and increase in the competition faced by the firm.
Conclusion
The paper concludes that the Harvey Norman Holdings Limited is performed well in
the last five years. The company is well in managing the available resources and generating
profit out of them. The liquidity of the company is above the ideal requirement that shows
that the company has enough assets to meet its liabilities. The efficiency ratio of the company
is also considerable and it also showing the increasing trend in it. Market performance of the
company also reveals that the company is enough to attract the investors. The only concern
with the Harvey Norman Holdings Limited is that company need to focus in their profitability
and try to generate profit from the operations. Lastly, the paper recommends that the
investing in the Harvey Norman Holdings Limited is a good option as the company is
expected to grow more in the near future.

11
ANALYSIS AND INTERPRETATION OF THE PERFORMANCE OF HARVEY
NORMAN HOLDINGS LIMITED
References
Andreou, P.C., Louca, C. and Panayides, P.M., 2016. The impact of vertical integration on
inventory turnover and operating performance. International Journal of Logistics Research
and Applications, 19(3), pp.218-238.
Annualreports.com. 2014. [online] Available at:
http://www.annualreports.com/HostedData/AnnualReportArchive/H/ASX_HVN_2014.pdf
[Accessed 3 May 2019].
Annualreports.com. 2015. [online] Available at:
http://www.annualreports.com/HostedData/AnnualReportArchive/H/ASX_HVN_2015.pdf
[Accessed 3 May 2019].
Annualreports.com. 2016. [online] Available at:
http://www.annualreports.com/HostedData/AnnualReportArchive/H/ASX_HVN_2016.pdf
[Accessed 3 May 2019].
Annualreports.com. 2017. [online] Available at:
http://www.annualreports.com/HostedData/AnnualReports/PDF/ASX_HVN_2017.pdf
[Accessed 3 May 2019].
Asri, M.H., 2018. Analisis Rasio Dengan Variabel EPS (Earning Per Share), ROA (Return
On Assets), ROE (Return On Equity), BOPO (Biaya Operasional Pendapatan Operasional)
Terhadap Harga Saham Perusahaan Perbankan. Jurnal Ilmiah Ekonomi Bisnis, 22(3).
Boyas, E. and Teeter, R., 2017. Teaching Financial Ratio Analysis using XBRL.
In Developments in Business Simulation and Experiential Learning: Proceedings of the
Annual ABSEL conference (Vol. 44, No. 1).
⊘ This is a preview!⊘
Do you want full access?
Subscribe today to unlock all pages.
Trusted by 1+ million students worldwide
1 out of 14
Related Documents


Your All-in-One AI-Powered Toolkit for Academic Success.
+13062052269
info@desklib.com
Available 24*7 on WhatsApp / Email
![[object Object]](/_next/static/media/star-bottom.7253800d.svg)
Unlock your academic potential
Copyright © 2020–2026 A2Z Services. All Rights Reserved. Developed and managed by ZUCOL.