Harvey Norman (HVN) Share Price and Portfolio Performance Analysis
VerifiedAdded on 2020/09/09
|15
|1272
|149
Report
AI Summary
This report provides a detailed analysis of Harvey Norman (HVN) share price performance from September to October 2019. It includes a brief description of the company, along with tables and charts illustrating the share price and its comparison with the All Ordinaries Index. The report examines the share price performance, calculating gains and losses on a hypothetical portfolio. Furthermore, it identifies key financial data, performs ratio analysis (liquidity, stability, profitability, and investment), and concludes with an investment recommendation. The analysis considers factors such as financial health, leverage, market sentiment, and external economic influences like the US-China trade war and Brexit. The report utilizes financial data to assess the company's performance and provides insights into the stock's potential.
TABLE OF CONTENTS
Table of Contents.........................................................................................................................................................1
Part 2........................................................................................................................................................................... 2
(a) Brief Description of Each Company....................................................................................................................2
(b) Graphs, Share price table and All Ordinaries Index of Each Company................................................................3
(c) Overview of Share price Performance................................................................................................................6
(d) Calculation of Gain and Loss on Portfolio...........................................................................................................7
(e) Recommendation of the share portfolio............................................................................................................8
Part 3........................................................................................................................................................................... 8
(a) Identification of Key financial data.....................................................................................................................8
(b) Ratio Analysis.....................................................................................................................................................8
Liquidity...............................................................................................................................................................8
Stability............................................................................................................................................................... 9
Profitability........................................................................................................................................................10
Investment........................................................................................................................................................10
References................................................................................................................................................................. 12
Appendices................................................................................................................................................................ 13
1 | P a g e
Paraphrase This Document
Need a fresh take? Get an instant paraphrase of this document with our AI Paraphraser
PART 2
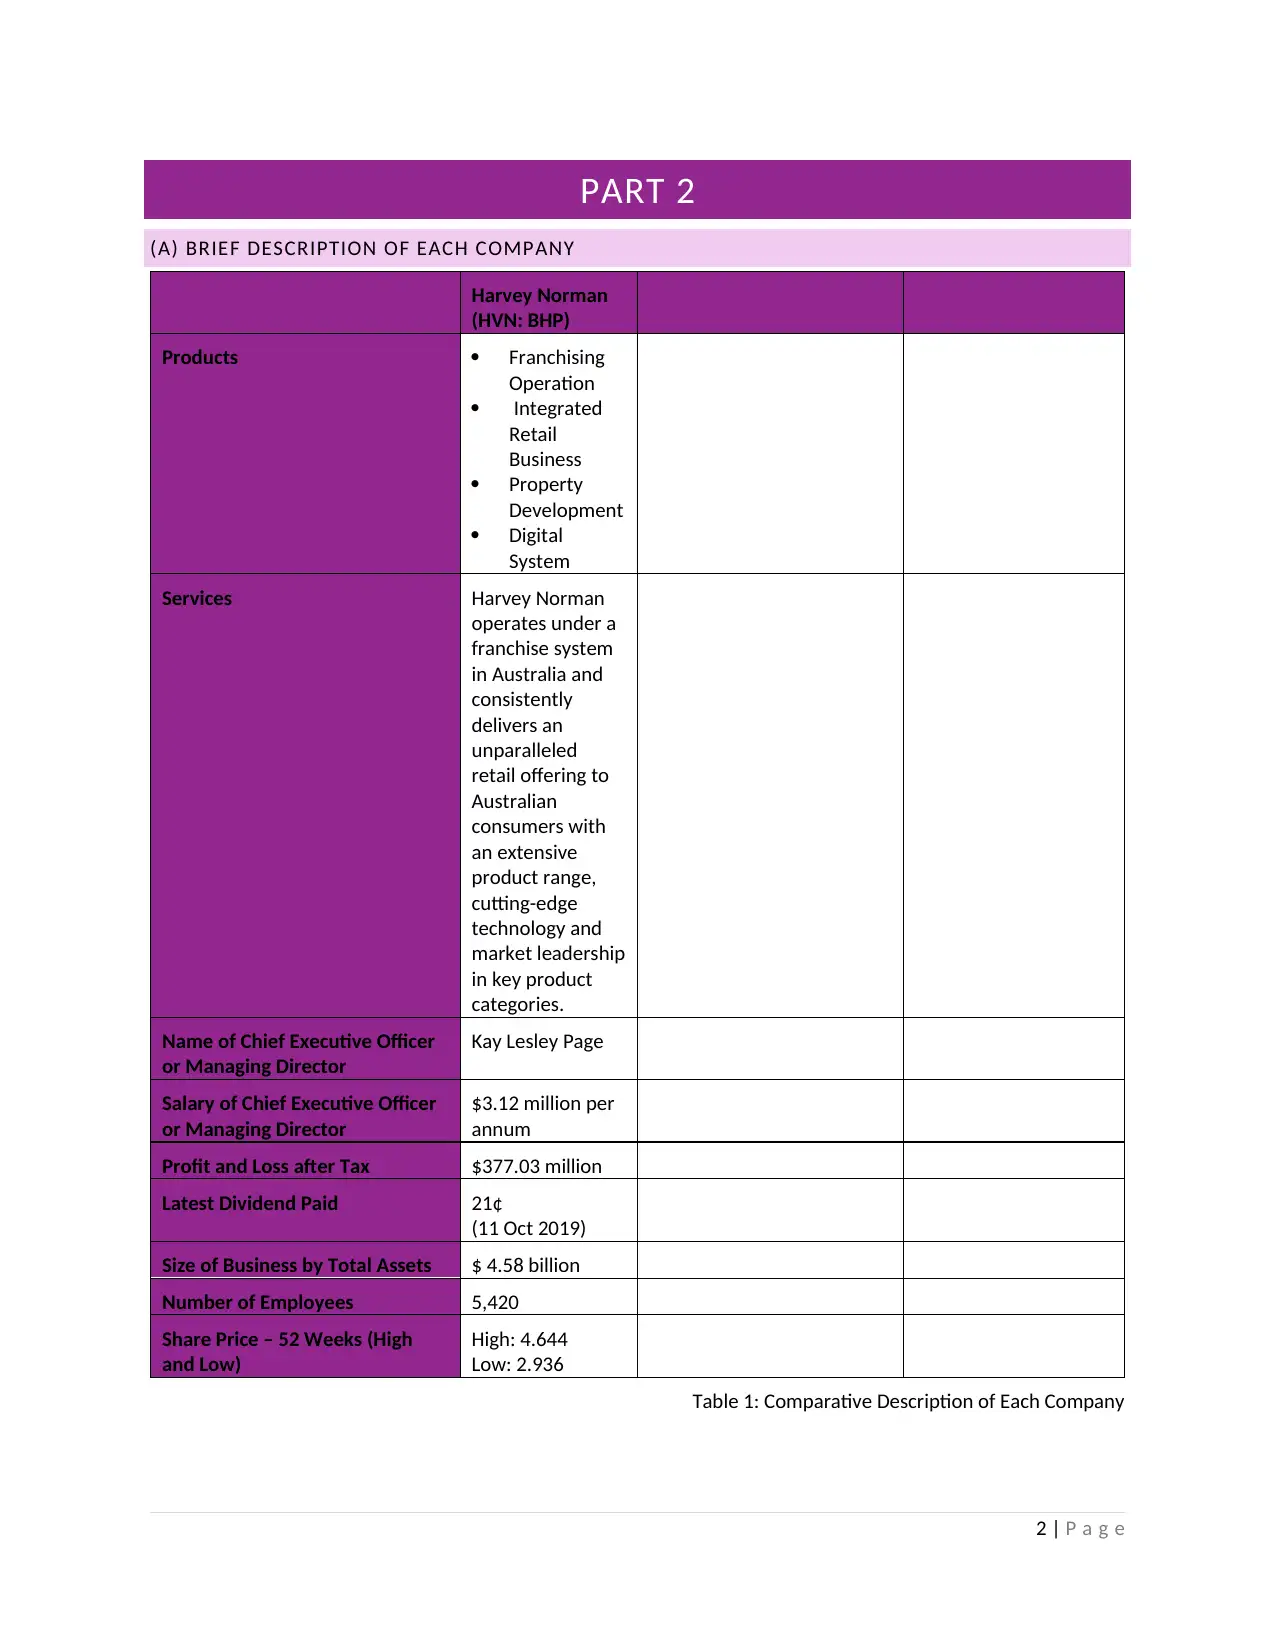
(A) BRIEF DESCRIPTION OF EACH COMPANY
Harvey Norman
(HVN: BHP)
Products Franchising
Operation
Integrated
Retail
Business
Property
Development
Digital
System
Services Harvey Norman
operates under a
franchise system
in Australia and
consistently
delivers an
unparalleled
retail offering to
Australian
consumers with
an extensive
product range,
cutting-edge
technology and
market leadership
in key product
categories.
Name of Chief Executive Officer
or Managing Director
Kay Lesley Page
Salary of Chief Executive Officer
or Managing Director
$3.12 million per
annum
Profit and Loss after Tax $377.03 million
Latest Dividend Paid 21¢
(11 Oct 2019)
Size of Business by Total Assets $ 4.58 billion
Number of Employees 5,420
Share Price – 52 Weeks (High
and Low)
High: 4.644
Low: 2.936
Table 1: Comparative Description of Each Company
2 | P a g e
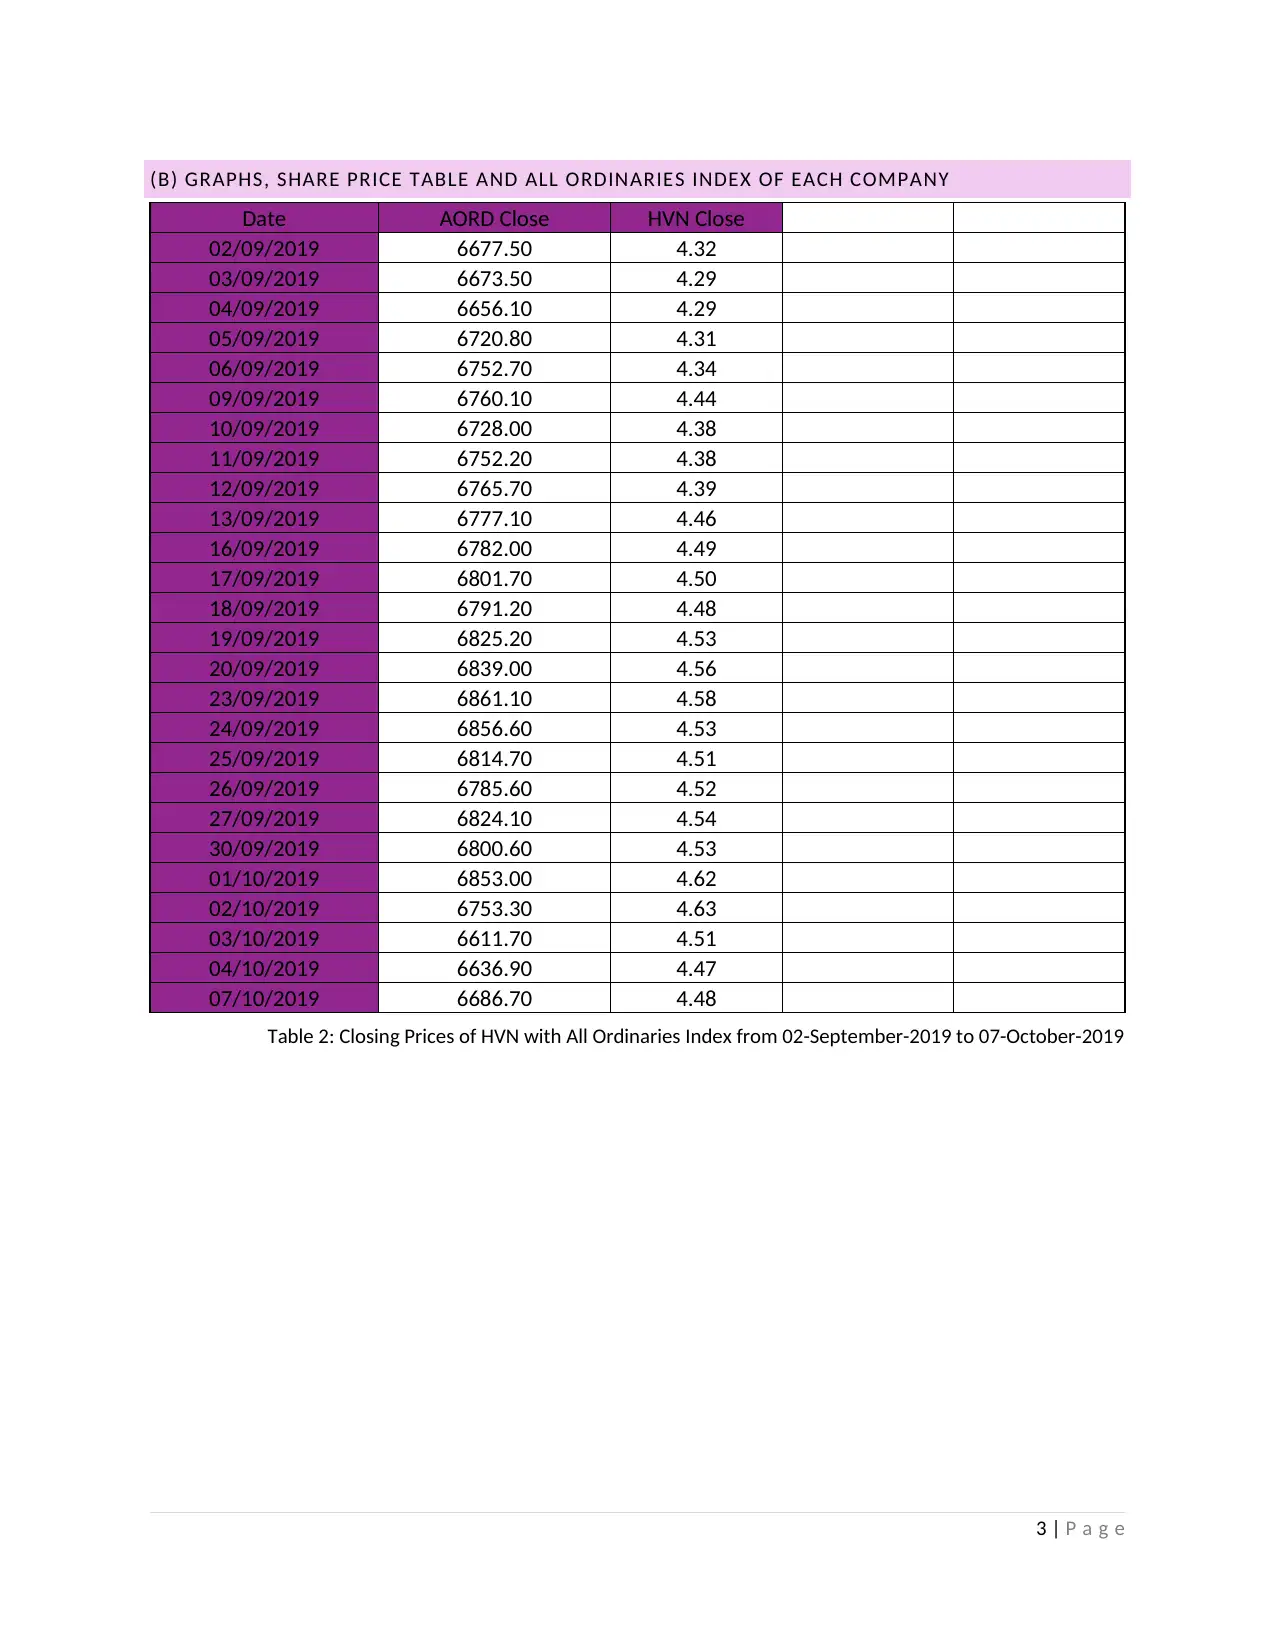
(B) GRAPHS, SHARE PRICE TABLE AND ALL ORDINARIES INDEX OF EACH COMPANY
Date AORD Close HVN Close
02/09/2019 6677.50 4.32
03/09/2019 6673.50 4.29
04/09/2019 6656.10 4.29
05/09/2019 6720.80 4.31
06/09/2019 6752.70 4.34
09/09/2019 6760.10 4.44
10/09/2019 6728.00 4.38
11/09/2019 6752.20 4.38
12/09/2019 6765.70 4.39
13/09/2019 6777.10 4.46
16/09/2019 6782.00 4.49
17/09/2019 6801.70 4.50
18/09/2019 6791.20 4.48
19/09/2019 6825.20 4.53
20/09/2019 6839.00 4.56
23/09/2019 6861.10 4.58
24/09/2019 6856.60 4.53
25/09/2019 6814.70 4.51
26/09/2019 6785.60 4.52
27/09/2019 6824.10 4.54
30/09/2019 6800.60 4.53
01/10/2019 6853.00 4.62
02/10/2019 6753.30 4.63
03/10/2019 6611.70 4.51
04/10/2019 6636.90 4.47
07/10/2019 6686.70 4.48
Table 2: Closing Prices of HVN with All Ordinaries Index from 02-September-2019 to 07-October-2019
3 | P a g e
⊘ This is a preview!⊘
Do you want full access?
Subscribe today to unlock all pages.
Trusted by 1+ million students worldwide
9 / 2 / 2 0 1 9
9 / 4 / 2 0 1 9
9 / 6 / 2 0 1 9
9 / 8 / 2 0 1 9
9 / 1 0 / 2 0 1 9
9 / 1 2 / 2 0 1 9
9 / 1 4 / 2 0 1 9
9 / 1 6 / 2 0 1 9
9 / 1 8 / 2 0 1 9
9 / 2 0 / 2 0 1 9
9 / 2 2 / 2 0 1 9
9 / 2 4 / 2 0 1 9
9 / 2 6 / 2 0 1 9
9 / 2 8 / 2 0 1 9
9 / 3 0 / 2 0 1 9
1 0 / 2 / 2 0 1 9
1 0 / 4 / 2 0 1 9
1 0 / 6 / 2 0 1 9
6450.00
6500.00
6550.00
6600.00
6650.00
6700.00
6750.00
6800.00
6850.00
6900.00
AORD Close
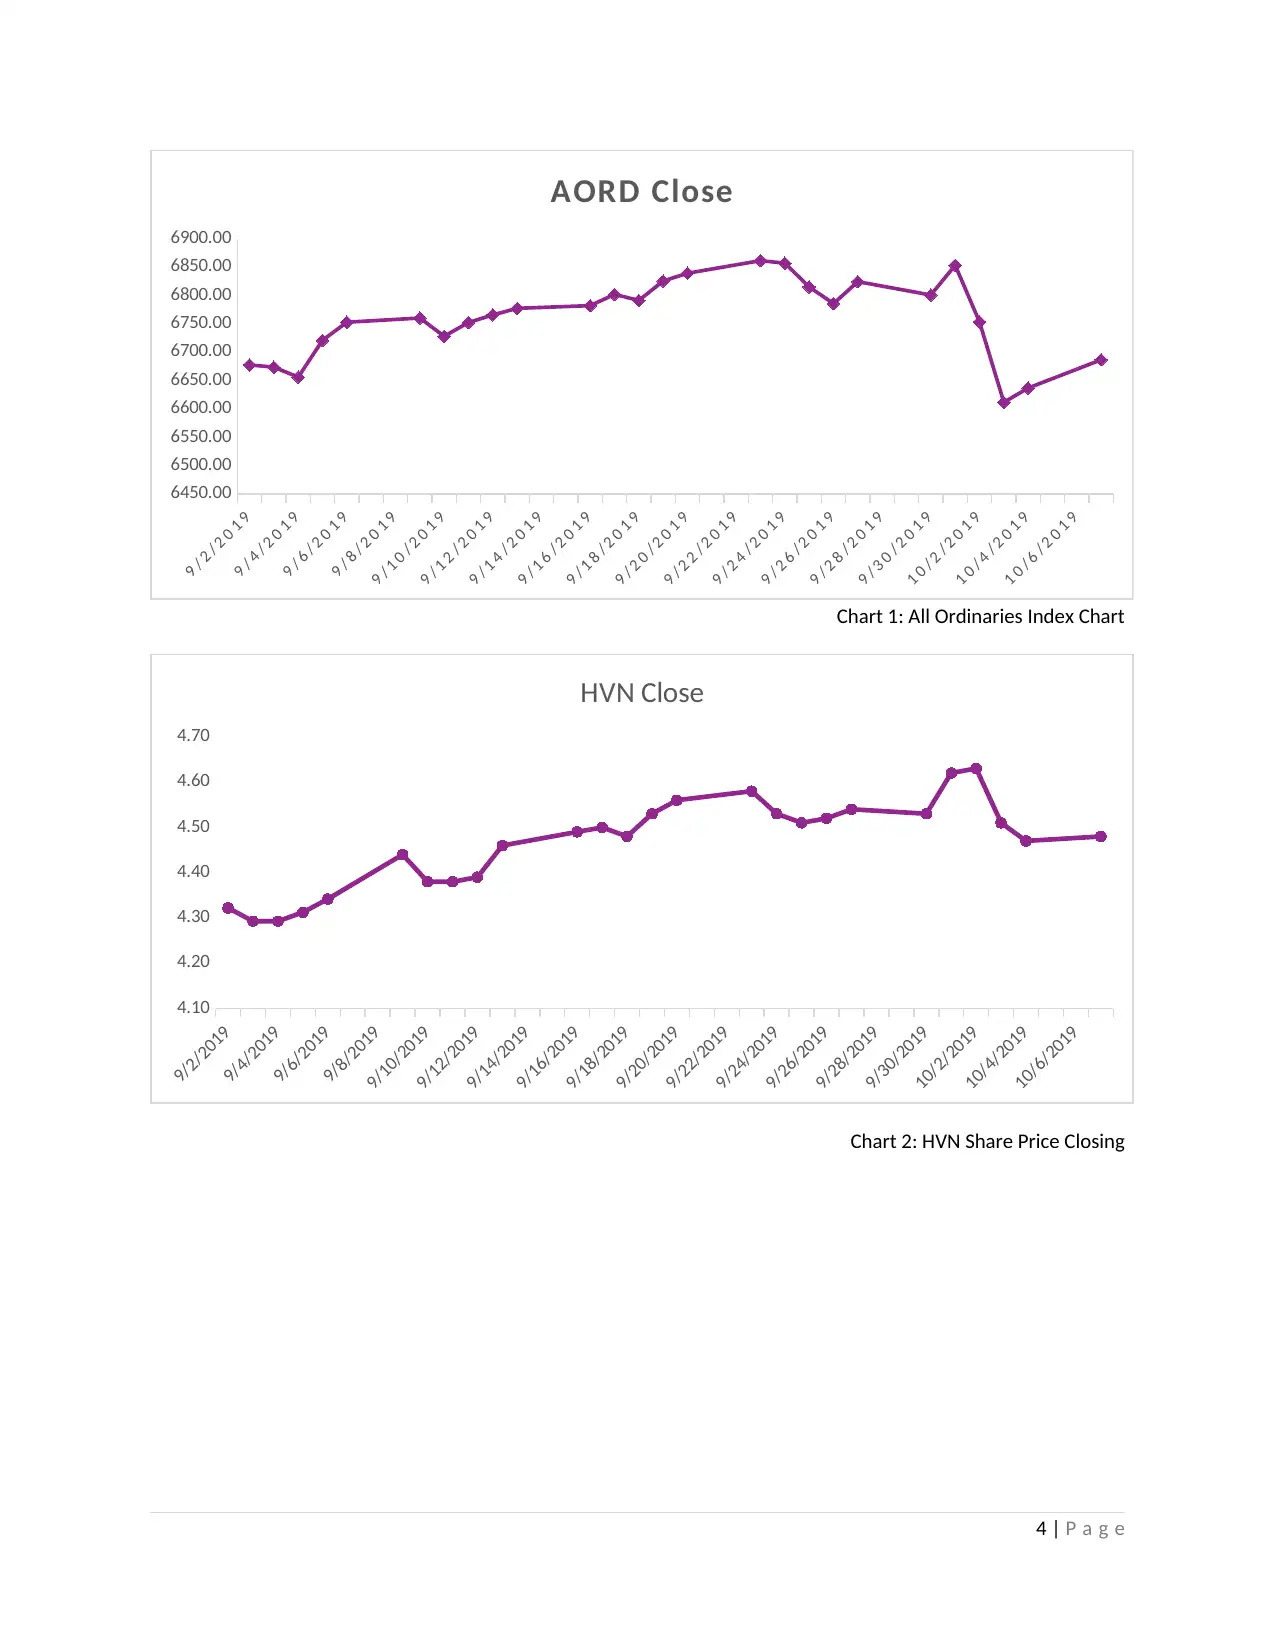
Chart 1: All Ordinaries Index Chart
9/2/2019
9/4/2019
9/6/2019
9/8/2019
9/10/2019
9/12/2019
9/14/2019
9/16/2019
9/18/2019
9/20/2019
9/22/2019
9/24/2019
9/26/2019
9/28/2019
9/30/2019
10/2/2019
10/4/2019
10/6/2019
4.10
4.20
4.30
4.40
4.50
4.60
4.70
HVN Close
Chart 2: HVN Share Price Closing
4 | P a g e
9 / 4 / 2 0 1 9
9 / 6 / 2 0 1 9
9 / 8 / 2 0 1 9
9 / 1 0 / 2 0 1 9
9 / 1 2 / 2 0 1 9
9 / 1 4 / 2 0 1 9
9 / 1 6 / 2 0 1 9
9 / 1 8 / 2 0 1 9
9 / 2 0 / 2 0 1 9
9 / 2 2 / 2 0 1 9
9 / 2 4 / 2 0 1 9
9 / 2 6 / 2 0 1 9
9 / 2 8 / 2 0 1 9
9 / 3 0 / 2 0 1 9
1 0 / 2 / 2 0 1 9
1 0 / 4 / 2 0 1 9
1 0 / 6 / 2 0 1 9
6450.00
6500.00
6550.00
6600.00
6650.00
6700.00
6750.00
6800.00
6850.00
6900.00
AORD Close
Chart 1: All Ordinaries Index Chart
9/2/2019
9/4/2019
9/6/2019
9/8/2019
9/10/2019
9/12/2019
9/14/2019
9/16/2019
9/18/2019
9/20/2019
9/22/2019
9/24/2019
9/26/2019
9/28/2019
9/30/2019
10/2/2019
10/4/2019
10/6/2019
4.10
4.20
4.30
4.40
4.50
4.60
4.70
HVN Close
Chart 2: HVN Share Price Closing
4 | P a g e
Paraphrase This Document
Need a fresh take? Get an instant paraphrase of this document with our AI Paraphraser
9/2/2019
9/4/2019
9/6/2019
9/8/2019
9/10/2019
9/12/2019
9/14/2019
9/16/2019
9/18/2019
9/20/2019
9/22/2019
9/24/2019
9/26/2019
9/28/2019
9/30/2019
10/2/2019
10/4/2019
10/6/2019
4.10
4.20
4.30
4.40
4.50
4.60
4.70
6450.00
6500.00
6550.00
6600.00
6650.00
6700.00
6750.00
6800.00
6850.00
6900.00
HVN Comparison with AORD
HVN Close AORD Close
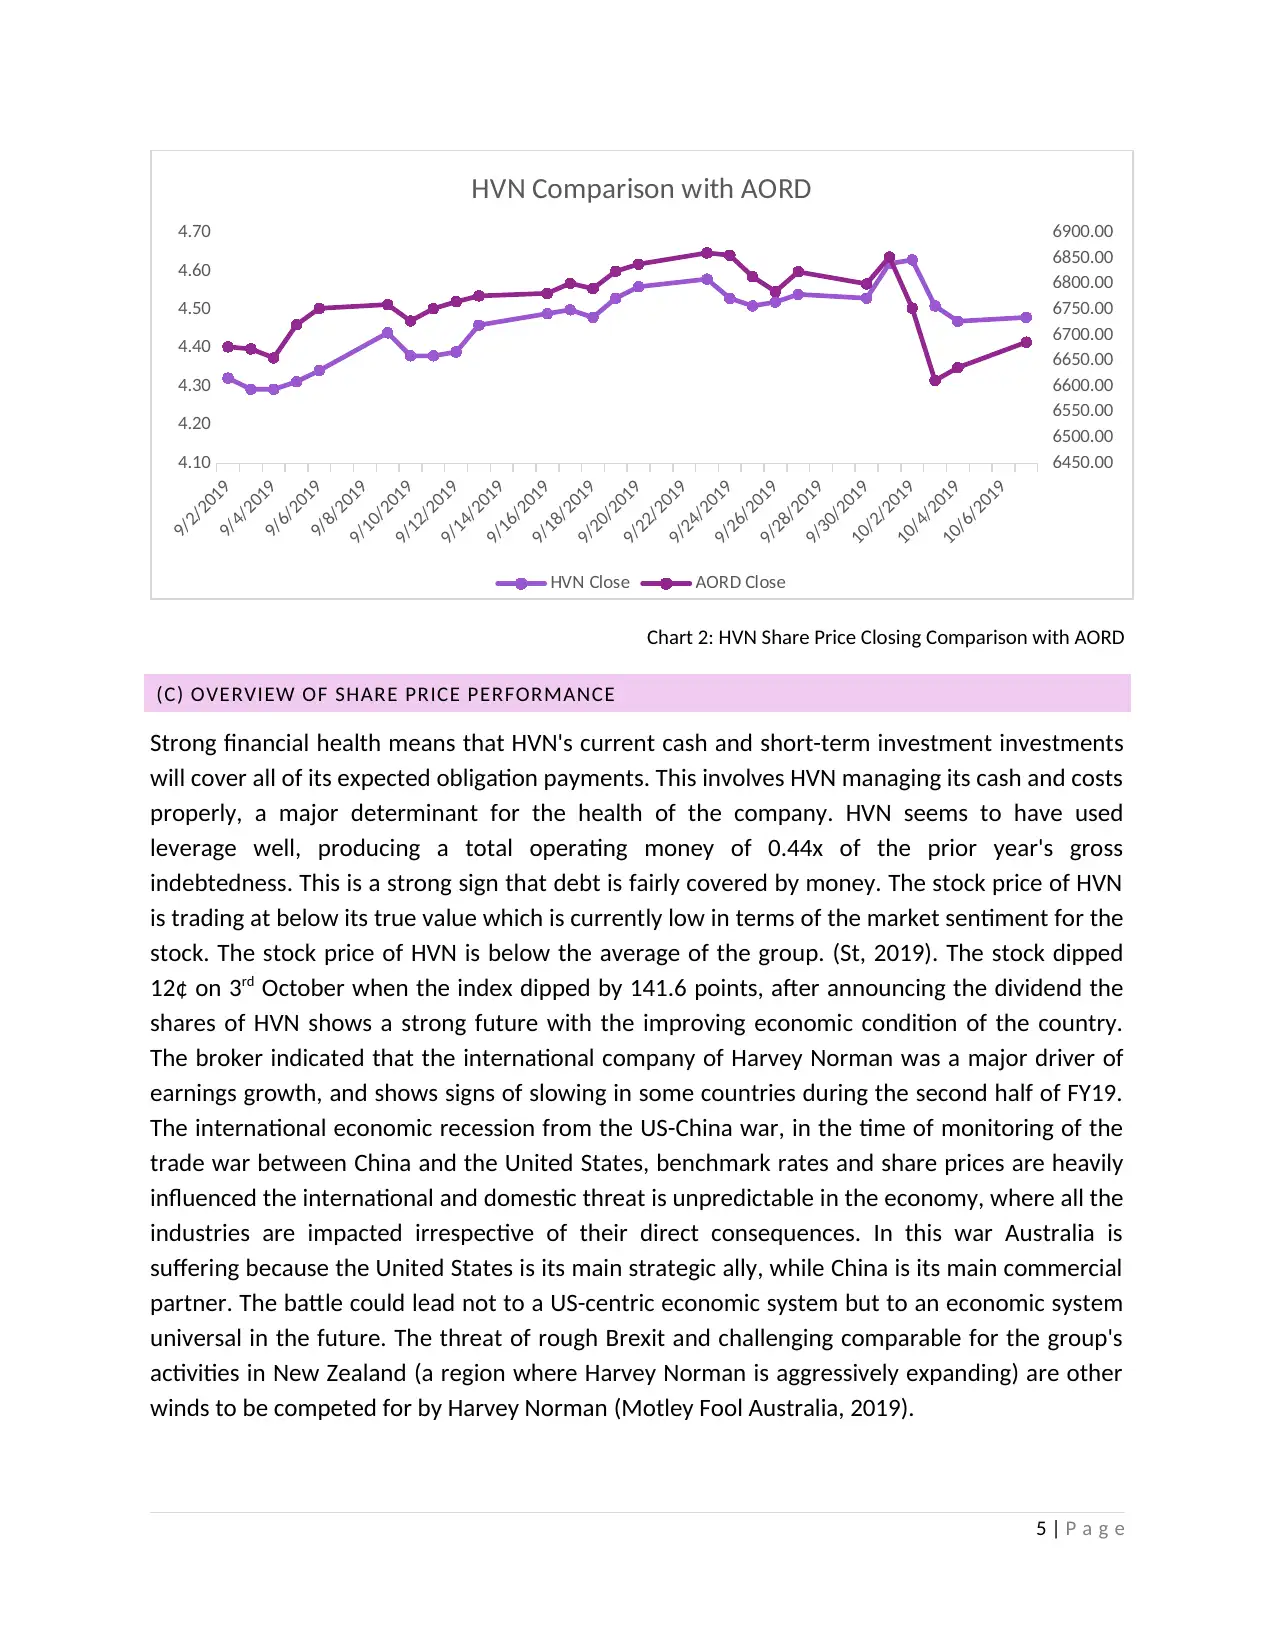
Chart 2: HVN Share Price Closing Comparison with AORD
(C) OVERVIEW OF SHARE PRICE PERFORMANCE
Strong financial health means that HVN's current cash and short-term investment investments
will cover all of its expected obligation payments. This involves HVN managing its cash and costs
properly, a major determinant for the health of the company. HVN seems to have used
leverage well, producing a total operating money of 0.44x of the prior year's gross
indebtedness. This is a strong sign that debt is fairly covered by money. The stock price of HVN
is trading at below its true value which is currently low in terms of the market sentiment for the
stock. The stock price of HVN is below the average of the group. (St, 2019). The stock dipped
12¢ on 3rd October when the index dipped by 141.6 points, after announcing the dividend the
shares of HVN shows a strong future with the improving economic condition of the country.
The broker indicated that the international company of Harvey Norman was a major driver of
earnings growth, and shows signs of slowing in some countries during the second half of FY19.
The international economic recession from the US-China war, in the time of monitoring of the
trade war between China and the United States, benchmark rates and share prices are heavily
influenced the international and domestic threat is unpredictable in the economy, where all the
industries are impacted irrespective of their direct consequences. In this war Australia is
suffering because the United States is its main strategic ally, while China is its main commercial
partner. The battle could lead not to a US-centric economic system but to an economic system
universal in the future. The threat of rough Brexit and challenging comparable for the group's
activities in New Zealand (a region where Harvey Norman is aggressively expanding) are other
winds to be competed for by Harvey Norman (Motley Fool Australia, 2019).
5 | P a g e
9/4/2019
9/6/2019
9/8/2019
9/10/2019
9/12/2019
9/14/2019
9/16/2019
9/18/2019
9/20/2019
9/22/2019
9/24/2019
9/26/2019
9/28/2019
9/30/2019
10/2/2019
10/4/2019
10/6/2019
4.10
4.20
4.30
4.40
4.50
4.60
4.70
6450.00
6500.00
6550.00
6600.00
6650.00
6700.00
6750.00
6800.00
6850.00
6900.00
HVN Comparison with AORD
HVN Close AORD Close
Chart 2: HVN Share Price Closing Comparison with AORD
(C) OVERVIEW OF SHARE PRICE PERFORMANCE
Strong financial health means that HVN's current cash and short-term investment investments
will cover all of its expected obligation payments. This involves HVN managing its cash and costs
properly, a major determinant for the health of the company. HVN seems to have used
leverage well, producing a total operating money of 0.44x of the prior year's gross
indebtedness. This is a strong sign that debt is fairly covered by money. The stock price of HVN
is trading at below its true value which is currently low in terms of the market sentiment for the
stock. The stock price of HVN is below the average of the group. (St, 2019). The stock dipped
12¢ on 3rd October when the index dipped by 141.6 points, after announcing the dividend the
shares of HVN shows a strong future with the improving economic condition of the country.
The broker indicated that the international company of Harvey Norman was a major driver of
earnings growth, and shows signs of slowing in some countries during the second half of FY19.
The international economic recession from the US-China war, in the time of monitoring of the
trade war between China and the United States, benchmark rates and share prices are heavily
influenced the international and domestic threat is unpredictable in the economy, where all the
industries are impacted irrespective of their direct consequences. In this war Australia is
suffering because the United States is its main strategic ally, while China is its main commercial
partner. The battle could lead not to a US-centric economic system but to an economic system
universal in the future. The threat of rough Brexit and challenging comparable for the group's
activities in New Zealand (a region where Harvey Norman is aggressively expanding) are other
winds to be competed for by Harvey Norman (Motley Fool Australia, 2019).
5 | P a g e
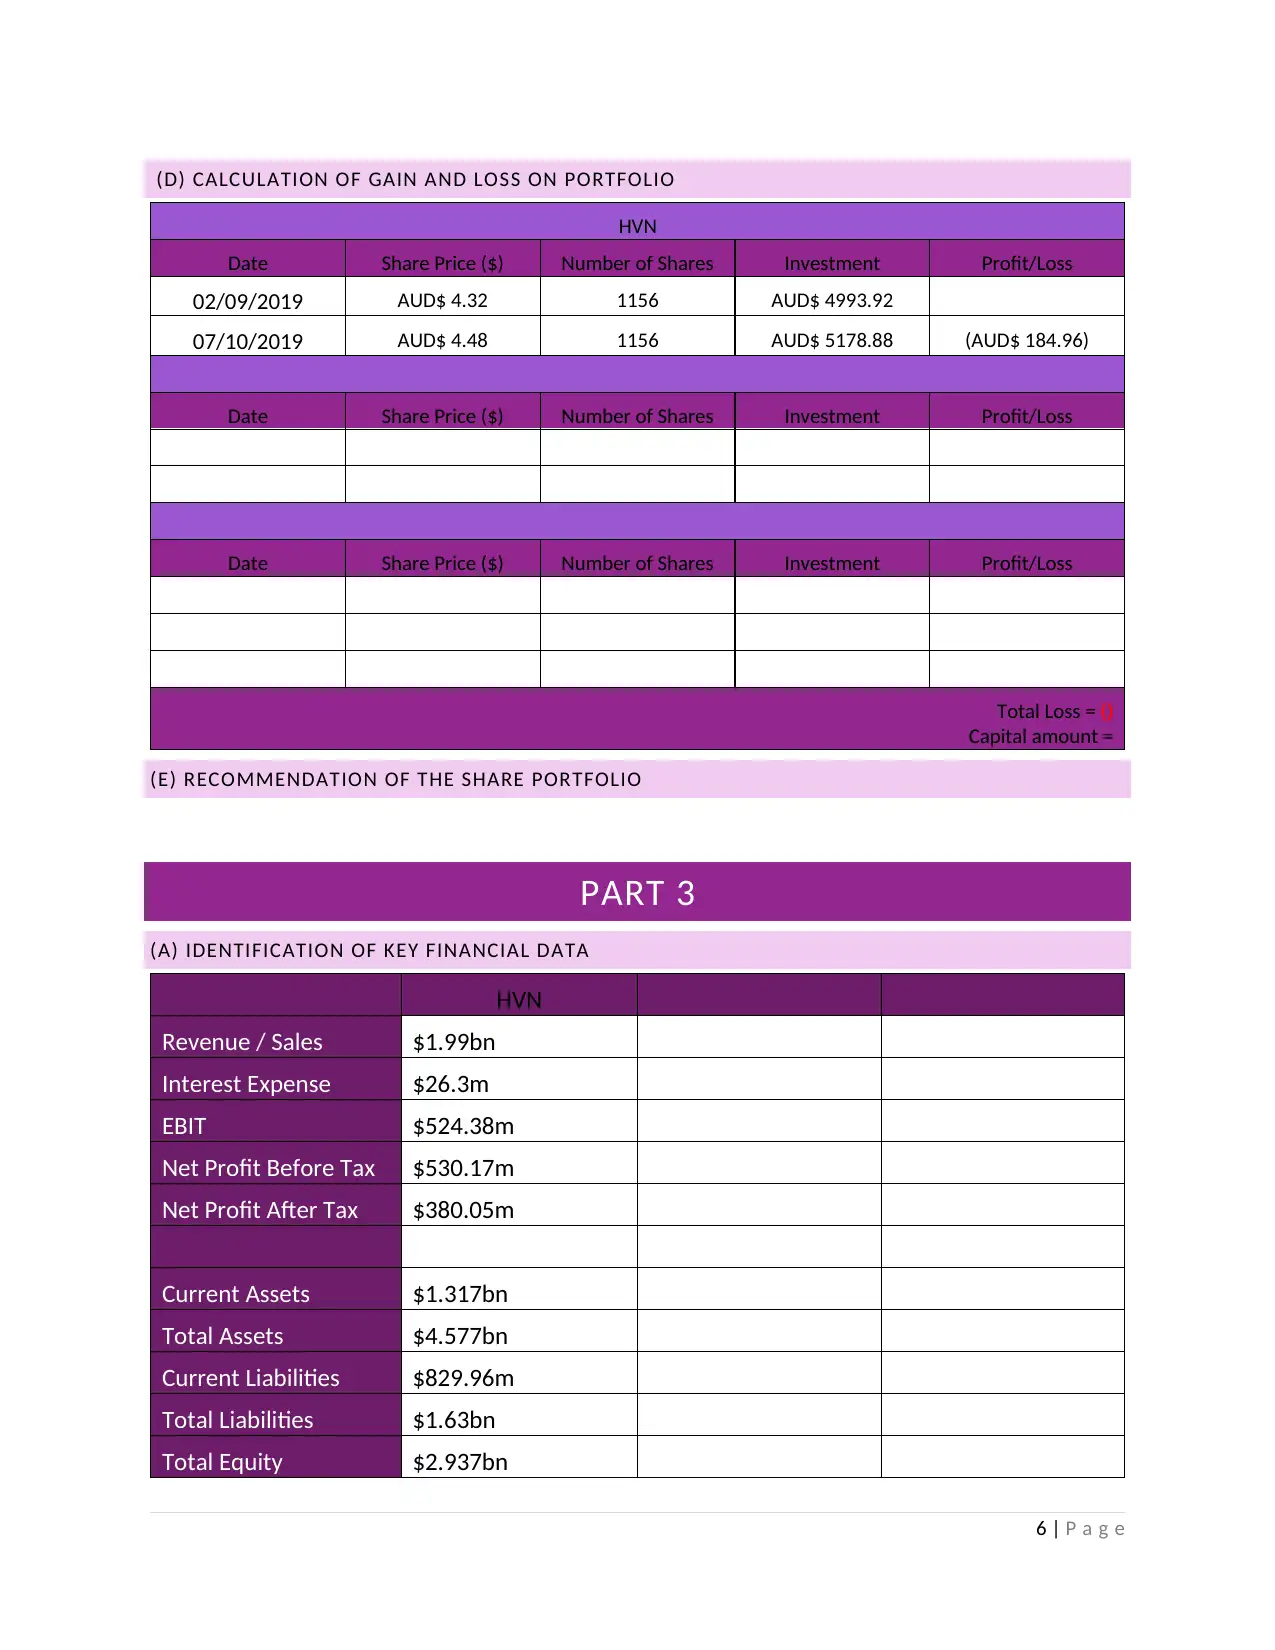
(D) CALCULATION OF GAIN AND LOSS ON PORTFOLIO
HVN
Date Share Price ($) Number of Shares Investment Profit/Loss
02/09/2019 AUD$ 4.32 1156 AUD$ 4993.92
07/10/2019 AUD$ 4.48 1156 AUD$ 5178.88 (AUD$ 184.96)
Date Share Price ($) Number of Shares Investment Profit/Loss
Date Share Price ($) Number of Shares Investment Profit/Loss
Total Loss = ()
Capital amount =
(E) RECOMMENDATION OF THE SHARE PORTFOLIO
PART 3
(A) IDENTIFICATION OF KEY FINANCIAL DATA
HVN
Revenue / Sales $1.99bn
Interest Expense $26.3m
EBIT $524.38m
Net Profit Before Tax $530.17m
Net Profit After Tax $380.05m
Current Assets $1.317bn
Total Assets $4.577bn
Current Liabilities $829.96m
Total Liabilities $1.63bn
Total Equity $2.937bn
6 | P a g e
HVN
Date Share Price ($) Number of Shares Investment Profit/Loss
02/09/2019 AUD$ 4.32 1156 AUD$ 4993.92
07/10/2019 AUD$ 4.48 1156 AUD$ 5178.88 (AUD$ 184.96)
Date Share Price ($) Number of Shares Investment Profit/Loss
Date Share Price ($) Number of Shares Investment Profit/Loss
Total Loss = ()
Capital amount =
(E) RECOMMENDATION OF THE SHARE PORTFOLIO
PART 3
(A) IDENTIFICATION OF KEY FINANCIAL DATA
HVN
Revenue / Sales $1.99bn
Interest Expense $26.3m
EBIT $524.38m
Net Profit Before Tax $530.17m
Net Profit After Tax $380.05m
Current Assets $1.317bn
Total Assets $4.577bn
Current Liabilities $829.96m
Total Liabilities $1.63bn
Total Equity $2.937bn
6 | P a g e
⊘ This is a preview!⊘
Do you want full access?
Subscribe today to unlock all pages.
Trusted by 1+ million students worldwide
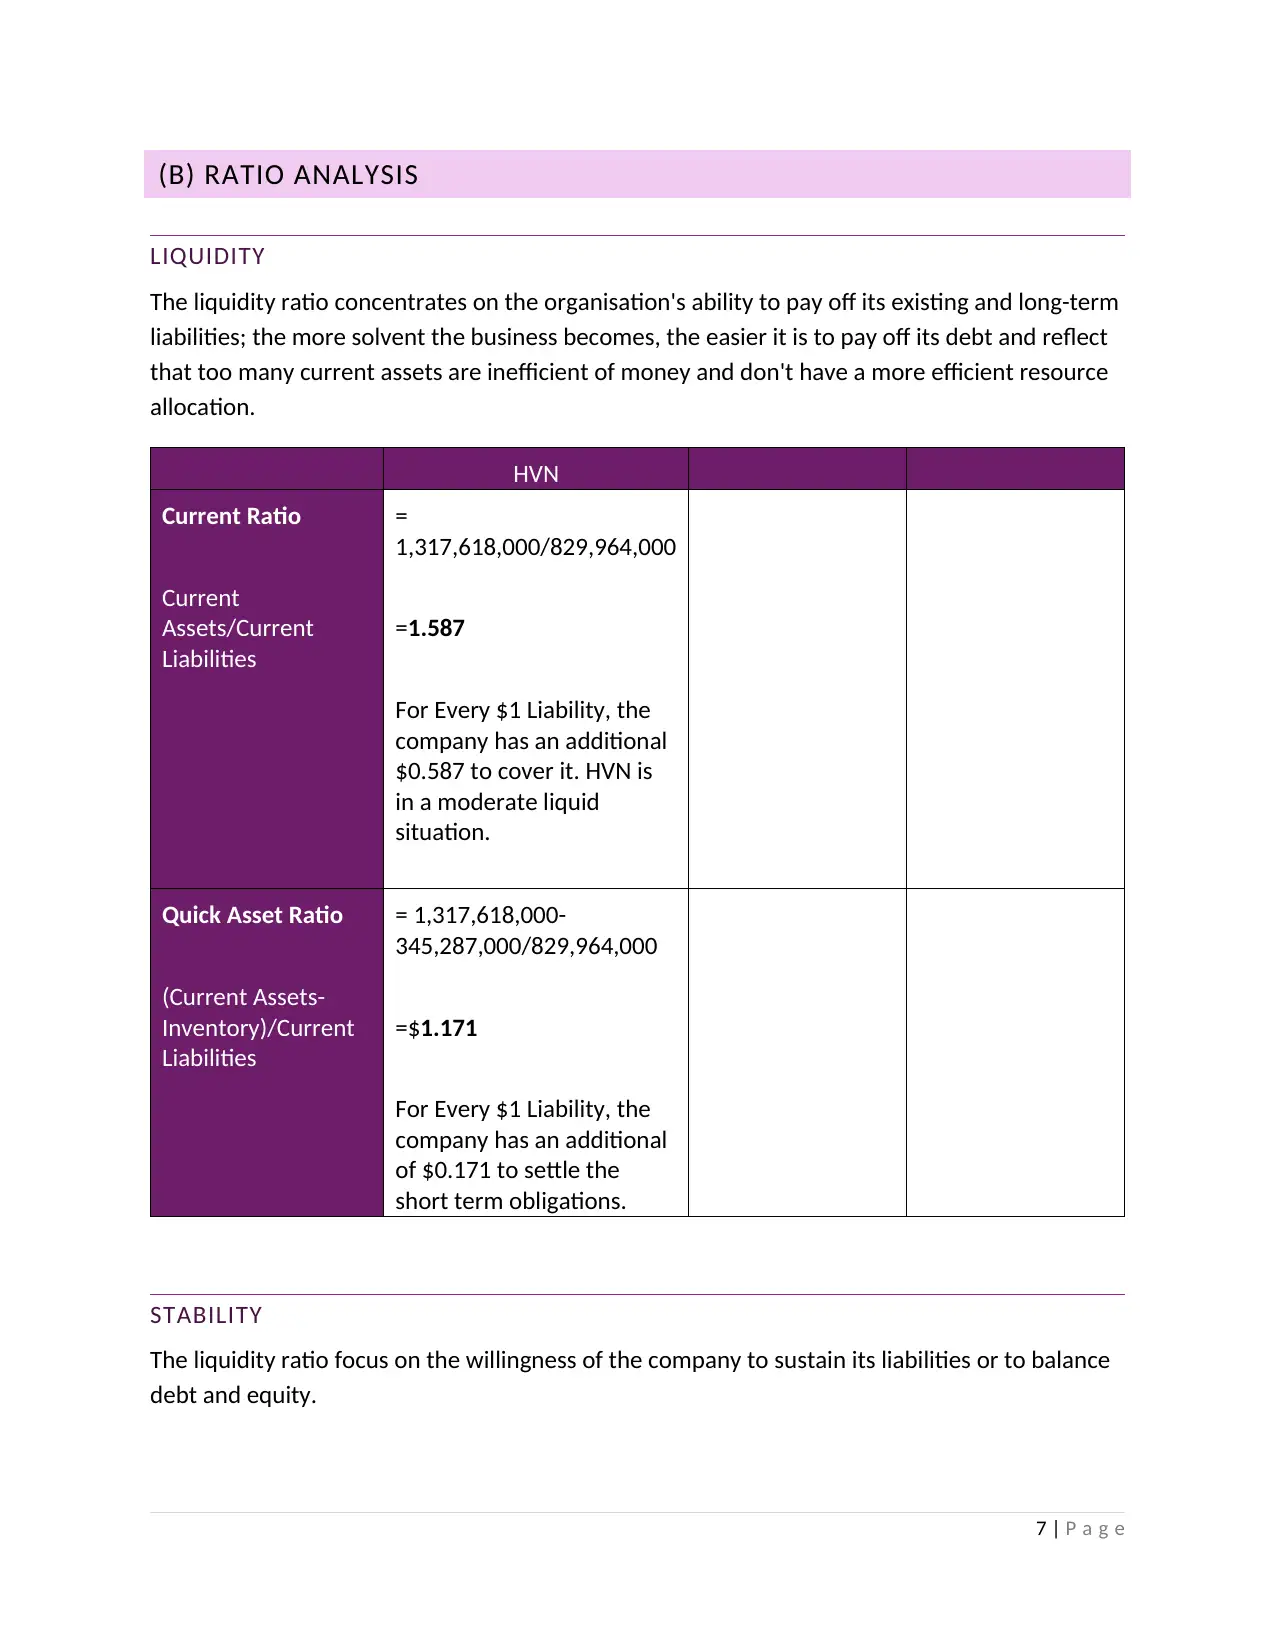
(B) RATIO ANALYSIS
LIQUIDITY
The liquidity ratio concentrates on the organisation's ability to pay off its existing and long-term
liabilities; the more solvent the business becomes, the easier it is to pay off its debt and reflect
that too many current assets are inefficient of money and don't have a more efficient resource
allocation.
HVN
Current Ratio
Current
Assets/Current
Liabilities
=
1,317,618,000/829,964,000
=1.587
For Every $1 Liability, the
company has an additional
$0.587 to cover it. HVN is
in a moderate liquid
situation.
Quick Asset Ratio
(Current Assets-
Inventory)/Current
Liabilities
= 1,317,618,000-
345,287,000/829,964,000
=$1.171
For Every $1 Liability, the
company has an additional
of $0.171 to settle the
short term obligations.
STABILITY
The liquidity ratio focus on the willingness of the company to sustain its liabilities or to balance
debt and equity.
7 | P a g e
Paraphrase This Document
Need a fresh take? Get an instant paraphrase of this document with our AI Paraphraser
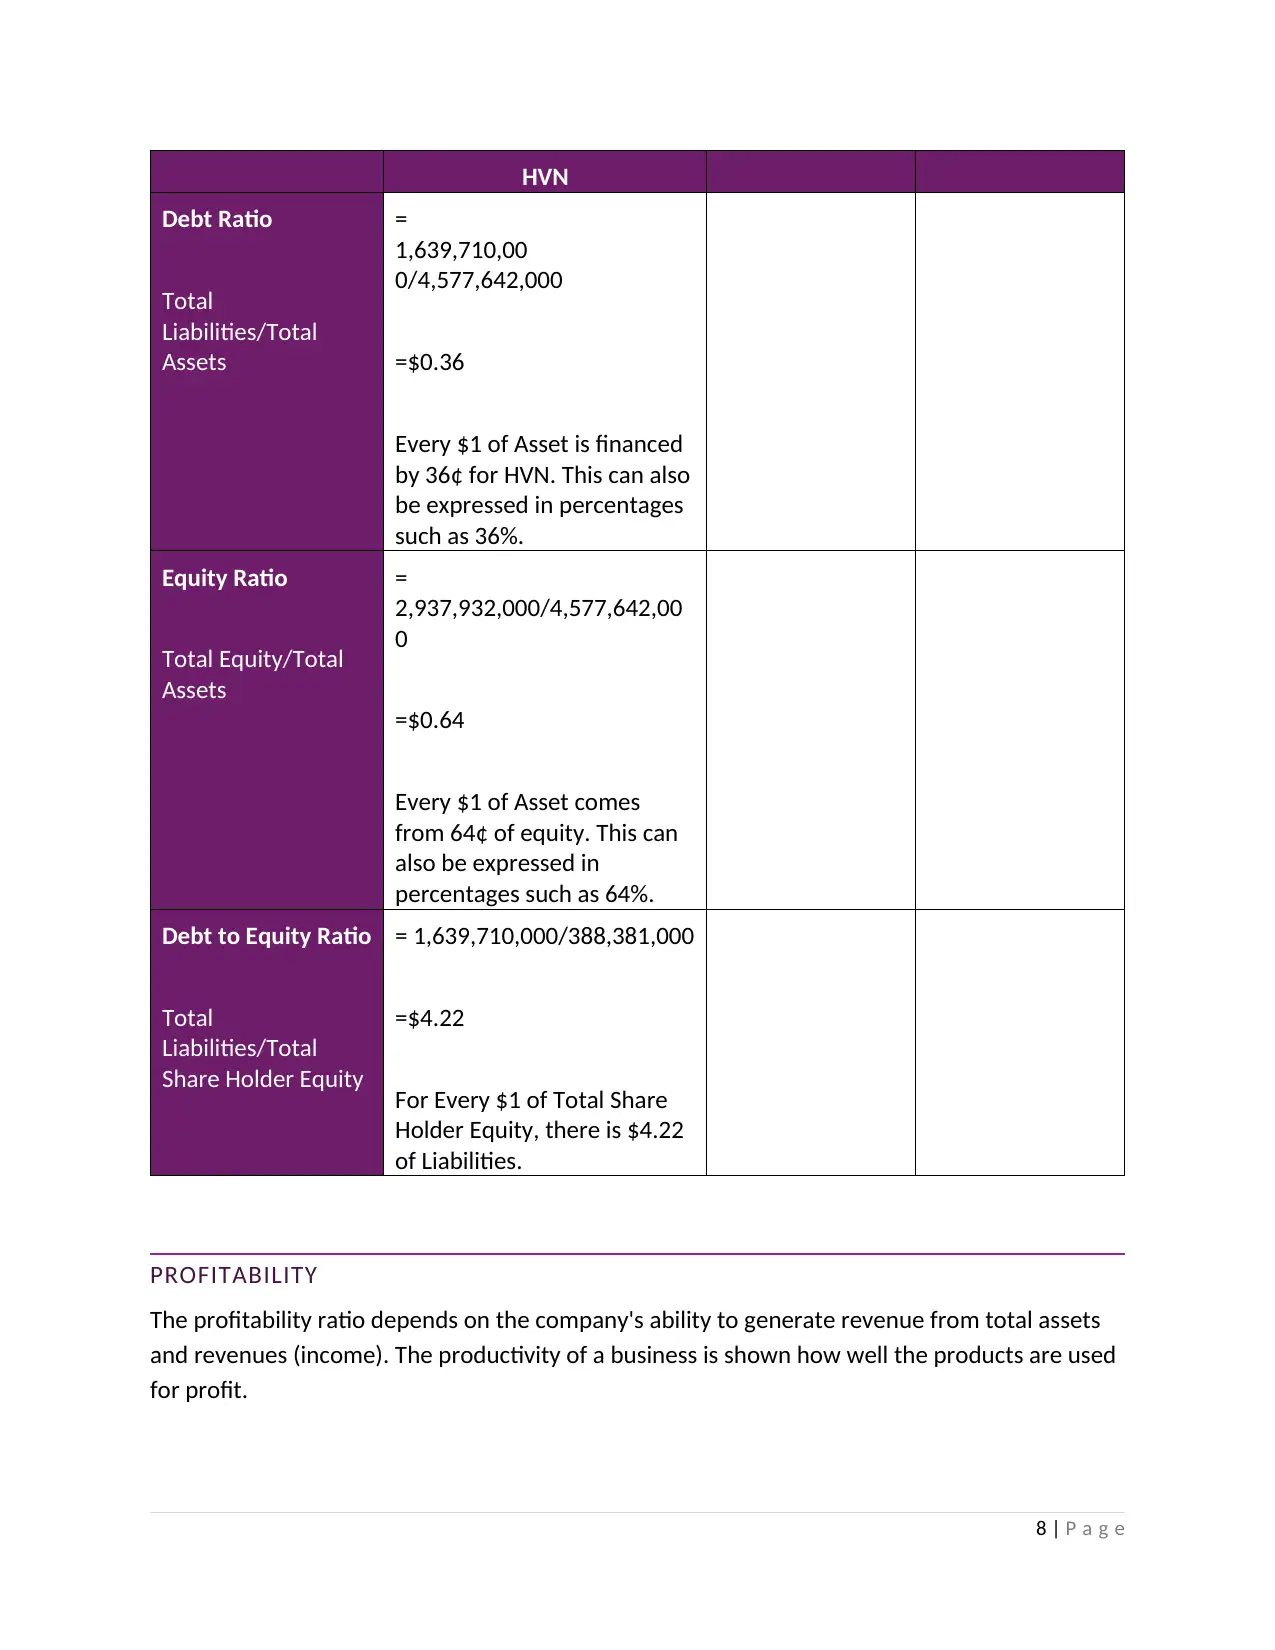
HVN
Debt Ratio
Total
Liabilities/Total
Assets
=
1,639,710,00
0/4,577,642,000
=$0.36
Every $1 of Asset is financed
by 36¢ for HVN. This can also
be expressed in percentages
such as 36%.
Equity Ratio
Total Equity/Total
Assets
=
2,937,932,000/4,577,642,00
0
=$0.64
Every $1 of Asset comes
from 64¢ of equity. This can
also be expressed in
percentages such as 64%.
Debt to Equity Ratio
Total
Liabilities/Total
Share Holder Equity
= 1,639,710,000/388,381,000
=$4.22
For Every $1 of Total Share
Holder Equity, there is $4.22
of Liabilities.
PROFITABILITY
The profitability ratio depends on the company's ability to generate revenue from total assets
and revenues (income). The productivity of a business is shown how well the products are used
for profit.
8 | P a g e
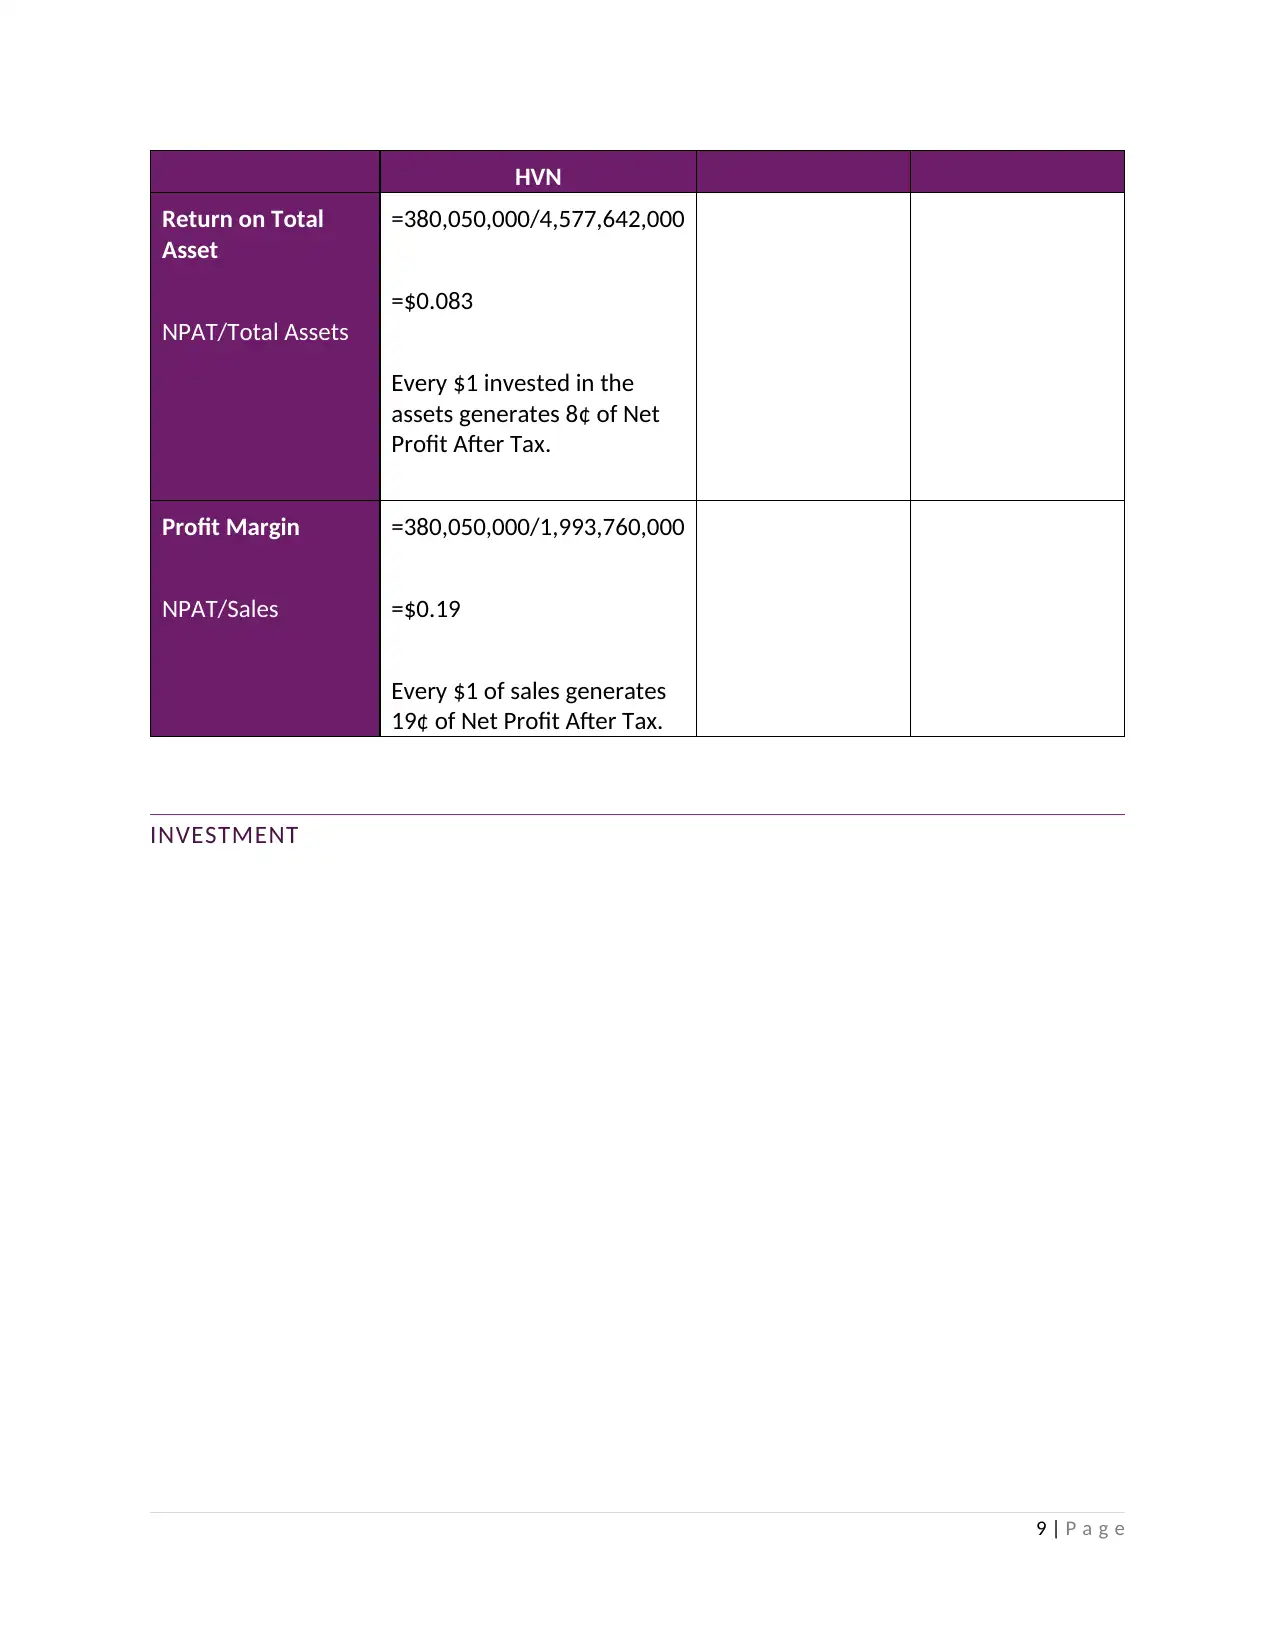
HVN
Return on Total
Asset
NPAT/Total Assets
=380,050,000/4,577,642,000
=$0.083
Every $1 invested in the
assets generates 8¢ of Net
Profit After Tax.
Profit Margin
NPAT/Sales
=380,050,000/1,993,760,000
=$0.19
Every $1 of sales generates
19¢ of Net Profit After Tax.
INVESTMENT
9 | P a g e
Return on Total
Asset
NPAT/Total Assets
=380,050,000/4,577,642,000
=$0.083
Every $1 invested in the
assets generates 8¢ of Net
Profit After Tax.
Profit Margin
NPAT/Sales
=380,050,000/1,993,760,000
=$0.19
Every $1 of sales generates
19¢ of Net Profit After Tax.
INVESTMENT
9 | P a g e
⊘ This is a preview!⊘
Do you want full access?
Subscribe today to unlock all pages.
Trusted by 1+ million students worldwide
REFERENCES
Motley Fool Australia. (2019). Why JP Morgan just cut this popular retail stock to “sell”. [online] Available at:
https://www.fool.com.au/2019/09/02/why-jp-morgan-just-cut-this-popular-retail-stock-to-sell/ [Accessed 16 Oct.
2019].
St, S. (2019). A Holistic Look At Harvey Norman Holdings Limited (ASX:HVN). [online] Simply Wall St. Available at:
https://simplywall.st/stocks/au/retail/asx-hvn/harvey-norman-holdings-shares/news/a-holistic-look-at-harvey-
norman-holdings-limited-asxhvn/ [Accessed 16 Oct. 2019].
10 | P a g e
Paraphrase This Document
Need a fresh take? Get an instant paraphrase of this document with our AI Paraphraser
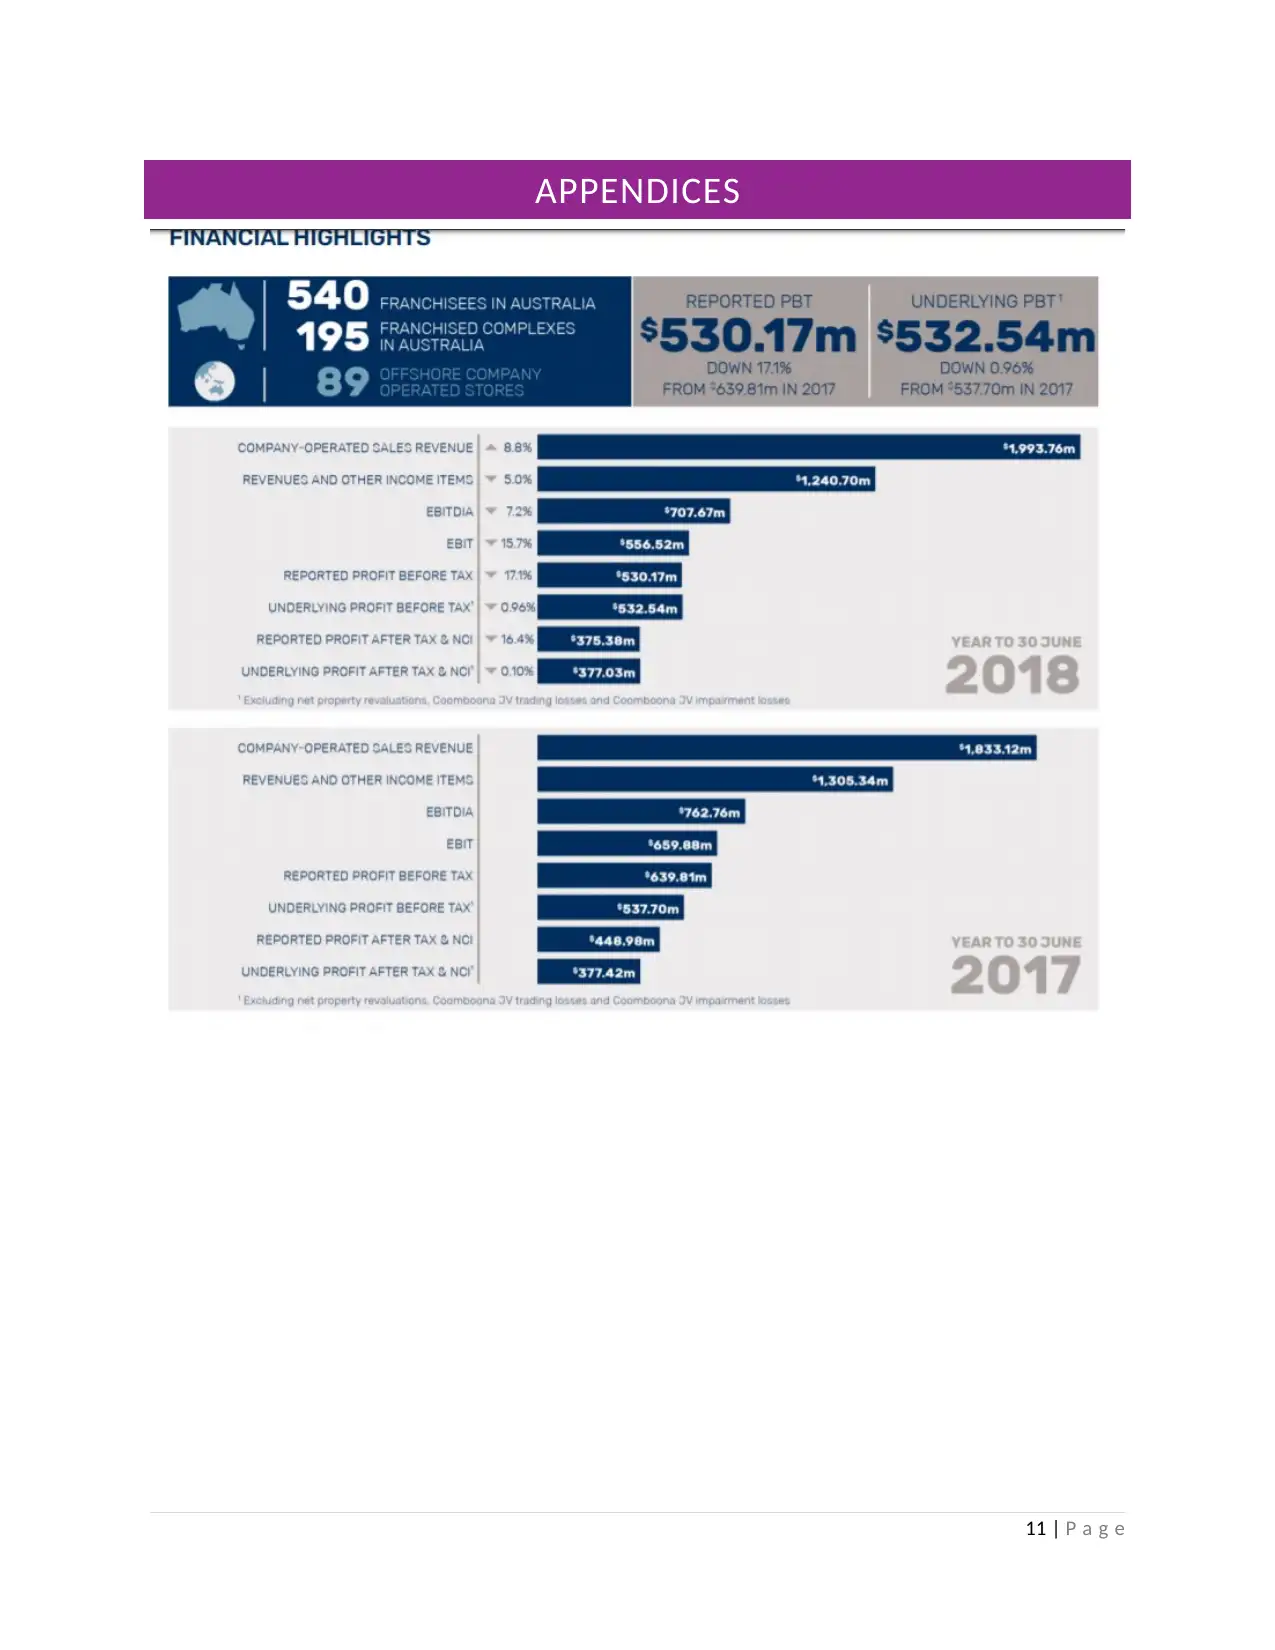
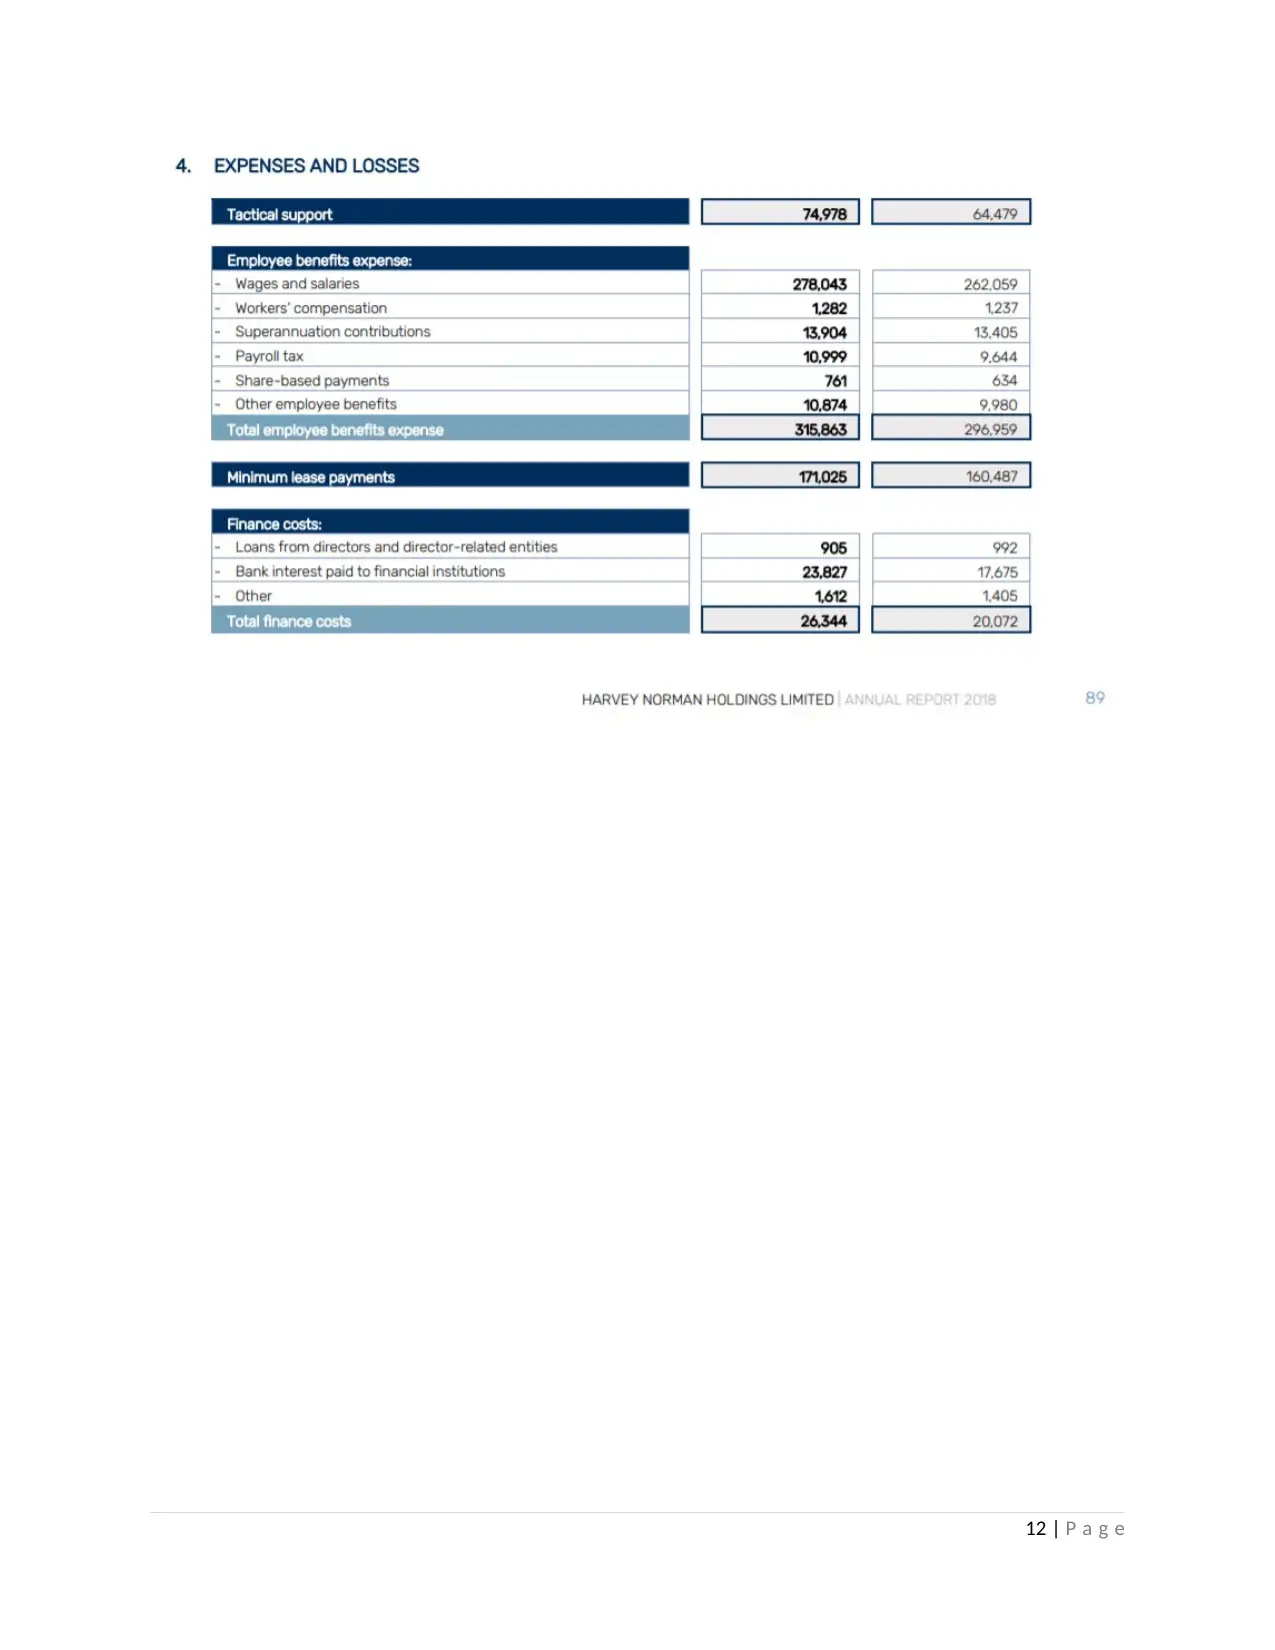
APPENDICES
11 | P a g e
11 | P a g e
12 | P a g e
⊘ This is a preview!⊘
Do you want full access?
Subscribe today to unlock all pages.
Trusted by 1+ million students worldwide
1 out of 15


Your All-in-One AI-Powered Toolkit for Academic Success.
+13062052269
info@desklib.com
Available 24*7 on WhatsApp / Email
![[object Object]](/_next/static/media/star-bottom.7253800d.svg)
Unlock your academic potential
Copyright © 2020–2026 A2Z Services. All Rights Reserved. Developed and managed by ZUCOL.